Pivot, EMA, Stoch, RSI, Alert, Indicator

MQL4 Indicadores

Tarea técnica

Hi Can I have an indicator with following requirements:


A. Plot Monthly, Weekly and Daily Pivot Points in any chart / time frame I am in.

   1. Color & size of each line should be adjustable (Default- Monthly: Red, Weekly: Orange, Daily: Yellow)

   2. Each lines can be set to visible or invisible

   3. All lines can be either diplayed only at the right side of chart or draw across the chart  


B. Plot a line for any price which is a whole number in any chart / time frame I am in.

   1. Color & size of line should be adjustable (Default: White)

   2. Line can be set to visible or invisible

   3. All lines can be either diplayed only at the right side of chart or draw across the chart   


C. Plot a line for 200 Period EMA calculated using Daily timeframe in any chart / time frame I am in.

   1. Color & size of line should be adjustable (Default: Red)

   2. Line can be set to visible or invisible

   3. All lines can be either diplayed only at the right side of chart or draw across the chart   


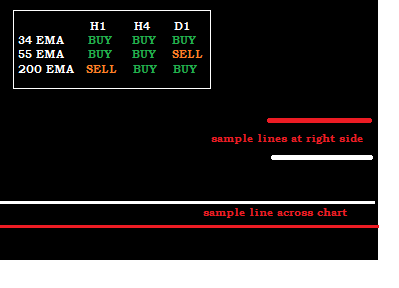
D. Price trend signals from Daily, H4 and H1 timeframes.

   Check if price is below or above following EMA's on Daily, H4 and H1 timeframes and display warning accordingly on chart corner with font adjustable

   (attached sample image on how it should display)

   34  Period EMA / Close

   55  Period EMA / Close

   200 Period EMA / Close


E. Price alert (mobile/email) on following conditions. (Soch & RSI inputs should adjustable).

   (Display of Stoch and RSI on chart can be set to visible or invisible).

    1. Uptrend End Alert for H1:

        Condition: H1 trend is UP,  Stochastic is oversold AND RSI is oversold (Both should be true. If RSI enters first wait for Stoch and vice versa)

    2. Downtrend End Alert for H1:

        Condition: H1 trend is DOWN,  Stochastic is overbought AND RSI is overbought (Both should be true. If RSI enters first wait for Stoch and vice versa)

    3. Uptrend End Alert for H4:

        Condition: H4 trend is UP,  Stochastic is oversold AND RSI is oversold (Both should be true. If RSI enters first wait for Stoch and vice versa)

    4. Downtrend End Alert for H4:

        Condition: H4 trend is DOWN,  Stochastic is overbought AND RSI is overbought (Both should be true. If RSI enters first wait for Stoch and vice versa)

    5. Uptrend End Alert for D1:

        Condition: D1 trend is UP,  Stochastic is oversold AND RSI is oversold (Both should be true. If RSI enters first wait for Stoch and vice versa)

    6. Downtrend End Alert for D1:

        Condition: D1 trend is DOWN,  Stochastic is overbought AND RSI is overbought (Both should be true. If RSI enters first wait for Stoch and vice versa)

     7. Master alert when all timeframes - H1, H4, D1 - are in the same trend direction and Stochastic AND RSI is overbought in ALL TIMEFRAMES or oversold in ALL TIMEFRAMES


 Attached sample images.

Archivos adjuntos:

TXT
spec.txt
2.9 Kb

Han respondido

1
Desarrollador 1
Evaluación
(91)
Proyectos
144
38%
Arbitraje
67
15% / 48%
Caducado
55
38%
Libre
2
Desarrollador 2
Evaluación
(66)
Proyectos
143
34%
Arbitraje
10
10% / 60%
Caducado
26
18%
Trabaja
3
Desarrollador 3
Evaluación
(121)
Proyectos
134
66%
Arbitraje
36
25% / 56%
Caducado
22
16%
Libre
4
Desarrollador 4
Evaluación
(94)
Proyectos
162
40%
Arbitraje
20
15% / 75%
Caducado
73
45%
Libre
Solicitudes similares
Hi there Here is a video of the logic: its based on market structure and swings using validated highs and lows based on candle closure. Just in case you would like to take a look at the code/indicator here is the link: https://youtu.be/igj0OaQoM7o?si=7nigL8OU2Nt1Zxkx Let me know if you can help
I am looking for a professional developer to help me with creating a hedge grid bot. The concept is in the picture. The bot is quite simple. The bot basically opens buy and sell positions on each grid and self terminates when the upper limit (manually set is reached) 1. Set timer for new's releases (manual entry) 2. Slippage in pip's (manual entry) 3. Maximum drawdown in USD with self termination when entry
I need alerts for 2 kinds of triangles (contracting & expanding) and 2 kinds of channels (up & dn) before that you should be able to put trendlines to any buffered (usually 0 & 1) zigzag indicators the method of drawing trendline is different i can show them with the pictures
Nt8 30+ USD
I trade in NT8 and would like to code an Elliott wave measurment tool, which is very easy because I have the major Script for that.We need only to add some aspects into it. If you are interested,if you can do this do well to bid on it
Hi I am looking for converting an indicator from MT4 to Mt5 It is Tom De Mark sequential This code is based off of the Tom DeMark TD Sequential Indicator. Basic criteria is as follows: | | TD Setup | TD Countdown | |------------------ |---------------------------------------------------- |---------------------------------------------------|
Tradingview indicator 30 - 50 USD
Looking for a tradingview expert to do a quick job . It is an indicator so apply only if you are capable. Price is negotiable Check attached file and proofs that you can get it done perfectly
Blue Angel Shark 30 - 120 USD
I would like a coded indicator that is able to combine Smart money concept, Pure price Action and Pine script so as to spot trade entries by giving Take profits and Stop loss should also be compatible with all timeframes in trading and also work with all forex markets and Derived synthetic indices. I will upload a picture below. Kindly
I need you to convert this tradingview indicator (PineScript) to MT5. The indicator need to work in any time frame and as the proposed script. It need to plot the ATR bands (as you can see in the attached image) and work as the proposed routine of ATR bands, when price close above or below the bands, the bars will change color (as you can see in the script and the image attached). Instead of sending alerts of buying
"Seeking an adept developer to help realize my custom NT8 strategy. Your expertise is integral to achieving success in this project. Are you interested in teaming up for a productive collaboration? Let's discuss the details together. Thank you!"
NinjaTrader 8 indicator that plots open prices of higher time frame bars. Time frames to choose from in the properties: 15sec, 30sec, 1min, 5min, 15min, 30min, 1hr, 4hr, 1day, 1week, 1month, 1 year (or any time based periods if that would make the development easier). Ability to customize lines is needed (style, color, thickness, etc.). Also, ability to extend certain lines all the way to the right by clicking on

Información sobre el proyecto

Presupuesto
10 - 25 USD
Para el ejecutor
9 - 22.5 USD
Plazo límite de ejecución
de 1 a 3 día(s)