スピーディに自動売買ロボットを注文する方法を見る
注文を投稿するまたは受注する前にルールをご覧ください。
MQL5およびMQL4で自動売買ロボットを注文する方法
ロボットを注文するにはサンプル要件仕様をご覧ください
カテゴリでの新規注文:
30+ USD
30 - 150 USD
30+ USD
指定
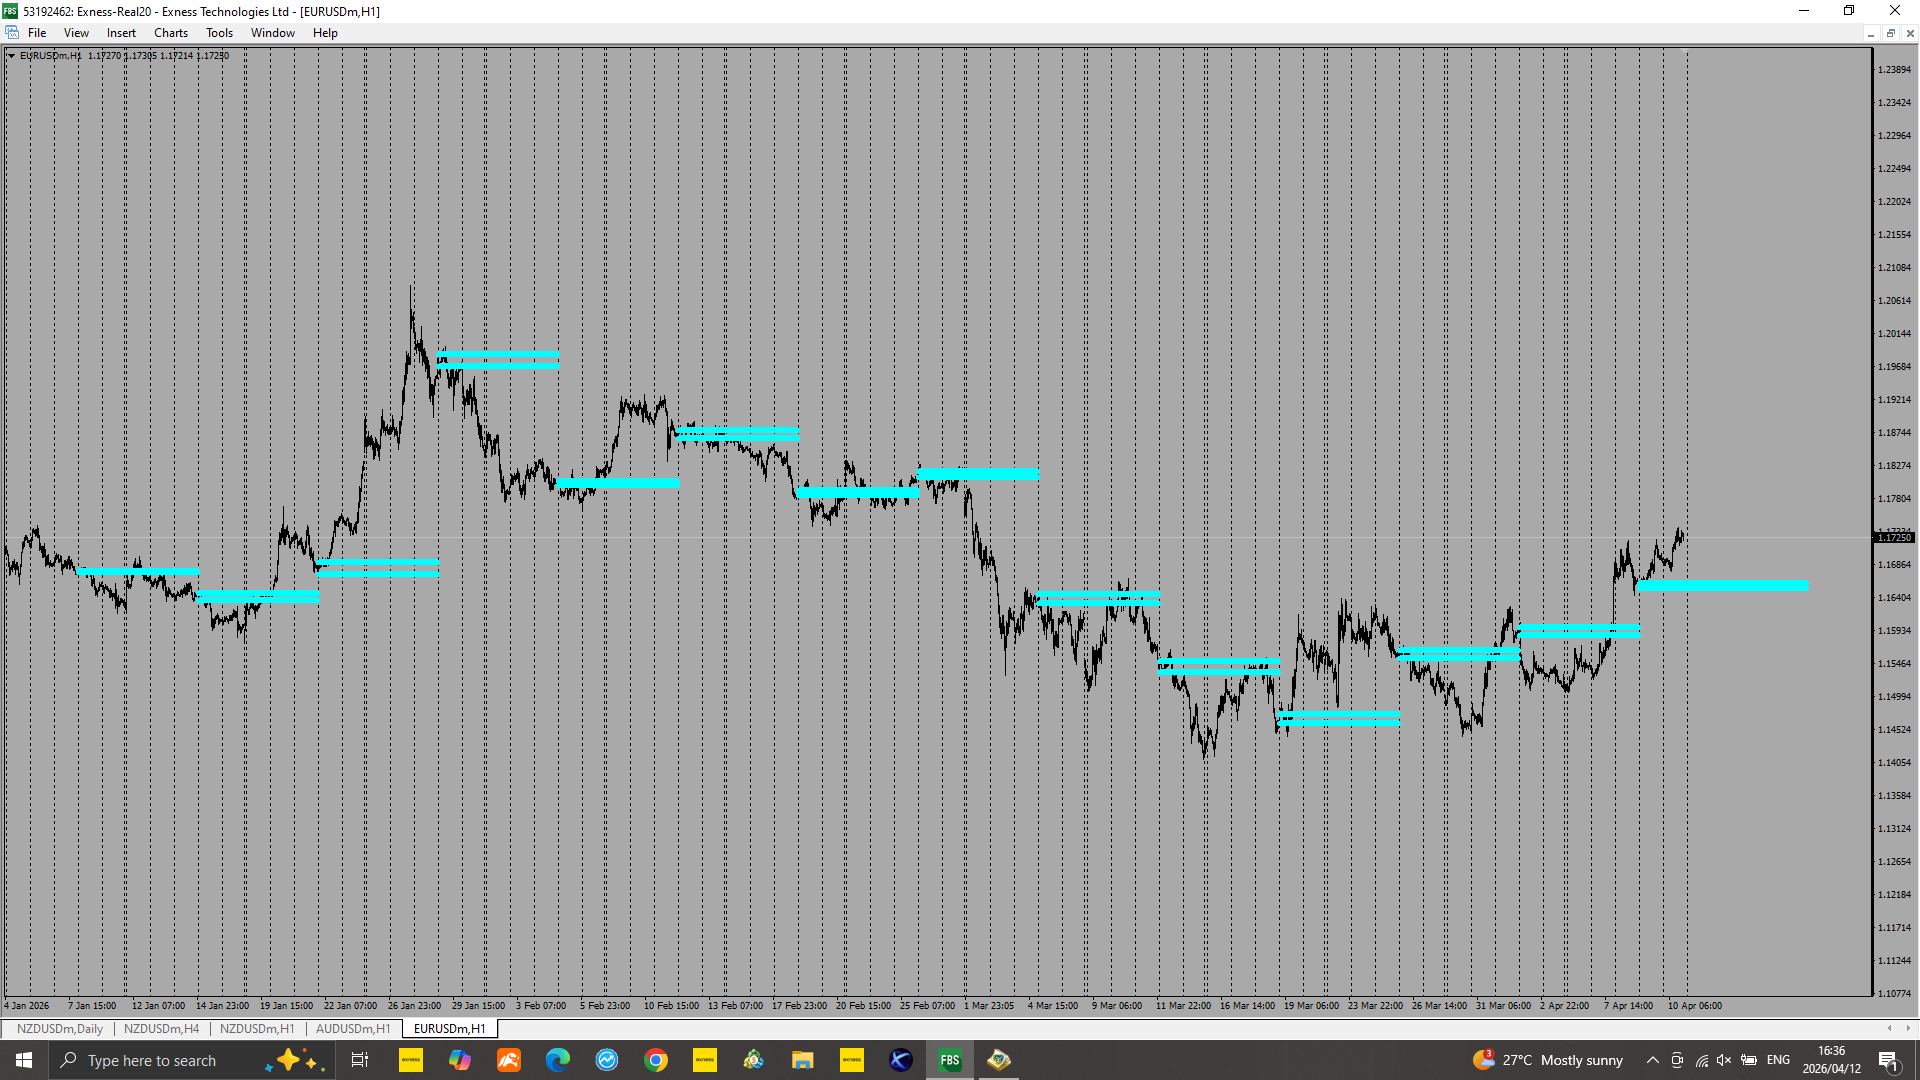
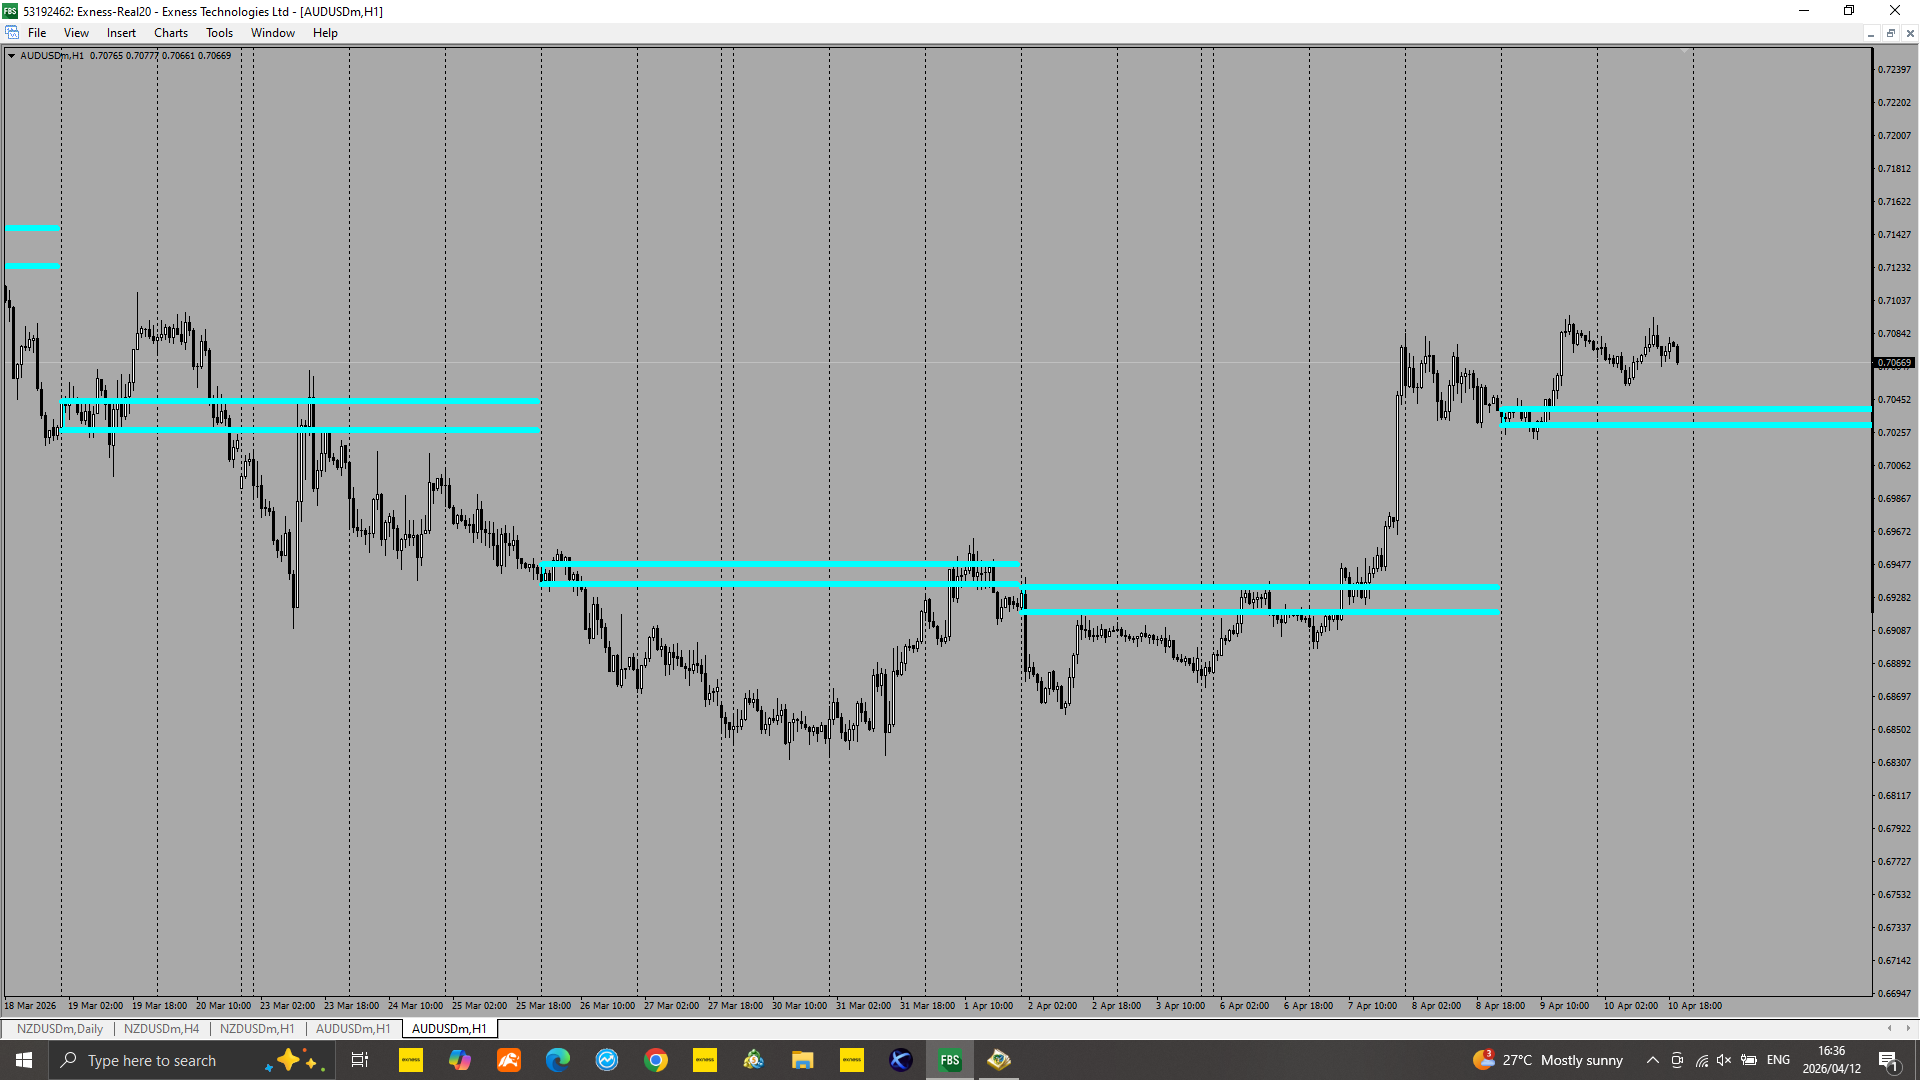
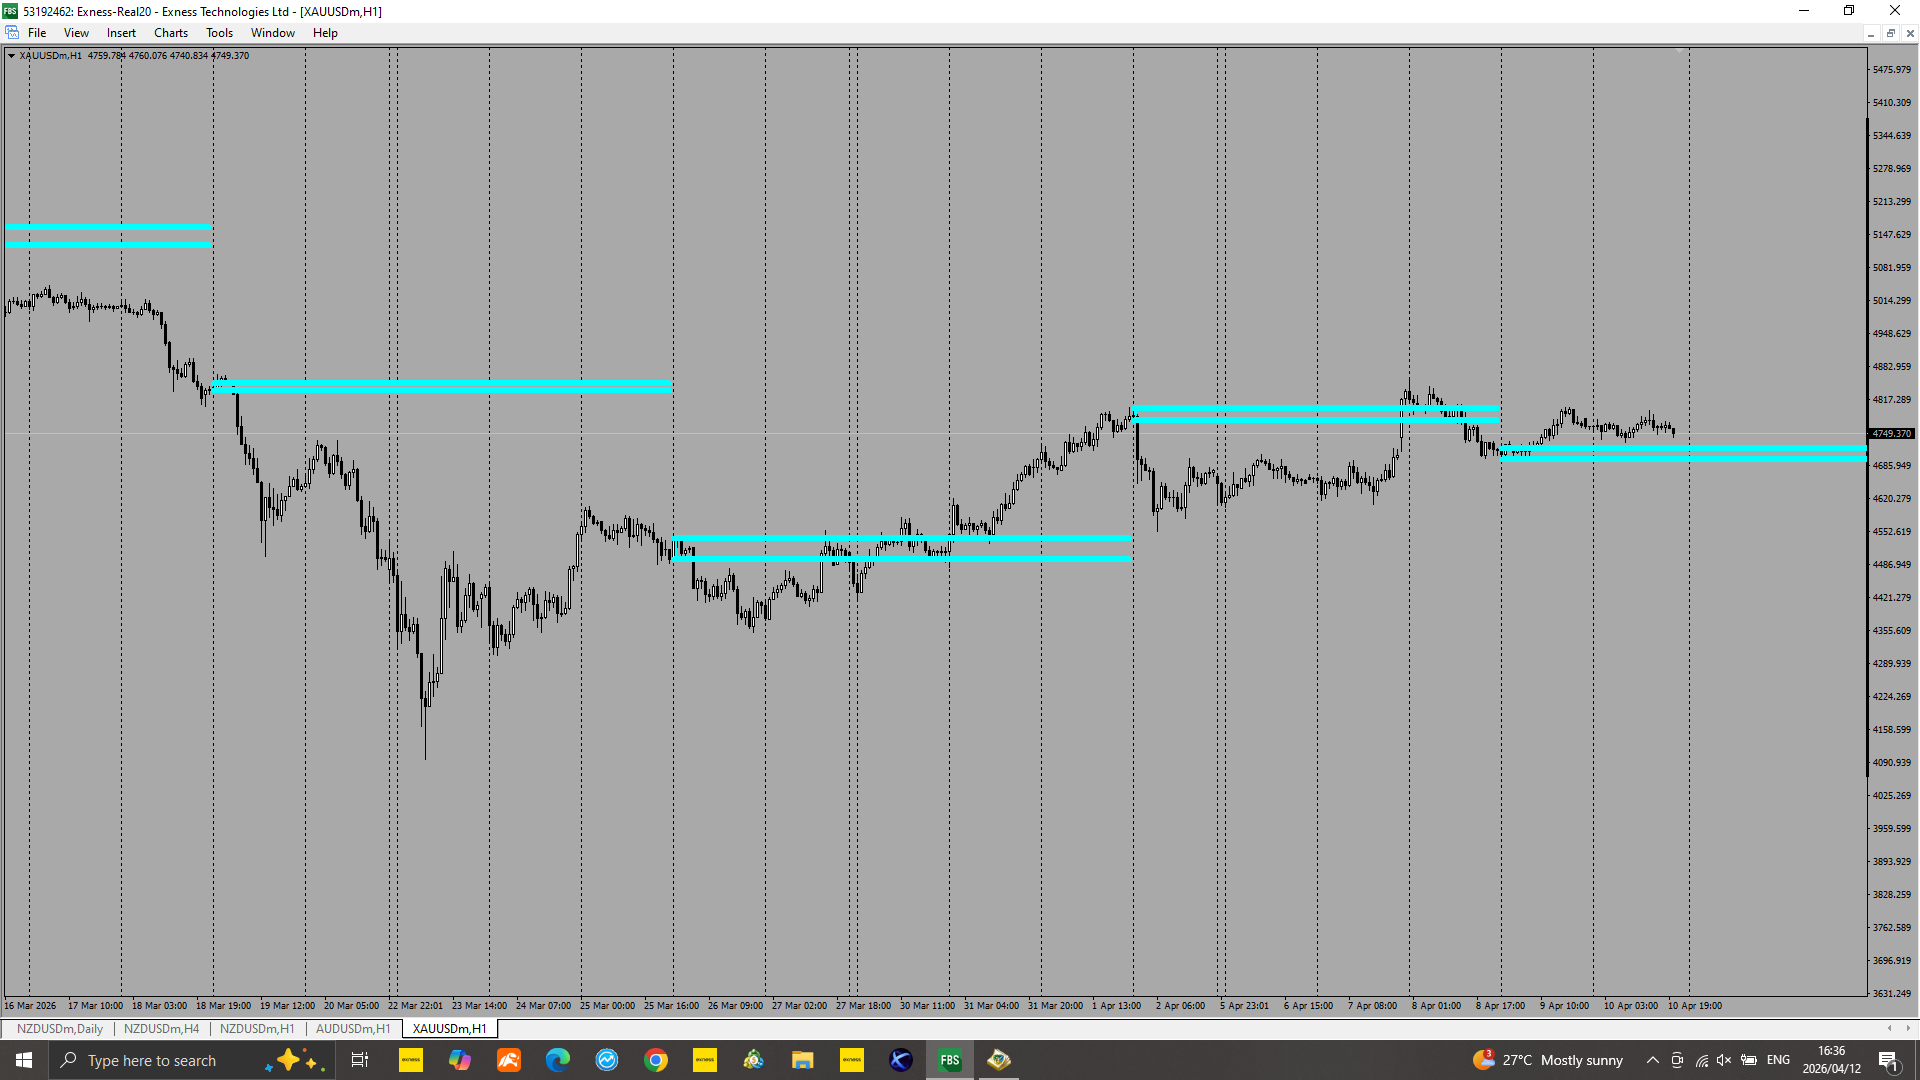
I would like to request a programmer to help me with the programming of a dashboard. The indicator I have attached is an indicator that draws two horizontal lines on the high and low of the first hour candle of the day of every Thursday of the week. The two lines stretches through to Wednesday next week. From there, the dashboard must show above(Blue) if price is above the high/(upper horizontal line) of first hour candle of the Thursday, and the dashboard must also show below(Red) if price is below the low/(lower horizontal line) of the first hour candle. If it happens that price is trapped in between the two horizontal lines I want the dashboard to show neutral(Black). I want to be able add and delete all the symbols I want to see on the dashboard. The timeframe for this indicator is the 1 hour time frame ONLY. LET'S CHAT
応答済み
1
評価
プロジェクト
694
42%
仲裁
2
100%
/
0%
期限切れ
1
0%
暇
パブリッシュした人: 9 codes
2
評価
プロジェクト
1
0%
仲裁
0
期限切れ
0
暇
3
評価
プロジェクト
60
53%
仲裁
7
86%
/
0%
期限切れ
2
3%
暇
4
評価
プロジェクト
602
34%
仲裁
65
20%
/
57%
期限切れ
147
24%
仕事中
パブリッシュした人: 1 article, 22 codes
5
評価
プロジェクト
12
0%
仲裁
3
33%
/
33%
期限切れ
1
8%
暇
6
評価
プロジェクト
838
61%
仲裁
33
27%
/
45%
期限切れ
24
3%
暇
パブリッシュした人: 1 code
7
評価
プロジェクト
179
25%
仲裁
24
17%
/
75%
期限切れ
16
9%
暇
8
評価
プロジェクト
0
0%
仲裁
0
期限切れ
0
暇
9
評価
プロジェクト
129
25%
仲裁
24
29%
/
54%
期限切れ
8
6%
暇
10
評価
プロジェクト
91
13%
仲裁
34
26%
/
59%
期限切れ
37
41%
暇
11
評価
プロジェクト
27
7%
仲裁
9
33%
/
33%
期限切れ
1
4%
仕事中
12
評価
プロジェクト
102
23%
仲裁
12
25%
/
17%
期限切れ
13
13%
暇
13
評価
プロジェクト
29
34%
仲裁
4
50%
/
25%
期限切れ
5
17%
仕事中
14
評価
プロジェクト
478
40%
仲裁
105
40%
/
24%
期限切れ
82
17%
取り込み中
パブリッシュした人: 2 codes
15
評価
プロジェクト
11
55%
仲裁
0
期限切れ
0
暇
16
評価
プロジェクト
84
64%
仲裁
5
100%
/
0%
期限切れ
9
11%
暇
17
評価
プロジェクト
1
0%
仲裁
5
0%
/
100%
期限切れ
0
暇
18
評価
プロジェクト
711
33%
仲裁
45
49%
/
42%
期限切れ
14
2%
仕事中
19
評価
プロジェクト
0
0%
仲裁
0
期限切れ
0
暇
20
評価
プロジェクト
5
0%
仲裁
0
期限切れ
0
暇
21
評価
プロジェクト
0
0%
仲裁
0
期限切れ
0
暇
22
評価
プロジェクト
15
47%
仲裁
1
100%
/
0%
期限切れ
3
20%
仕事中
類似した注文
Code An Loss Rate 90-100% MT5 EA , that can blow a 100 USD account a day ,with fixed TP of 3000 points and SL of 3000 For better Rate Calculations get an strategy that can lead to so
Shooter razor
30+ USD
Makes it takes trades by it self buy and sell, it must use the higher signals, also when I press stop it must not pick any trades I want it to take trades automatically when I press start also close by it self
Hello looking for someone to convert an indicator from tradingview to Thinkorswim I have attached the codes from trading view Also, I like make it trigger (alert) a one-time alert when the trend changes, and can also create a custom watchlist column that flags symbols currently in a new trend so you can scan multiple stocks easily. And like the watchlist to show only fresh trend changes or the current trend direction
Version document : 1.0 Plateforme : TradingView Langage : Pine Script v6 Type : Indicateur d'analyse et d'aide à la décision (non-exécutant) 1. Présentation du projet Nom du produit ONYX SR V2 — Intelligent Support & Resistance Scalping System Objectif Créer un indicateur TradingView capable d'identifier automatiquement des opportunités de scalping basées sur : supports et résistances dynamiques ; action du prix ;
I have a EA/indicator that I want built. I should say 1st off dont know how to code myself so I will be using AI to verify that the source code is complete and matches the documents spec or if better so if you can not truly do the job do not waste either of out time. This is a idea I came.up wit and used AI to produce a framework for it.... and of course AI isn't 100% accurate so I need a knowledgeable quantitative
TumiiFX
30 - 20000 USD
1. Use two EMAs: 20 and 50. If EMA 20 is above EMA 50 → uptrend (look for buys) If EMA 20 is below EMA 50 → downtrend (look for sells) 2. Wait for a pullback into the area between the two EMAs. - For buys: price must touch or move between EMA 20 and EMA 50 during the last few candles. - For stils: same idea, but in a downtrend. 3. Entry signal: Buy: a bullish engulfing candle in an uptrend after the pullback
I Need HFT bot working on MT4
30 - 100 USD
I am looking for an experienced MQL4 developer to build a professional High-Frequency Trading (HFT) / Low-Latency Expert Advisor for MetaTrader 4 (MT4) . The EA will be deployed on an IC Markets Live account and should be optimized for the fastest possible execution using a low-latency VPS located in LD4 or NY4 . The primary instruments will be US30 and XAUUSD (Gold) . The goal is to create an EA capable of
A robot
50+ USD
HIGH-FREQUENCY M5/M15 CONCURRENT ENTRY SNIPER import time class HighFrequencySniper: def __init__(self): self.target_profit = 25.00 # Targeted Delta Move self.max_execution_time = 3600 # 1 Hour Sandbox (Seconds) self.lot_allocation = "CALIBRATED_TO_RISK" def execute_hft_scan(self, current_price, m5_rsi, m15_order_block): print(f"[SCANNING] Current Kernel Metric: ${current_price:.2f
I need a trading bot, please i need this project urgently and when messaing me kindly send me samples of past works and dont forget i need the project to be done as soon as possible
ENTRY EXIT TIMING (ET BANDS)
30 - 50 USD
QUIERO CONSEGUIR EL CODIGO FUENTE DE ESTE INDICADOR QUE ME GUSTA MUCHO TAMBIEN TIENE EL NOMBRE DE ET BANDS O ENTRY EXIT TIMING . no se los componentes pero estas son las imagenes. que mejor lo describen
プロジェクト情報
予算
30 - 50 USD
締め切り
最低 0 最高 100 日