类别中的新订单:
指定
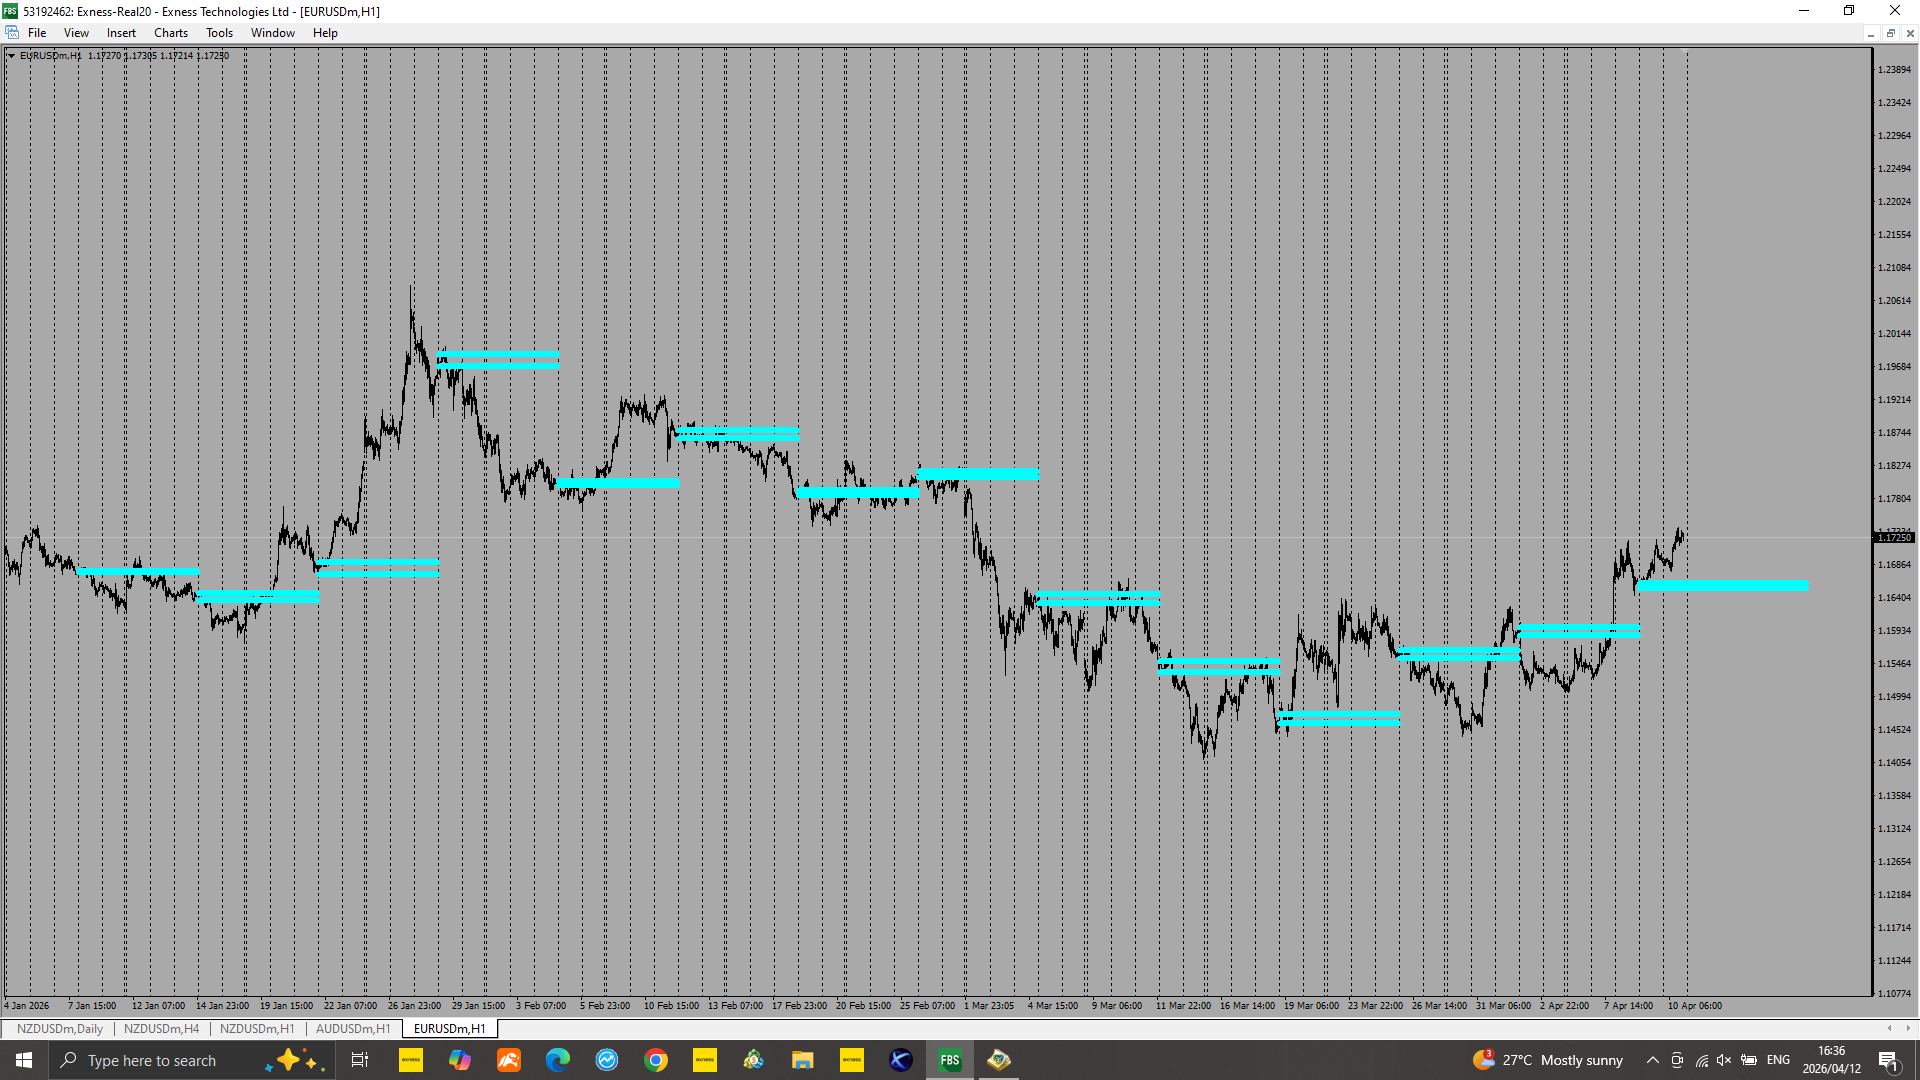
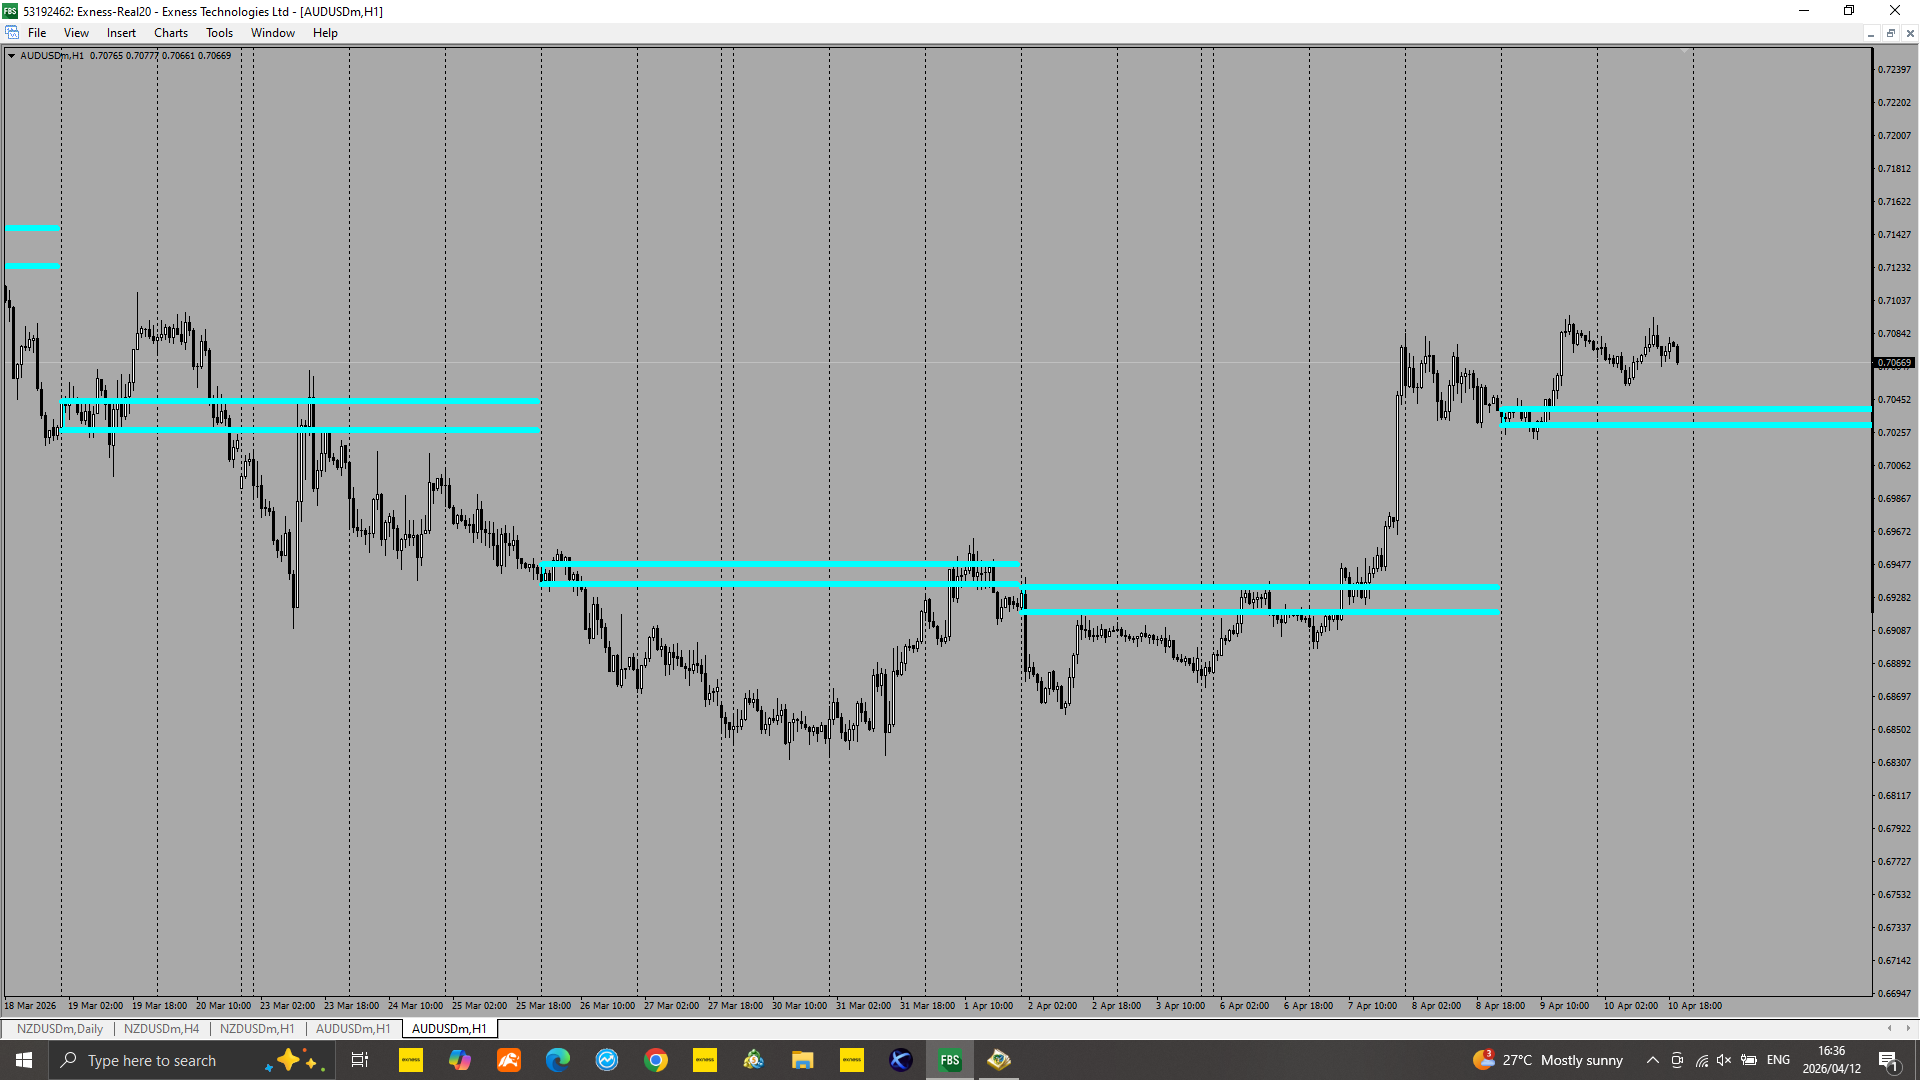
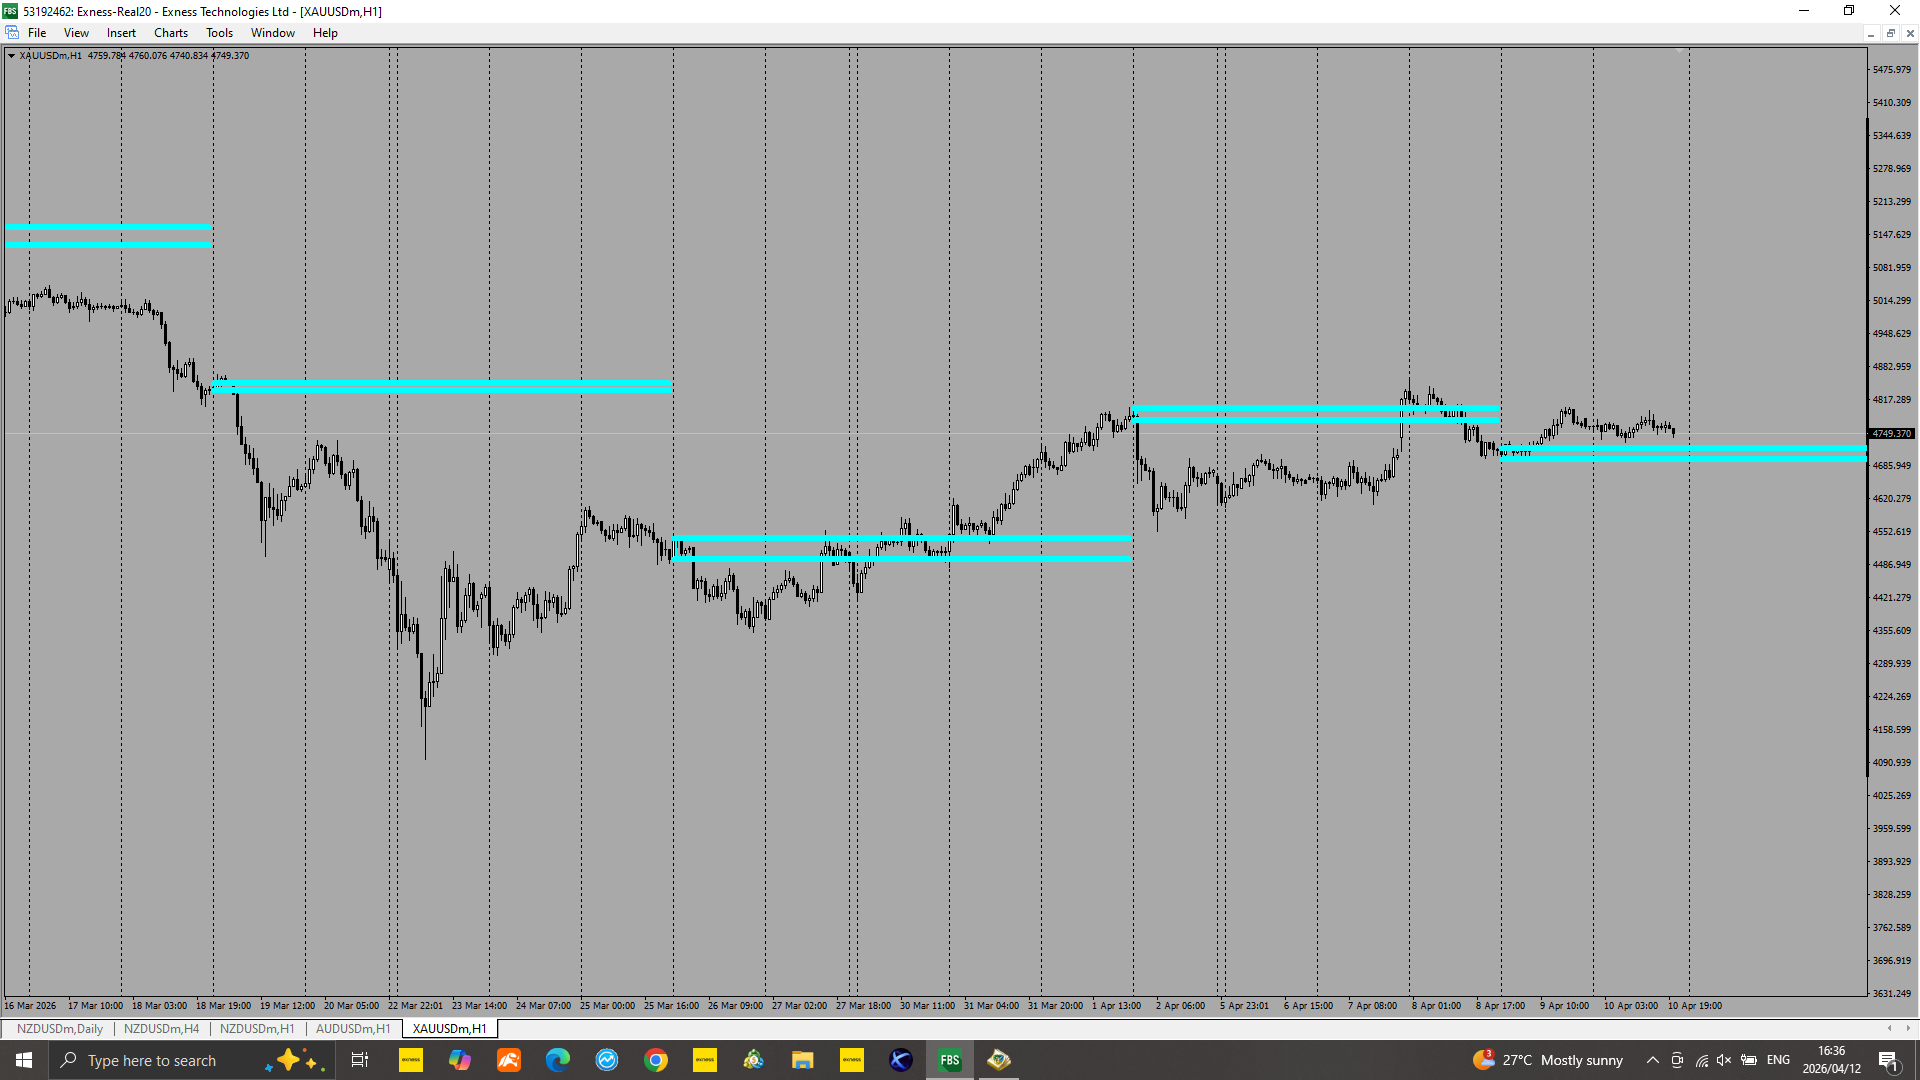
I would like to request a programmer to help me with the programming of a dashboard. The indicator I have attached is an indicator that draws two horizontal lines on the high and low of the first hour candle of the day of every Thursday of the week. The two lines stretches through to Wednesday next week. From there, the dashboard must show above(Blue) if price is above the high/(upper horizontal line) of first hour candle of the Thursday, and the dashboard must also show below(Red) if price is below the low/(lower horizontal line) of the first hour candle. If it happens that price is trapped in between the two horizontal lines I want the dashboard to show neutral(Black). I want to be able add and delete all the symbols I want to see on the dashboard. The timeframe for this indicator is the 1 hour time frame ONLY. LET'S CHAT
反馈
1
等级
项目
694
42%
仲裁
2
100%
/
0%
逾期
1
0%
空闲
发布者: 9 代码
2
等级
项目
1
0%
仲裁
0
逾期
0
空闲
3
等级
项目
60
53%
仲裁
7
86%
/
0%
逾期
2
3%
空闲
4
等级
项目
602
34%
仲裁
65
20%
/
57%
逾期
147
24%
工作中
发布者: 1 文章, 22 代码
5
等级
项目
12
0%
仲裁
3
33%
/
33%
逾期
1
8%
空闲
6
等级
项目
838
61%
仲裁
33
27%
/
45%
逾期
24
3%
空闲
发布者: 1 代码
7
等级
项目
179
25%
仲裁
24
17%
/
75%
逾期
16
9%
空闲
8
等级
项目
0
0%
仲裁
0
逾期
0
空闲
9
等级
项目
129
25%
仲裁
24
29%
/
54%
逾期
8
6%
空闲
10
等级
项目
91
13%
仲裁
34
26%
/
59%
逾期
37
41%
空闲
11
等级
项目
27
7%
仲裁
9
33%
/
33%
逾期
1
4%
工作中
12
等级
项目
102
23%
仲裁
12
25%
/
17%
逾期
13
13%
空闲
13
等级
项目
29
34%
仲裁
4
50%
/
25%
逾期
5
17%
工作中
14
等级
项目
478
40%
仲裁
105
40%
/
24%
逾期
82
17%
已载入
发布者: 2 代码
15
等级
项目
11
55%
仲裁
0
逾期
0
空闲
16
等级
项目
84
64%
仲裁
5
100%
/
0%
逾期
9
11%
空闲
17
等级
项目
1
0%
仲裁
5
0%
/
100%
逾期
0
空闲
18
等级
项目
711
33%
仲裁
45
49%
/
42%
逾期
14
2%
工作中
19
等级
项目
0
0%
仲裁
0
逾期
0
空闲
20
等级
项目
5
0%
仲裁
0
逾期
0
空闲
21
等级
项目
0
0%
仲裁
0
逾期
0
空闲
22
等级
项目
15
47%
仲裁
1
100%
/
0%
逾期
3
20%
工作中
项目信息
预算
30 - 50 USD
截止日期
从 0 到 100 天