 Alle Aufträge
 Regeln
Wie man einen Handelsroboter schnell bestellen kann
Lesen Sie bitte zuerst die Regeln durch
Wie man einen Handelsroboter in MQL5 und MQL4 in Auftrag gibt
Hier ist das Muster einer Anforderungsspezifikation, um einen Roboter zu bestellen
Neuer Aufträge in dieser Kategorie:
Spezifikation
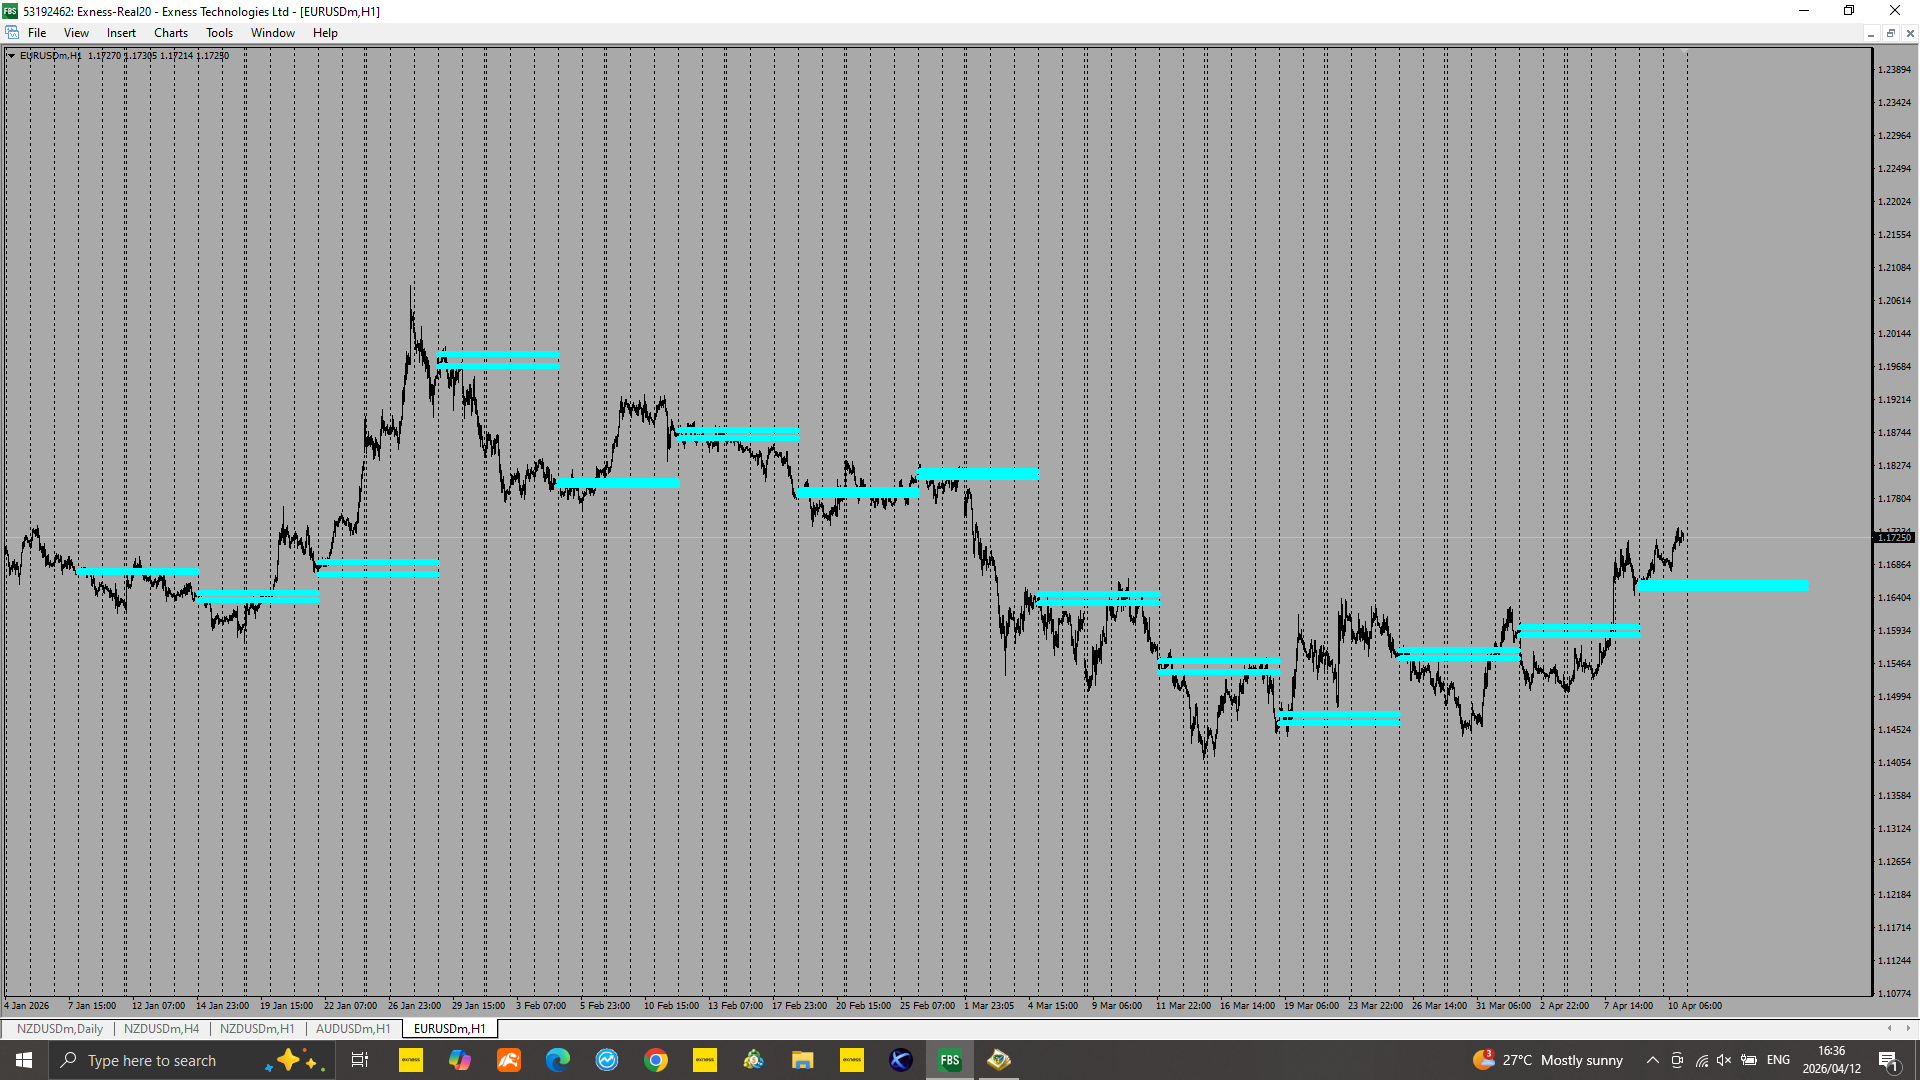
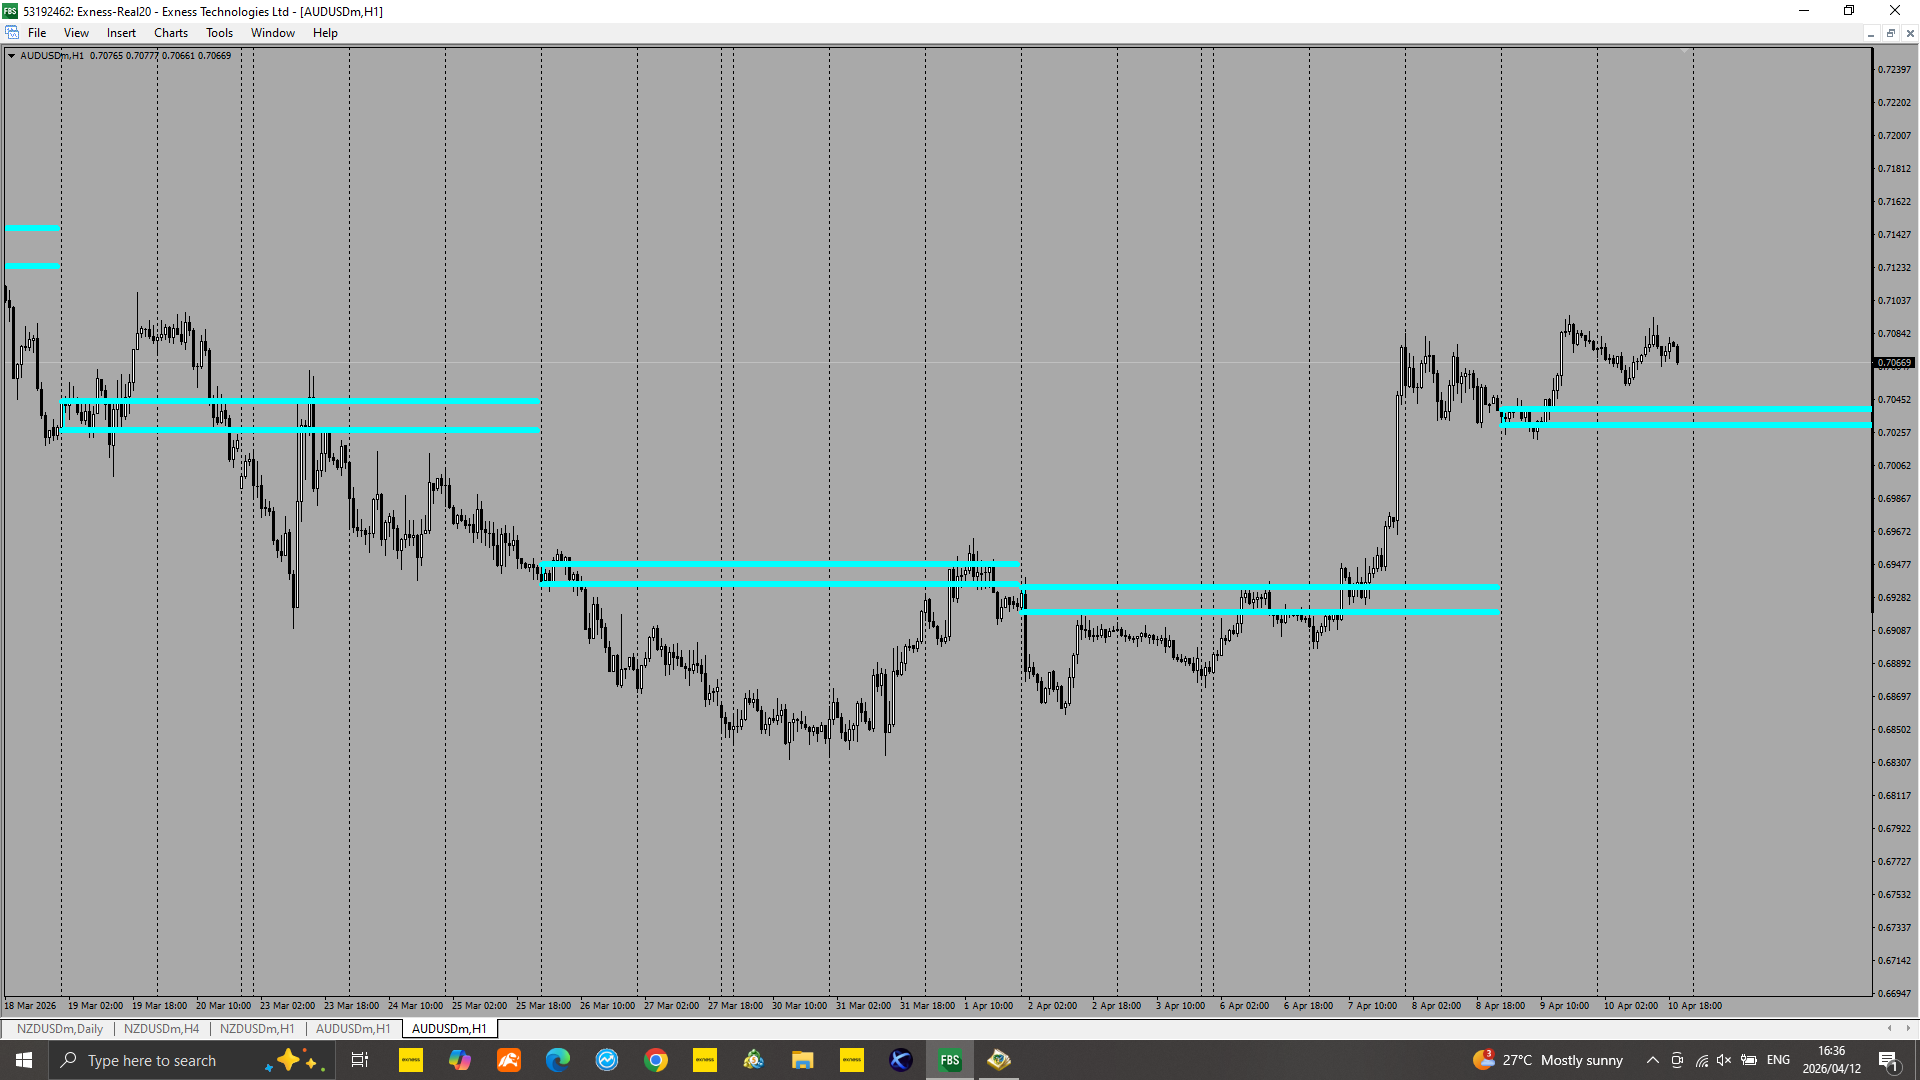
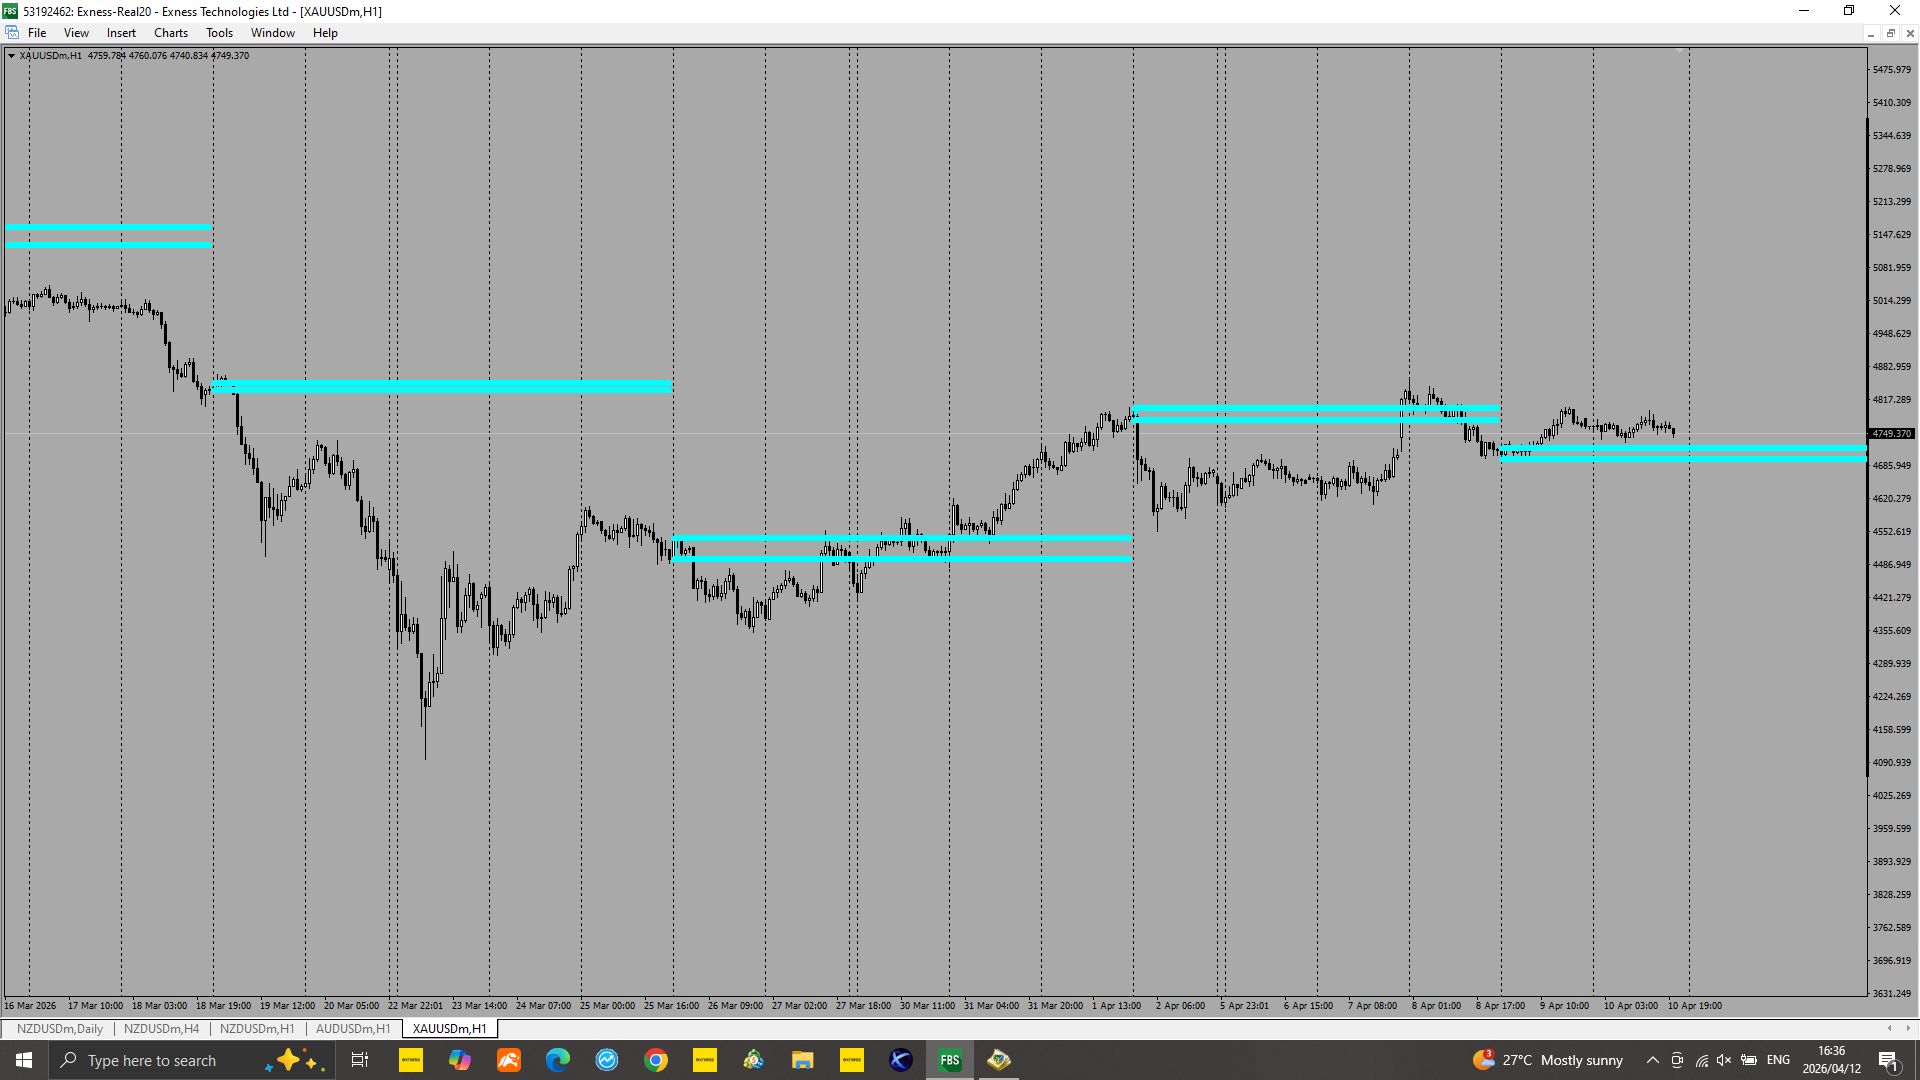
I would like to request a programmer to help me with the programming of a dashboard. The indicator I have attached is an indicator that draws two horizontal lines on the high and low of the first hour candle of the day of every Thursday of the week. The two lines stretches through to Wednesday next week. From there, the dashboard must show above(Blue) if price is above the high/(upper horizontal line) of first hour candle of the Thursday, and the dashboard must also show below(Red) if price is below the low/(lower horizontal line) of the first hour candle. If it happens that price is trapped in between the two horizontal lines I want the dashboard to show neutral(Black). I want to be able add and delete all the symbols I want to see on the dashboard. The timeframe for this indicator is the 1 hour time frame ONLY. LET'S CHAT

Bewerbungen
1
Bewertung
Projekte
709
42%
Schlichtung
2
100%
/
0%
Frist nicht eingehalten
1
0%
Frei
Veröffentlicht: 9 Beispiele
2
Bewertung
Projekte
1
0%
Schlichtung
0
Frist nicht eingehalten
0
Frei
3
Bewertung
Projekte
62
55%
Schlichtung
7
86%
/
0%
Frist nicht eingehalten
2
3%
Frei
4
Bewertung
Projekte
603
34%
Schlichtung
65
22%
/
57%
Frist nicht eingehalten
146
24%
Arbeitet
Veröffentlicht: 1 Artikel, 22 Beispiele
5
Bewertung
Projekte
12
0%
Schlichtung
3
33%
/
33%
Frist nicht eingehalten
0
Frei
6
Bewertung
Projekte
861
61%
Schlichtung
33
27%
/
45%
Frist nicht eingehalten
24
3%
Frei
Veröffentlicht: 1 Beispiel
7
Bewertung
Projekte
184
25%
Schlichtung
25
16%
/
76%
Frist nicht eingehalten
16
9%
Frei
8
Bewertung
Projekte
0
0%
Schlichtung
0
Frist nicht eingehalten
0
Frei
9
Bewertung
Projekte
129
25%
Schlichtung
25
28%
/
56%
Frist nicht eingehalten
8
6%
Frei
10
Bewertung
Projekte
91
13%
Schlichtung
34
26%
/
59%
Frist nicht eingehalten
37
41%
Frei
11
Bewertung
Projekte
28
7%
Schlichtung
9
33%
/
33%
Frist nicht eingehalten
1
4%
Arbeitet
12
Bewertung
Projekte
102
23%
Schlichtung
12
25%
/
17%
Frist nicht eingehalten
13
13%
Frei
13
Bewertung
Projekte
32
38%
Schlichtung
4
50%
/
25%
Frist nicht eingehalten
5
16%
Arbeitet
14
Bewertung
Projekte
478
40%
Schlichtung
105
40%
/
24%
Frist nicht eingehalten
82
17%
Beschäftigt
Veröffentlicht: 2 Beispiele
15
Bewertung
Projekte
14
64%
Schlichtung
0
Frist nicht eingehalten
0
Frei
16
Bewertung
Projekte
84
64%
Schlichtung
5
100%
/
0%
Frist nicht eingehalten
9
11%
Frei
17
Bewertung
Projekte
1
0%
Schlichtung
5
0%
/
100%
Frist nicht eingehalten
0
Frei
18
Bewertung
Projekte
747
34%
Schlichtung
49
53%
/
39%
Frist nicht eingehalten
14
2%
Arbeitet
19
Bewertung
Projekte
0
0%
Schlichtung
0
Frist nicht eingehalten
0
Frei
20
Bewertung
Projekte
5
0%
Schlichtung
0
Frist nicht eingehalten
0
Frei
21
Bewertung
Projekte
0
0%
Schlichtung
0
Frist nicht eingehalten
0
Frei
22
Bewertung
Projekte
16
50%
Schlichtung
1
100%
/
0%
Frist nicht eingehalten
4
25%
Frei
Projektdetails
Budget
30 - 50 USD
Ausführungsfristen
von 0 bis 100 Tag(e)