スピーディに自動売買ロボットを注文する方法を見る
注文を投稿するまたは受注する前にルールをご覧ください。
MQL5およびMQL4で自動売買ロボットを注文する方法
ロボットを注文するにはサンプル要件仕様をご覧ください
カテゴリでの新規注文:
仕事が完了した
実行時間5 日
依頼者からのフィードバック
Rapido y Eficiente
開発者からのフィードバック
Excelente Cliente, buen trato
指定
I would like to request the development of an indicator that marks the highs and lows that have not been tested, and those that have already been touched that there ends the line here I draw with rectangles the idea of the indicator that I request.
The indicator must have the following customizable parameters
Max Bars : 2000 or you can write a custom value.
Freezing High and Lows : True-False
this function should do the following
If it is activated, it should mark the highs and lows of the time frame in which it is, and freeze them, so that when going down to another time frame the lines will be marked.
Example
I open the chart and activate the indicator in h4 the are marked, the option is in true, and I change to a time frame of 15 minutes the highs and lows that appear are those of h4, if the option is in false, the indicator must mark the highs and lows according to the temporality in which it is found.
Color High : Red
Color Low : Blue
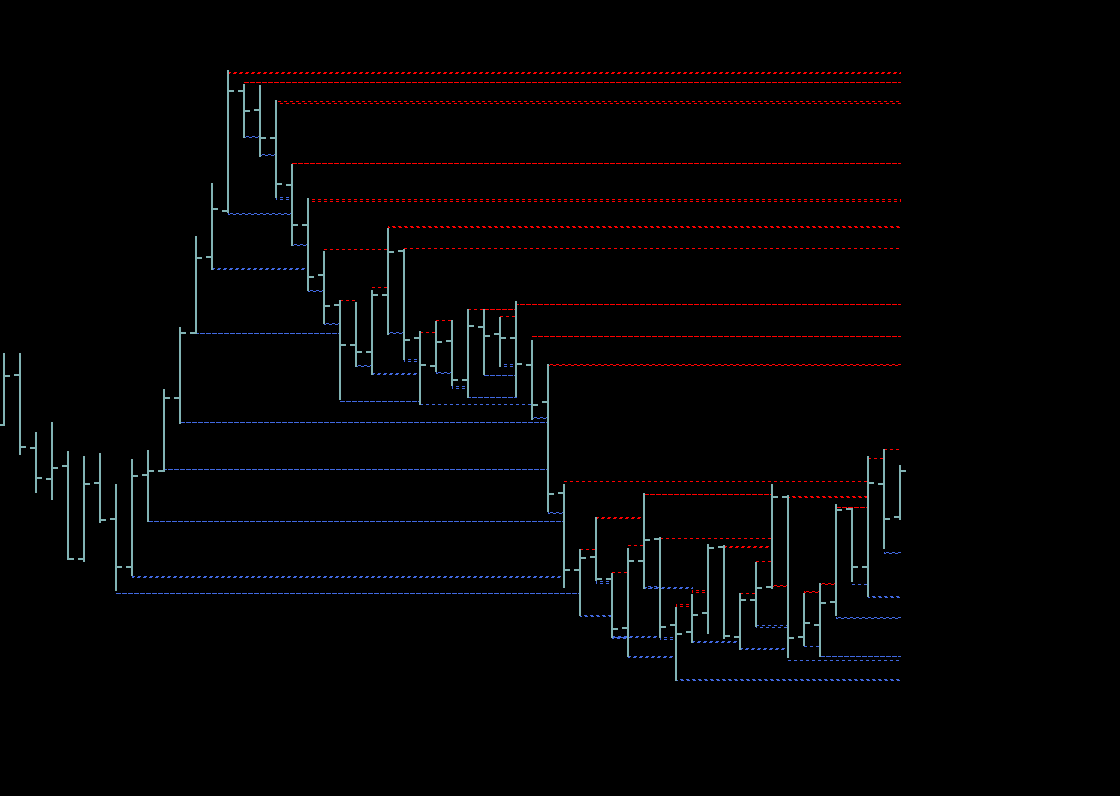
I clarify the line stops drawing when the current bar touches it if not the line should continue to be drawn to get an idea I attach an indicator that does something similar but with fractals
応答済み
1
評価
プロジェクト
317
24%
仲裁
23
35%
/
13%
期限切れ
23
7%
暇
パブリッシュした人: 3 codes
プロジェクト情報
予算
30 - 50 USD
締め切り
最低 3 最高 5 日