트레이딩 로봇 주문 방법을 보십시오
주문을 실행하거나 포스트하기 전에 규칙을 읽으십시오
MQL5 및 MQL 4의 트레이딩 로봇을 주문하는 방법
로봇을 주문하기 위해샘플 요구 사항을 보십시오
카테고리의 새로운 주문:
30 - 50 USD
작업 종료됨
실행 시간 5 일
고객의 피드백
Rapido y Eficiente
피고용인의 피드백
Excelente Cliente, buen trato
명시
I would like to request the development of an indicator that marks the highs and lows that have not been tested, and those that have already been touched that there ends the line here I draw with rectangles the idea of the indicator that I request.
The indicator must have the following customizable parameters
Max Bars : 2000 or you can write a custom value.
Freezing High and Lows : True-False
this function should do the following
If it is activated, it should mark the highs and lows of the time frame in which it is, and freeze them, so that when going down to another time frame the lines will be marked.
Example
I open the chart and activate the indicator in h4 the are marked, the option is in true, and I change to a time frame of 15 minutes the highs and lows that appear are those of h4, if the option is in false, the indicator must mark the highs and lows according to the temporality in which it is found.
Color High : Red
Color Low : Blue
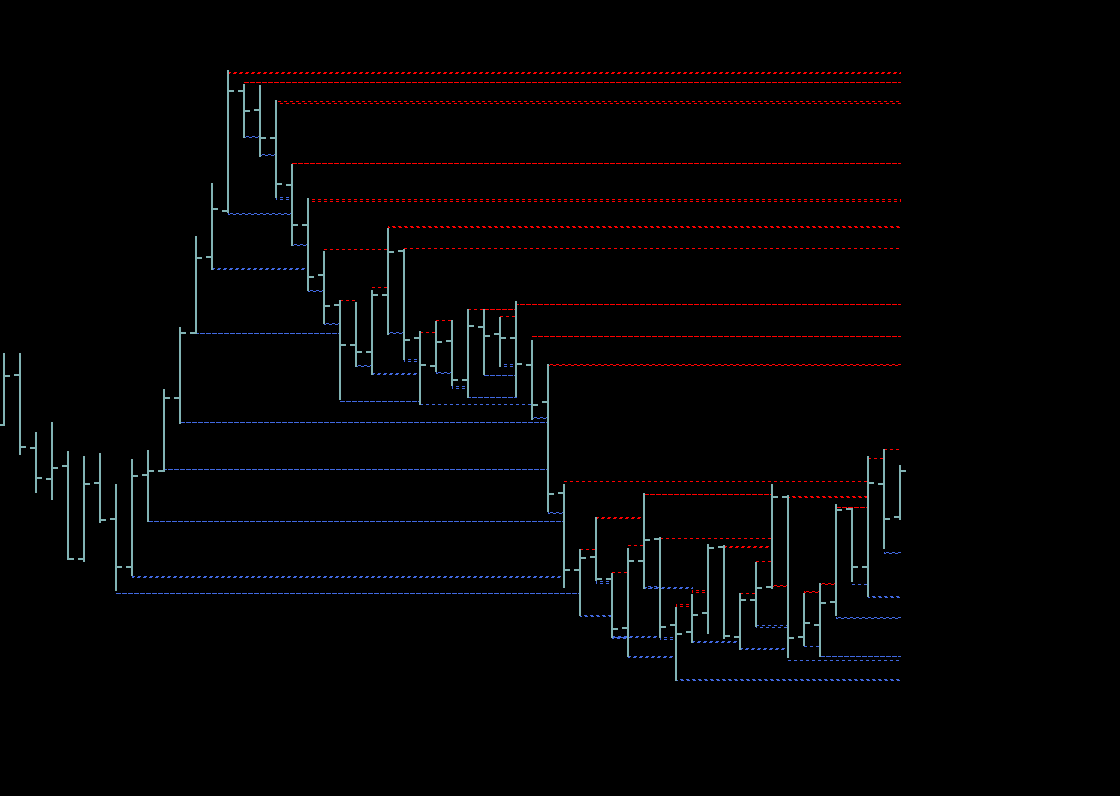
I clarify the line stops drawing when the current bar touches it if not the line should continue to be drawn to get an idea I attach an indicator that does something similar but with fractals
응답함
1
등급
프로젝트
317
24%
중재
23
35%
/
13%
기한 초과
23
7%
무료
게재됨: 3 코드
프로젝트 정보
예산
30 - 50 USD
기한
에서 3 로 5 일