类别中的新订单:
30 - 50 USD
工作已完成
执行时间5 天
客户反馈
Rapido y Eficiente
员工反馈
Excelente Cliente, buen trato
指定
I would like to request the development of an indicator that marks the highs and lows that have not been tested, and those that have already been touched that there ends the line here I draw with rectangles the idea of the indicator that I request.
The indicator must have the following customizable parameters
Max Bars : 2000 or you can write a custom value.
Freezing High and Lows : True-False
this function should do the following
If it is activated, it should mark the highs and lows of the time frame in which it is, and freeze them, so that when going down to another time frame the lines will be marked.
Example
I open the chart and activate the indicator in h4 the are marked, the option is in true, and I change to a time frame of 15 minutes the highs and lows that appear are those of h4, if the option is in false, the indicator must mark the highs and lows according to the temporality in which it is found.
Color High : Red
Color Low : Blue
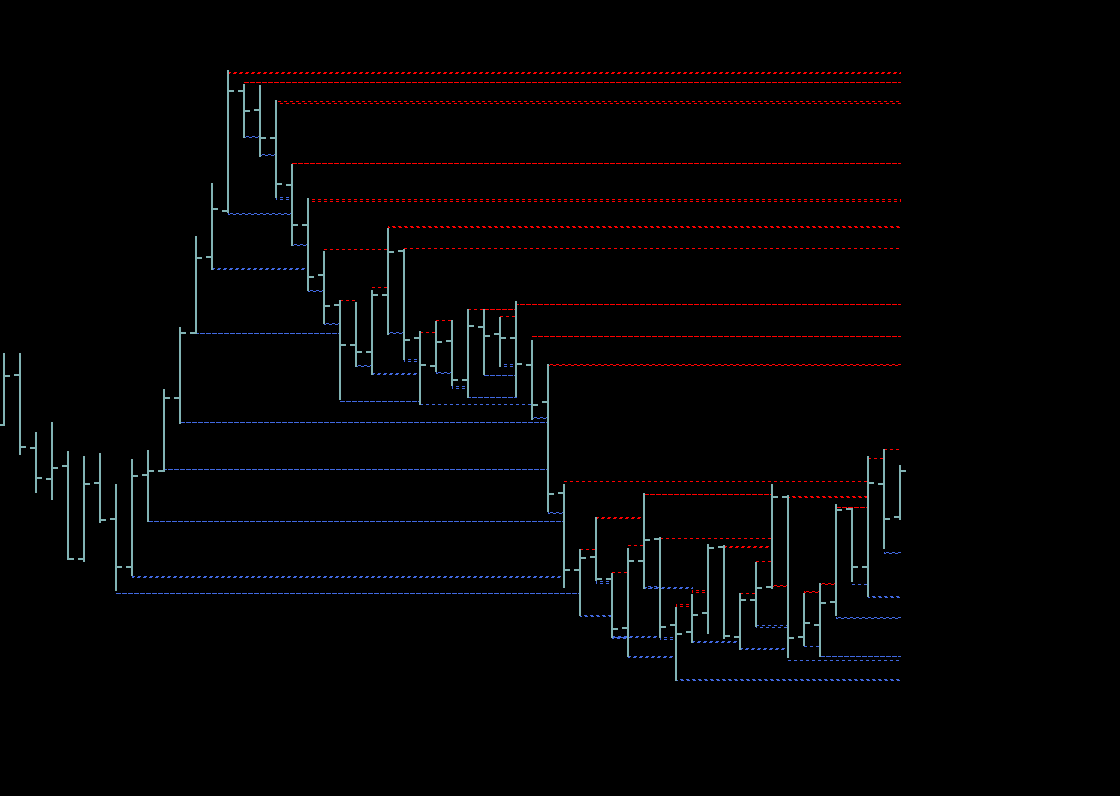
I clarify the line stops drawing when the current bar touches it if not the line should continue to be drawn to get an idea I attach an indicator that does something similar but with fractals
反馈
1
等级
项目
317
24%
仲裁
23
35%
/
13%
逾期
23
7%
空闲
发布者: 3 代码
相似订单
CRIPTORy
1000 - 50000 USD
Necesito un programador muy avanzado en tema de crypto, debe conocer muy bien el tema de cryptografia y blockchain, debe tener capacidades diferentes a fuerza bruta para realizar este trabajo y conocer a fondo la wallet de bitcoin core
项目信息
预算
30 - 50 USD
截止日期
从 3 到 5 天