スピーディに自動売買ロボットを注文する方法を見る
注文を投稿するまたは受注する前にルールをご覧ください。
MQL5およびMQL4で自動売買ロボットを注文する方法
ロボットを注文するにはサンプル要件仕様をご覧ください
カテゴリでの新規注文:
30+ USD
30+ USD
50 - 400 USD
30+ USD
30 - 100 USD
100 - 300 USD
指定
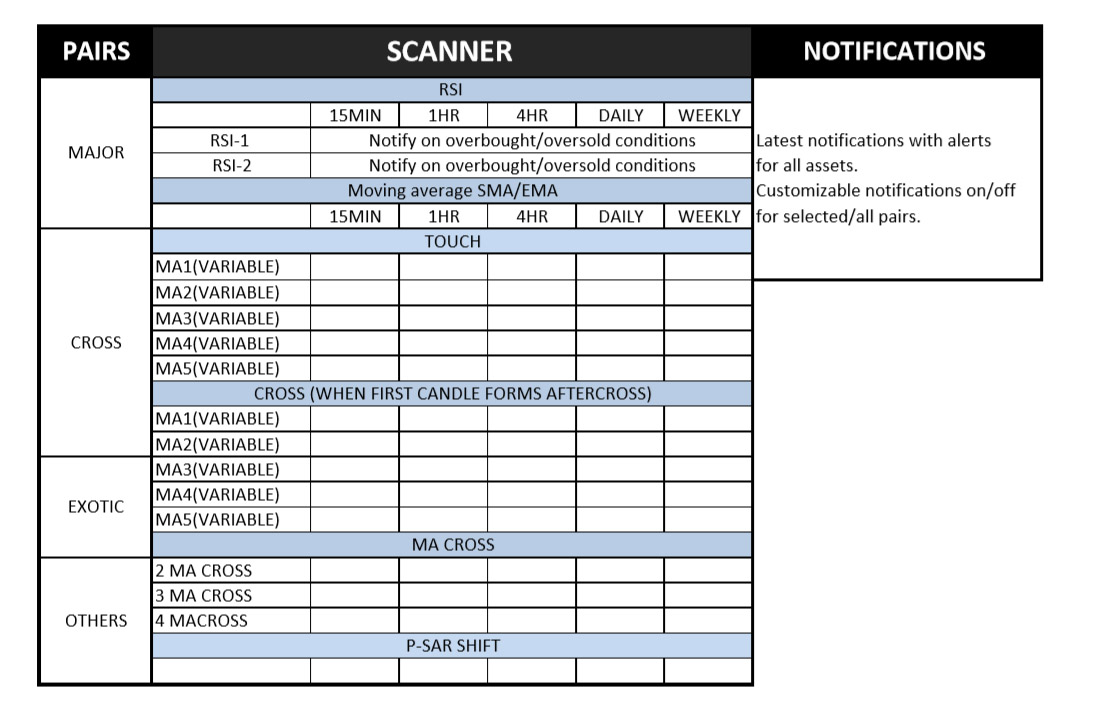
DESCRIPTION
Primarily a scanner, scanning price values with respect to Moving averages/RSI/P-SAR for different
time frames and for different pairs, that can give notifications and alerts under predefined conditions.
The way I see it as:
A tab showing,
PAIRS - that you can select which pairs you want to be active in scanning.(MAJOR/CROSS/EXOTIC/OTHERS)
SCANNER – scanning price values as per MA/RSI/P-SAR on different time frames.
(15MIN/1HR/4HR/DAILY/WEEKLY) - ADJUSTABLE
MOVING AVERAGE SCANNER
MA- Customizable to 5 different values MA1,MA2,MA3,MA4,MA5 with option of selection of type of
MA. SMA/EMA/WMA. . . .with all its in built variables.
The MA Scanner will scan values with respect to 3 criteria.
1.When the value touches the MA.
Showing Red downward arrow when price going down, & green upward arrow when price going up.
2.On formation of first candle completely above or below after the crossing of the moving average.
Showing Red downward arrow when price going down, & green upward arrow when price going up.
3.Oncrossing of MA under 3 conditions A) 2 MA CROSS B) 3MACROSS C) 4MACROSS
Showing Red downward arrow when price going down, & green upward arrow when price going up.
RSI SCANNER
Scanning RSI values for 2 conditions again both values customizable to its in built variables.
Showing over bought conditions with green upward arrows and over sold conditions with red
downward arrow.
P-SAR SCANNER
Showing the shift with the arrow in the opposite direction. Eg. Showing a red downward arrow
indicating a trend shift about to take place from bullish to bearish.
Note:
The tab shows notification for 15 min duration on 15 min time frame/1 hr duration on 1HR
time frame and so on.
The scanner has the option of opening a chart by right click on the indicator when the indicator becomes active.
eg. 1.A 15 min indicator for EUR/USD chowing RSI over bought value allows to opens a 15 min chart for EUR/USD with the RSI indicator below.
2.For MA CROSS of two moving average indication of 1HR time frame allows a 1HR chart with the moving averages shown in the chart.
NOTIFICATIONS & ALERT
Showing latest indication for the active pairs for scanning via alerts/notifications via
telegram/email/SMS. The option of having to switch ON/OFF.
応答済み
1
評価
プロジェクト
246
45%
仲裁
42
10%
/
57%
期限切れ
5
2%
暇
2
評価
プロジェクト
125
23%
仲裁
12
0%
/
75%
期限切れ
22
18%
暇
3
評価
プロジェクト
4
50%
仲裁
1
100%
/
0%
期限切れ
2
50%
暇
4
評価
プロジェクト
423
38%
仲裁
86
44%
/
19%
期限切れ
70
17%
多忙
5
評価
プロジェクト
320
35%
仲裁
64
13%
/
56%
期限切れ
83
26%
暇
6
評価
プロジェクト
395
28%
仲裁
69
19%
/
49%
期限切れ
120
30%
暇
7
評価
プロジェクト
24
33%
仲裁
5
20%
/
40%
期限切れ
8
33%
暇
8
評価
プロジェクト
2820
80%
仲裁
156
22%
/
43%
期限切れ
488
17%
暇
9
評価
プロジェクト
3
33%
仲裁
1
0%
/
100%
期限切れ
0
暇
10
評価
プロジェクト
167
35%
仲裁
11
91%
/
0%
期限切れ
0
暇
11
評価
プロジェクト
143
34%
仲裁
10
10%
/
60%
期限切れ
26
18%
暇
12
評価
プロジェクト
76
33%
仲裁
9
78%
/
11%
期限切れ
7
9%
暇
13
評価
プロジェクト
134
27%
仲裁
62
13%
/
53%
期限切れ
58
43%
暇
類似した注文
Project Description : I need an experienced programmer to convert the TradingView indicator "TTD Middle Right Normal" into a MetaTrader 5 (MT5) format. The indicator should function identically to the original and be fully compatible for integration into an Expert Advisor (EA) on MT5. Requirements : Convert "TTD Middle Right Normal" from TradingView to a .mq5 file for MT5. Ensure all indicator features and visual
I want to create an indi to push notification when the candlestick chart forms 3 peaks or 3 bottoms forming a straight line: - 1,2,3 are 3 points in a straight line or NEARLY straight For example: Straight: NEARLY straight : means the peak/bottom of candle number 3 is NEAR the straight line connecting 1 and 2. Candle number 3 may or may not have crossed the straight line, as long as the peak/bottom of candle number 3
Hello! I am looking for an experienced Pine Script coder to create a custom indicator for mapping market structure based on fractals. The developer needs to know a lot about coding market structure indicators and be proficient in Pine Script. excited to collaborate with a gifted developer
I have list of free indicators in tradingview and i would like to convert them into an mt4 ea, But the EA will have and work based on the indicators features The list of the are listed as follows :> 1. Market Structure Break And Order block. By EmreKb 2. Rainbow Adaptive RSI by LuxAlgo 3. Multiple MA (21,50,100) 4. SuperTrend My budget for this 80$ max
Code mt4 ea with tradingview indicators sript
50 - 60 USD
I have list of free indicators in tradingview and i would like to convert them into an mt4 ea, But the EA will have and work based on the indicators features The list of the are listed as follows :> 1. Market Structure Break And Order block. By EmreKb 2. Rainbow Adaptive RSI by LuxAlgo 3. Multiple MA (21,50,100) 4. SuperTrend Please don't apply if can't do this, So we won't ourselves time
Source code for indicator
30+ USD
good day i have an indicator but need the source for this reason The indicator only work on a single Time frame open trade, and close with only a single TF i will like the indicator work on multiple time frame just like other installed indicator My coder said the reason it cannot work like other indicator installed is because it has no buffer First confirm if you have the source code because its a popular indicator
Hello! I am looking for an experienced Pine Script coder to create a custom indicator for mapping market structure based on fractals. The developer must be skilled in Pine Script and have a solid understanding of how to code market structure indicators. Looking forward to working with a talented developer
Hello developers, I would like to hire someone can convert the Radar Signal indicator: https://www.youtube.com/watch?v=5DmKcy7rb-U  ; to it's TradingView equivalent. Radar signal indicator is the combination of 7 classic MT4 indicators. They include ADX, RSI , CCI , OsMA, ATR, WPR. The indicator shows the values of these indicators in blue and red. Red color indicates a bearish market condition and the blue shows
Hi , i want a indicator that shows the trades history on the chart, just for current day, like : first trade : -54 Second trade : -52 Third trade : +126 , and after three trades, display "No more trades"
AngelShark system
30+ USD
Hello i need someone who can convert a trading view indicator into an mt5 indicator that can work smoothly also need to add an alert on the indicator i will require to test the indicator run it for 1-2days to confirm all is okay thank you
プロジェクト情報
予算
150 - 200 USD
開発者用
135
- 180
USD