Watch how to order a trading robot
Read the Rules before you post an order or execute it
How to Order a Trading Robot in MQL5 and MQL4
See a sample Requirements Specification to order a robot
New orders in the category:
30 - 40 USD
50 - 100 USD
30 - 40 USD
40 - 80 USD
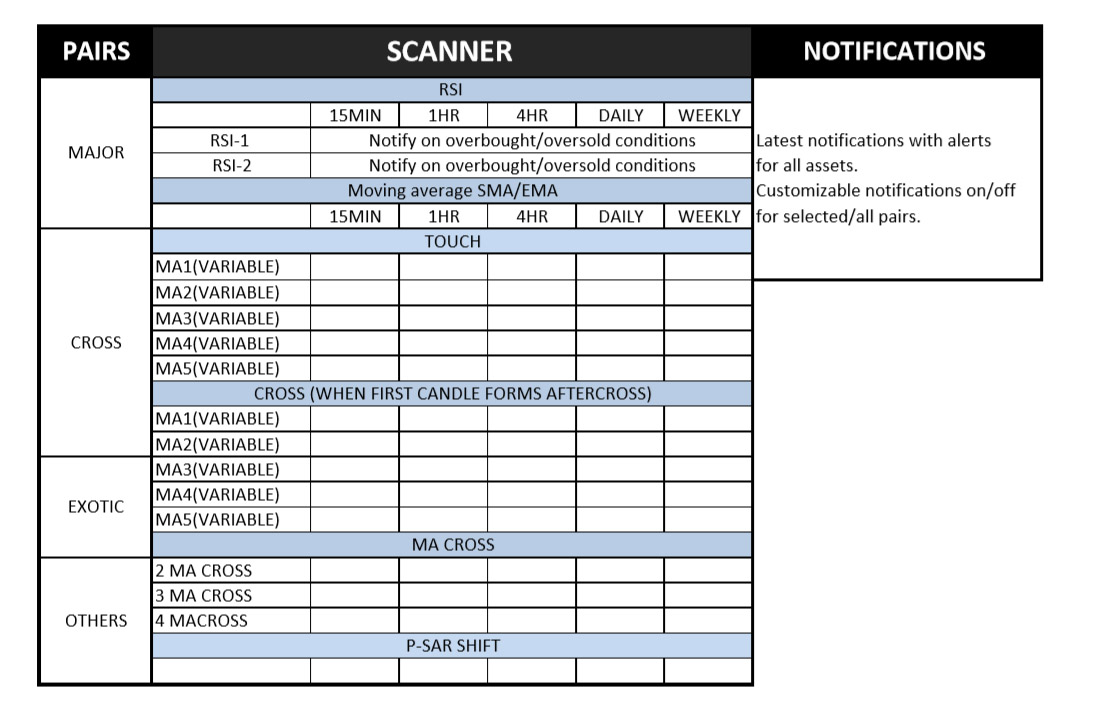
Specification
DESCRIPTION
Primarily a scanner, scanning price values with respect to Moving averages/RSI/P-SAR for different
time frames and for different pairs, that can give notifications and alerts under predefined conditions.
The way I see it as:
A tab showing,
PAIRS - that you can select which pairs you want to be active in scanning.(MAJOR/CROSS/EXOTIC/OTHERS)
SCANNER – scanning price values as per MA/RSI/P-SAR on different time frames.
(15MIN/1HR/4HR/DAILY/WEEKLY) - ADJUSTABLE
MOVING AVERAGE SCANNER
MA- Customizable to 5 different values MA1,MA2,MA3,MA4,MA5 with option of selection of type of
MA. SMA/EMA/WMA. . . .with all its in built variables.
The MA Scanner will scan values with respect to 3 criteria.
1.When the value touches the MA.
Showing Red downward arrow when price going down, & green upward arrow when price going up.
2.On formation of first candle completely above or below after the crossing of the moving average.
Showing Red downward arrow when price going down, & green upward arrow when price going up.
3.Oncrossing of MA under 3 conditions A) 2 MA CROSS B) 3MACROSS C) 4MACROSS
Showing Red downward arrow when price going down, & green upward arrow when price going up.
RSI SCANNER
Scanning RSI values for 2 conditions again both values customizable to its in built variables.
Showing over bought conditions with green upward arrows and over sold conditions with red
downward arrow.
P-SAR SCANNER
Showing the shift with the arrow in the opposite direction. Eg. Showing a red downward arrow
indicating a trend shift about to take place from bullish to bearish.
Note:
The tab shows notification for 15 min duration on 15 min time frame/1 hr duration on 1HR
time frame and so on.
The scanner has the option of opening a chart by right click on the indicator when the indicator becomes active.
eg. 1.A 15 min indicator for EUR/USD chowing RSI over bought value allows to opens a 15 min chart for EUR/USD with the RSI indicator below.
2.For MA CROSS of two moving average indication of 1HR time frame allows a 1HR chart with the moving averages shown in the chart.
NOTIFICATIONS & ALERT
Showing latest indication for the active pairs for scanning via alerts/notifications via
telegram/email/SMS. The option of having to switch ON/OFF.
Responded
1
Rating
Projects
246
45%
Arbitration
42
10%
/
57%
Overdue
5
2%
Free
2
Rating
Projects
125
23%
Arbitration
12
0%
/
67%
Overdue
22
18%
Working
3
Rating
Projects
4
50%
Arbitration
1
100%
/
0%
Overdue
2
50%
Free
4
Rating
Projects
398
38%
Arbitration
82
41%
/
20%
Overdue
69
17%
Loaded
5
Rating
Projects
317
35%
Arbitration
64
13%
/
56%
Overdue
82
26%
Free
6
Rating
Projects
395
28%
Arbitration
69
19%
/
49%
Overdue
120
30%
Free
7
Rating
Projects
24
33%
Arbitration
5
20%
/
40%
Overdue
8
33%
Free
8
Rating
Projects
2820
80%
Arbitration
156
22%
/
43%
Overdue
489
17%
Free
9
Rating
Projects
3
33%
Arbitration
1
0%
/
100%
Overdue
0
Free
10
Rating
Projects
167
35%
Arbitration
11
91%
/
0%
Overdue
0
Free
11
Rating
Projects
143
34%
Arbitration
10
10%
/
60%
Overdue
26
18%
Working
12
Rating
Projects
76
33%
Arbitration
9
78%
/
11%
Overdue
7
9%
Free
13
Rating
Projects
134
27%
Arbitration
62
13%
/
53%
Overdue
58
43%
Free
Similar orders
Simple Ninjatrader bot
30 - 70 USD
the idea of the bot is to trade based on trend. we are going to use 5 different sma( smoothed moving average). they are sma7,sma20, sma50, sma100 and sma200. the bot will look for only buy trades when all the smas are facing up. the bot will look for only sell trades when all the smas are facing down. when we are in a up trend, the bot will look to enter trades on bullish candles that create fvg. if there is an fvg
Hello there, all i need is to make an RSI indicator to give alerts when it reaches a certain levels, Level 99.9,98, 4 and 0.1. Kindly bid to this post now if this what you can complete
Accurate Boom and Crash Spike DETECTOR
30 - 100 USD
I need Spike DETECTOR EA for Boom and Crash.. which will send me notification or alerts when spike is near. The EA should also be able be buy on crash Index and sell on Boom Index depending on the market..Demo may be provided for faster execution of my order
Hello , I want Machine Learning: Lorentzian Classification (TradingView) indicator to MQL5 indicator.Which is machine learning indicator . Same To Same. And same inputs in it. I want it As soon As possible
ODSMART EA
30 USD
I want an EA developed from this strategy that will buy and sell based on the appearance of these colours. Blue-buy (Enter when the signal indicator is at zero on the blue background) Red -sell( Enter when the signal indicator is at 100) White and brown, exit trade
Crpyto Indicators
75 - 100 USD
2 Indicators: One for BTC/USD and one for ETH/USD Create indicators which plot the MVRV of Bitcoin and Ethereum as a line, standardized by a Z Score Essentially Zscore = ( MC - MCRealized ) / STD ( MC(number of bars ) Indicators should work on the daily timeframe at a minimum, and smaller ones if possible. Indicators should be able to work with future data as well, meaning it can download what's necessary to then
Converting tradingview to nt8
30+ USD
Hi there Here is a video of the logic: its based on market structure and swings using validated highs and lows based on candle closure. Just in case you would like to take a look at the code/indicator here is the link: https://youtu.be/igj0OaQoM7o?si=7nigL8OU2Nt1Zxkx Let me know if you can help
I am looking for a professional developer to help me with creating a hedge grid bot. The concept is in the picture. The bot is quite simple. The bot basically opens buy and sell positions on each grid and self terminates when the upper limit (manually set is reached) 1. Set timer for new's releases (manual entry) 2. Slippage in pip's (manual entry) 3. Maximum drawdown in USD with self termination when entry
Alerts for triangles & channels
30+ USD
I need alerts for 2 kinds of triangles (contracting & expanding) and 2 kinds of channels (up & dn) before that you should be able to put trendlines to any buffered (usually 0 & 1) zigzag indicators the method of drawing trendline is different i can show them with the pictures
Nt8
30+ USD
I trade in NT8 and would like to code an Elliott wave measurment tool, which is very easy because I have the major Script for that.We need only to add some aspects into it. If you are interested,if you can do this do well to bid on it
Project information
Budget
150 - 200 USD
For the developer
135
- 180
USD