Multi time frame scanner with respect to RSI/MA/P-SAR

Техническое задание

DESCRIPTION
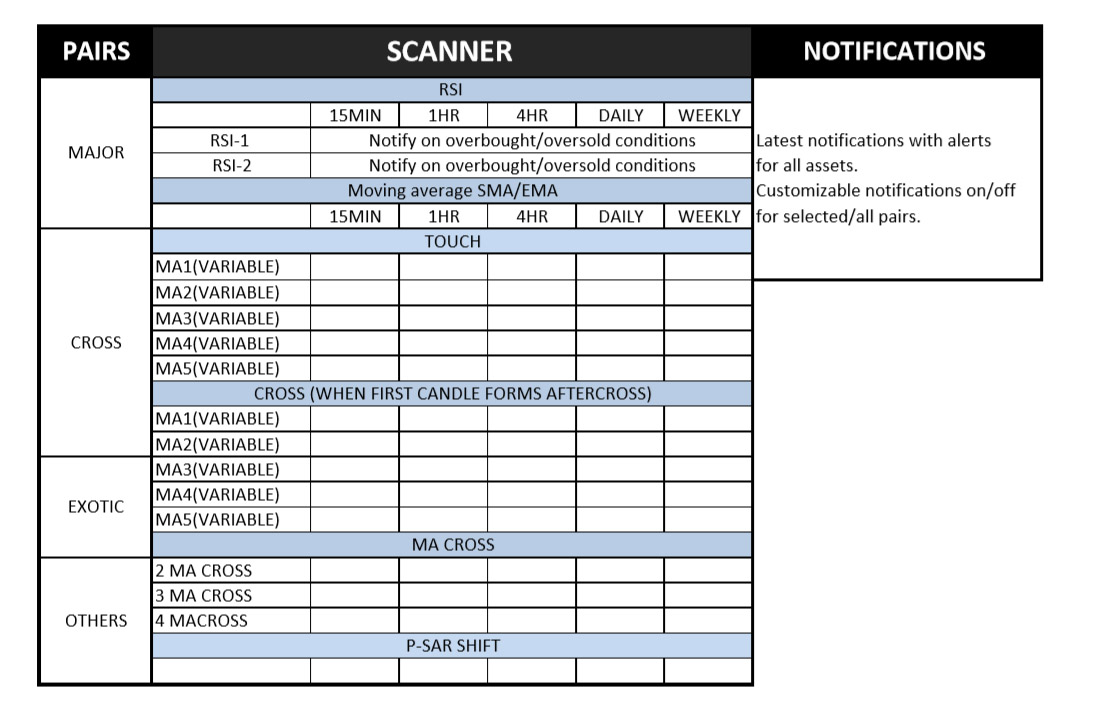
Primarily a scanner, scanning price values with respect to Moving averages/RSI/P-SAR for different
time frames and for different pairs, that can give notifications and alerts under predefined conditions.


The way I see it as:

A tab showing,


PAIRS - that you can select which pairs you want to be active in scanning.(MAJOR/CROSS/EXOTIC/OTHERS)


SCANNER – scanning price values as per MA/RSI/P-SAR on different time frames.

(15MIN/1HR/4HR/DAILY/WEEKLY) - ADJUSTABLE

MOVING AVERAGE SCANNER

MA- Customizable to 5 different values MA1,MA2,MA3,MA4,MA5 with option of selection of type of
MA. SMA/EMA/WMA. . . .with all its in built variables.
The MA Scanner will scan values with respect to 3 criteria.
1.When the value touches the MA.
Showing Red downward arrow when price going down, & green upward arrow when price going up.

2.On formation of first candle completely above or below after the crossing of the moving average.
Showing Red downward arrow when price going down, & green upward arrow when price going up.

3.Oncrossing of MA under 3 conditions A) 2 MA CROSS B) 3MACROSS C) 4MACROSS
Showing Red downward arrow when price going down, & green upward arrow when price going up.

RSI SCANNER
Scanning RSI values for 2 conditions again both values customizable to its in built variables.
Showing over bought conditions with green upward arrows and over sold conditions with red
downward arrow.

P-SAR SCANNER
Showing the shift with the arrow in the opposite direction. Eg. Showing a red downward arrow
indicating a trend shift about to take place from bullish to bearish.

Note:

The tab shows notification for 15 min duration on 15 min time frame/1 hr duration on 1HR

time frame and so on.

The scanner has the option of opening a chart by right click on the indicator when the indicator becomes active.

eg. 1.A 15 min indicator for EUR/USD chowing RSI over bought value allows to opens a 15 min chart for EUR/USD with the RSI indicator below.

     2.For MA CROSS of two moving average indication of 1HR time frame allows a 1HR chart with the moving averages shown in the chart.


NOTIFICATIONS & ALERT


Showing latest indication for the active pairs for scanning via alerts/notifications via
telegram/email/SMS. The option of having to switch ON/OFF.


Файлы:

JPG
scanner.jpg
135.6 Kb

Откликнулись

1
Разработчик 1
Оценка
(213)
Проекты
246
45%
Арбитраж
42
10% / 57%
Просрочено
5
2%
Свободен
2
Разработчик 2
Оценка
(100)
Проекты
125
23%
Арбитраж
12
0% / 75%
Просрочено
22
18%
Свободен
3
Разработчик 3
Оценка
(3)
Проекты
4
50%
Арбитраж
1
100% / 0%
Просрочено
2
50%
Свободен
4
Разработчик 4
Оценка
(260)
Проекты
422
38%
Арбитраж
86
44% / 19%
Просрочено
70
17%
Занят
5
Разработчик 5
Оценка
(197)
Проекты
320
35%
Арбитраж
64
13% / 56%
Просрочено
83
26%
Свободен
6
Разработчик 6
Оценка
(258)
Проекты
395
28%
Арбитраж
69
19% / 49%
Просрочено
120
30%
Свободен
7
Разработчик 7
Оценка
(17)
Проекты
24
33%
Арбитраж
5
20% / 40%
Просрочено
8
33%
Свободен
8
Разработчик 8
Оценка
(1235)
Проекты
2820
80%
Арбитраж
156
22% / 43%
Просрочено
488
17%
Свободен
9
Разработчик 9
Оценка
(2)
Проекты
3
33%
Арбитраж
1
0% / 100%
Просрочено
0
Свободен
10
Разработчик 10
Оценка
(137)
Проекты
167
35%
Арбитраж
11
91% / 0%
Просрочено
0
Свободен
11
Разработчик 11
Оценка
(66)
Проекты
143
34%
Арбитраж
10
10% / 60%
Просрочено
26
18%
Свободен
12
Разработчик 12
Оценка
(58)
Проекты
76
33%
Арбитраж
9
78% / 11%
Просрочено
7
9%
Свободен
13
Разработчик 13
Оценка
(49)
Проекты
134
27%
Арбитраж
62
13% / 53%
Просрочено
58
43%
Свободен
Похожие заказы
Hello! I am looking for an experienced Pine Script coder to create a custom indicator for mapping market structure based on fractals. The developer must be skilled in Pine Script and have a solid understanding of how to code market structure indicators. Looking forward to working with a talented developer
Hello developers, I would like to hire someone can convert the Radar Signal indicator: https://www.youtube.com/watch?v=5DmKcy7rb-U&nbsp ; to it's TradingView equivalent. Radar signal indicator is the combination of 7 classic MT4 indicators. They include ADX, RSI , CCI , OsMA, ATR, WPR. The indicator shows the values of these indicators in blue and red. Red color indicates a bearish market condition and the blue shows
Hi , i want a indicator that shows the trades history on the chart, just for current day, like : first trade : -54 Second trade : -52 Third trade : +126 , and after three trades, display "No more trades"
Hello i need someone who can convert a trading view indicator into an mt5 indicator that can work smoothly also need to add an alert on the indicator i will require to test the indicator run it for 1-2days to confirm all is okay thank you
Here's a clearer step-by-step guide to checking the last 50 candles on your chart and applying Fibonacci retracement levels based on their colors: Identify Candle Color: Start from the 100th candle from the left on the chart and check its color. If the 100th candle is green (i.e., the close is higher than the open): Draw a Fibonacci Retracement: From the highest price to the lowest price of this candle. Check the
I have an equity reporter. This equity reporter displays the maximum and minimum equity reached over a specific interval. So, if the interval is set to 24 hours, the script will generate data in the format: "Profit ATT" (profit AtThatTime) shows max./min. during the specific interval This specific report shows data in pips. It can also be set to display in price or percentages. The interval is also easily adjustable
I want you to make me an indicator in Training View. Its idea is very simple, and I want it to have an alarm. Here's a clearer step-by-step guide to checking the last 50 candles on your chart and applying Fibonacci retracement levels based on their colors: Identify Candle Color: Start from the 100th candle from the left on the chart and check its color. If the 100th candle is green (i.e., the close is higher than the
Hello, is it possible to be made accommodation of provided signal for Forex for mt4? I bought a signal for multiple pairs. it is executing all pair.I want to use it on couple of pairs.Is it possible to be made some modifications?I do not have codes for the signal
I have an MT4 indicator, I want to receive an alert on WhatsApp when the indicator gives a buy or sell signal, I already have an API that will send the message, just send the json with the content, I will pass the API link when I have the proposal: { "symbol": "xauusd", "cellphonenumber": "00000000", "message": "test" }

Информация о проекте

Бюджет
150 - 200 USD
Исполнителю
135 - 180 USD