I need an indicator that can copy objects from one chart to another chart.
If you have any questions please ask me!
This indicator should have the following functions:
1)
copy all objects (on/off)
save all objects to a csv file (on/off)
data to copy of all onbjects:
price/object type/color/start time/end time/name
backtestmode (on/off) – if this mode is on the indicator should just save the data and not copy it to another chart.
2)
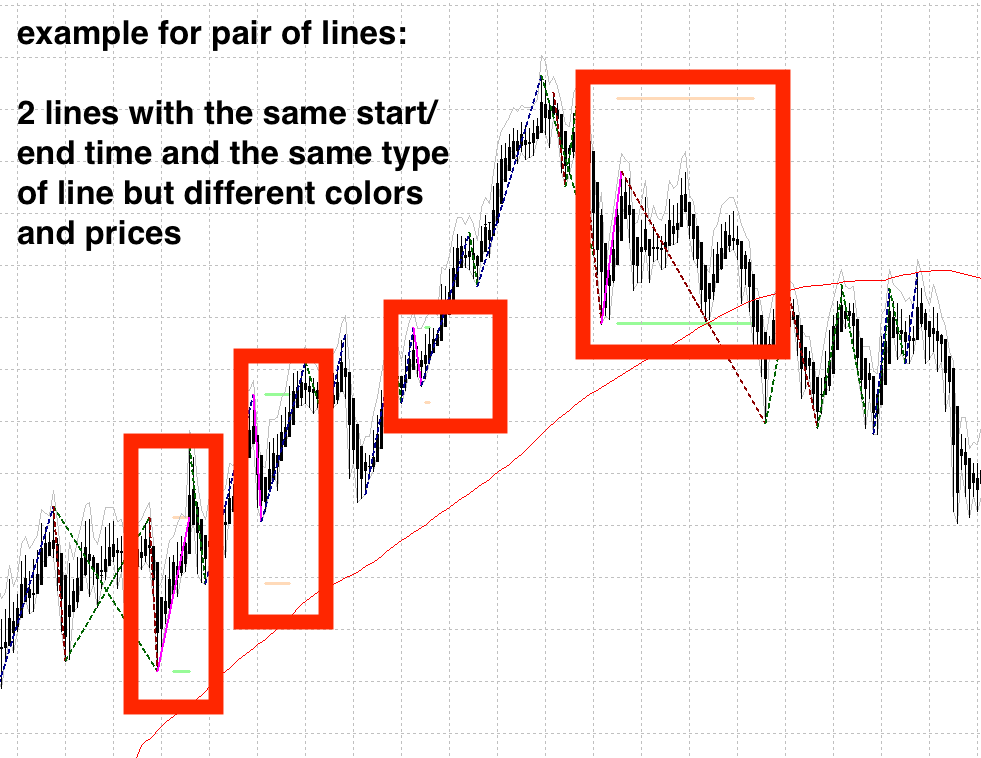
copy just selected pairs of objects (on/off)
objects that have a certain specifiable color (eg green & red) and type (eg line)
save just selected objects (on/off)
save 2 objects with the same start and end
time but with different color in one line
price /start time/end time/color/name/length in number of bars
backtestmode (on/off) – if this mode is on the indicator should just save the data and not copy it to another chart.
save additional information in the same
line such as:
Open/High/Low/Close price at the
beginning of the line
Open/High/Low/Close price at the end of
the line
Highest high and lowest low between start and end of the line (not including the first and last bar since this is already
covered with the ohlc prices)
Open Price “x” bars before the beginning of the line
Highest high and lowest low within “x” bars before the beginning of the line
Atr Value of “z” bars before the beginning of the line
Open Price “o” bars before the beginning of the line
Highest high and lowest low within “o” bars before the beginning of the line
Atr Value of “p” bars before the beginning of the line
Moving average of “r” bars before the beginning of the line
Moving average of “s” bars before the beginning of the line
All the data to copy/save should be refreshed with each bar automatically.
There should be a manual store all objects/store selected button on the chart as well.
The csv file name should have a manual specifiable name and also automatically the Symbolname with the timeframe.
類似した注文
I have an equity reporter. This equity reporter displays the maximum and minimum equity reached over a specific interval. So, if the interval is set to 24 hours, the script will generate data in the format: "Profit ATT" (profit AtThatTime) shows max./min. during the specific interval This specific report shows data in pips. It can also be set to display in price or percentages. The interval is also easily adjustable
I want you to make me an indicator in Training View. Its idea is very simple, and I want it to have an alarm. Here's a clearer step-by-step guide to checking the last 50 candles on your chart and applying Fibonacci retracement levels based on their colors: Identify Candle Color: Start from the 100th candle from the left on the chart and check its color. If the 100th candle is green (i.e., the close is higher than the
Hello, is it possible to be made accommodation of provided signal for Forex for mt4? I bought a signal for multiple pairs. it is executing all pair.I want to use it on couple of pairs.Is it possible to be made some modifications?I do not have codes for the signal
I have an MT4 indicator, I want to receive an alert on WhatsApp when the indicator gives a buy or sell signal, I already have an API that will send the message, just send the json with the content, I will pass the API link when I have the proposal: { "symbol": "xauusd", "cellphonenumber": "00000000", "message": "test" }
i Need an expert advisor that trade by signal moving average indictors.it must check and correct the process of possible errors in trading operations. The main criteria of opening and closing positions direction of average moving,price of last bar and set the number of lots to trade as an input parameter
Creating a chart composed of different assets, weighted by their trading lot size & quantity. Using this chart to trade the assets in those lot sizes &quantity (by hand or with an EA ) In other words: composing a private index or pair, plotting that as a chart and have the ability to trade it directly with an EA and/or one order click. Inspired by Basket Chart Creator
Hello, I am highly in need of a professional and expert developer who is capable to convert my tradingview indicator to MT5, if you can perfectly do this project kindly meet me at the comment section to proceed
You must have knowledge of forex tester. Don't bother unless you do The indicator to convert from trading view to FOREX TESTER 5 -- wave trend 3d by JDEHORTY Please note this is a multi time frame indicator. Im not interested in any other wave trend indicator. It has to be a conversion of this indicator. Forex tester conversion https://www.youtube.com/watch?v=S64LjZVr9jE code python
Craet and indicator which has 15 price source and set a T/F tick for each price source then make Bollinger bands and Rsi with BollingerBands just for true sorces and plot buy and sell signals on main chart based on some conditions and strategy.... i explained every thing clear in the zip file ... theres no need to display those indicators i just need to see their value for testing how indicator works inside chart
I have one expert advisor. I optimized it and generated 3 optimized set files. As each EA can run only single set file, I need my EA to run with the parametrization from 3 set files at the same time because trade conditions those are defined by the set files are not same