I need an indicator that can copy objects from one chart to another chart.
If you have any questions please ask me!
This indicator should have the following functions:
1)
copy all objects (on/off)
save all objects to a csv file (on/off)
data to copy of all onbjects:
price/object type/color/start time/end time/name
backtestmode (on/off) – if this mode is on the indicator should just save the data and not copy it to another chart.
2)
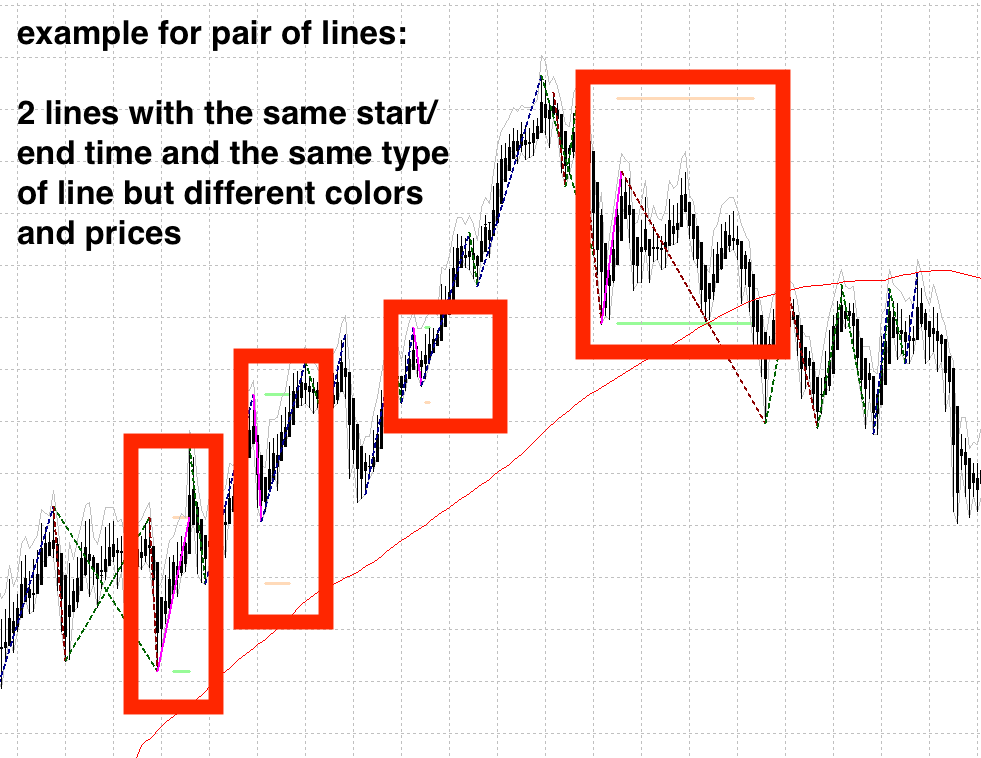
copy just selected pairs of objects (on/off)
objects that have a certain specifiable color (eg green & red) and type (eg line)
save just selected objects (on/off)
save 2 objects with the same start and end
time but with different color in one line
price /start time/end time/color/name/length in number of bars
backtestmode (on/off) – if this mode is on the indicator should just save the data and not copy it to another chart.
save additional information in the same
line such as:
Open/High/Low/Close price at the
beginning of the line
Open/High/Low/Close price at the end of
the line
Highest high and lowest low between start and end of the line (not including the first and last bar since this is already
covered with the ohlc prices)
Open Price “x” bars before the beginning of the line
Highest high and lowest low within “x” bars before the beginning of the line
Atr Value of “z” bars before the beginning of the line
Open Price “o” bars before the beginning of the line
Highest high and lowest low within “o” bars before the beginning of the line
Atr Value of “p” bars before the beginning of the line
Moving average of “r” bars before the beginning of the line
Moving average of “s” bars before the beginning of the line
All the data to copy/save should be refreshed with each bar automatically.
There should be a manual store all objects/store selected button on the chart as well.
The csv file name should have a manual specifiable name and also automatically the Symbolname with the timeframe.
相似订单
good day i have an indicator but need the source for this reason The indicator only work on a single Time frame open trade, and close with only a single TF i will like the indicator work on multiple time frame just like other installed indicator My coder said the reason it cannot work like other indicator installed is because it has no buffer First confirm if you have the source code because its a popular indicator
Hello! I am looking for an experienced Pine Script coder to create a custom indicator for mapping market structure based on fractals. The developer must be skilled in Pine Script and have a solid understanding of how to code market structure indicators. Looking forward to working with a talented developer
Hello developers, I would like to hire someone can convert the Radar Signal indicator: https://www.youtube.com/watch?v=5DmKcy7rb-U  ; to it's TradingView equivalent. Radar signal indicator is the combination of 7 classic MT4 indicators. They include ADX, RSI , CCI , OsMA, ATR, WPR. The indicator shows the values of these indicators in blue and red. Red color indicates a bearish market condition and the blue shows
Hi , i want a indicator that shows the trades history on the chart, just for current day, like : first trade : -54 Second trade : -52 Third trade : +126 , and after three trades, display "No more trades"
Hello i need someone who can convert a trading view indicator into an mt5 indicator that can work smoothly also need to add an alert on the indicator i will require to test the indicator run it for 1-2days to confirm all is okay thank you
Here's a clearer step-by-step guide to checking the last 50 candles on your chart and applying Fibonacci retracement levels based on their colors: Identify Candle Color: Start from the 100th candle from the left on the chart and check its color. If the 100th candle is green (i.e., the close is higher than the open): Draw a Fibonacci Retracement: From the highest price to the lowest price of this candle. Check the
Here's a clearer step-by-step guide to checking the last 50 candles on your chart and applying Fibonacci retracement levels based on their colors: Identify Candle Color: Start from the 100th candle from the left on the chart and check its color. If the 100th candle is green (i.e., the close is higher than the open): Draw a Fibonacci Retracement: From the highest price to the lowest price of this candle. Check the
I have an equity reporter. This equity reporter displays the maximum and minimum equity reached over a specific interval. So, if the interval is set to 24 hours, the script will generate data in the format: "Profit ATT" (profit AtThatTime) shows max./min. during the specific interval This specific report shows data in pips. It can also be set to display in price or percentages. The interval is also easily adjustable
I want you to make me an indicator in Training View. Its idea is very simple, and I want it to have an alarm. Here's a clearer step-by-step guide to checking the last 50 candles on your chart and applying Fibonacci retracement levels based on their colors: Identify Candle Color: Start from the 100th candle from the left on the chart and check its color. If the 100th candle is green (i.e., the close is higher than the
Hello, is it possible to be made accommodation of provided signal for Forex for mt4? I bought a signal for multiple pairs. it is executing all pair.I want to use it on couple of pairs.Is it possible to be made some modifications?I do not have codes for the signal