I need an indicator that can copy objects from one chart to another chart.
If you have any questions please ask me!
This indicator should have the following functions:
1)
copy all objects (on/off)
save all objects to a csv file (on/off)
data to copy of all onbjects:
price/object type/color/start time/end time/name
backtestmode (on/off) – if this mode is on the indicator should just save the data and not copy it to another chart.
2)
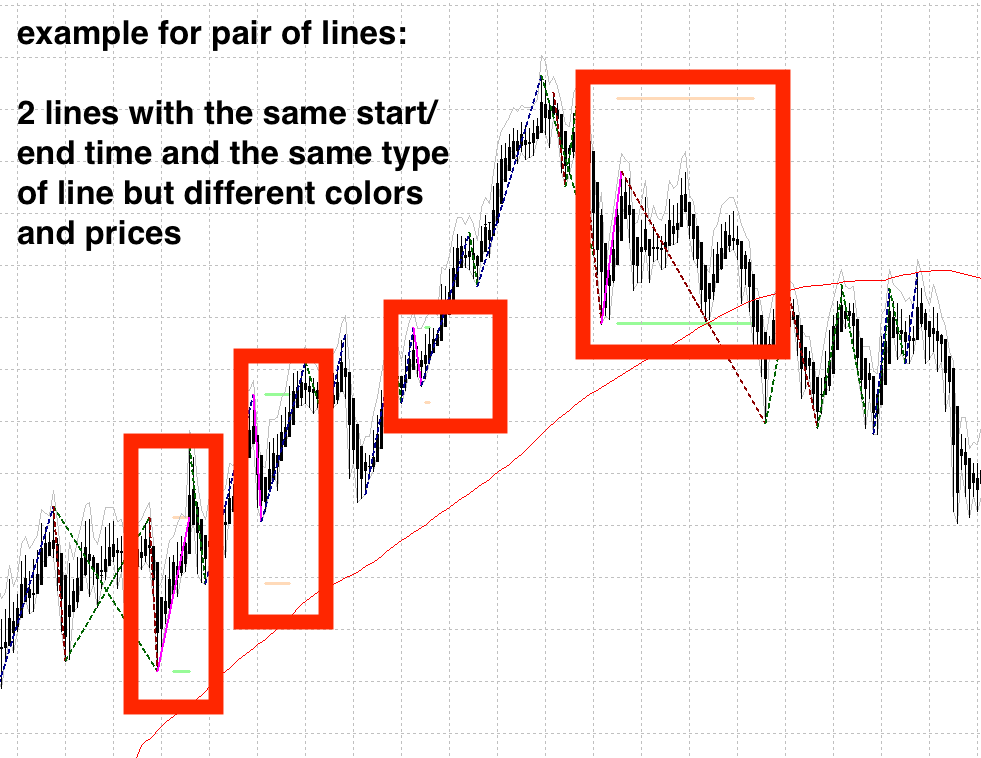
copy just selected pairs of objects (on/off)
objects that have a certain specifiable color (eg green & red) and type (eg line)
save just selected objects (on/off)
save 2 objects with the same start and end
time but with different color in one line
price /start time/end time/color/name/length in number of bars
backtestmode (on/off) – if this mode is on the indicator should just save the data and not copy it to another chart.
save additional information in the same
line such as:
Open/High/Low/Close price at the
beginning of the line
Open/High/Low/Close price at the end of
the line
Highest high and lowest low between start and end of the line (not including the first and last bar since this is already
covered with the ohlc prices)
Open Price “x” bars before the beginning of the line
Highest high and lowest low within “x” bars before the beginning of the line
Atr Value of “z” bars before the beginning of the line
Open Price “o” bars before the beginning of the line
Highest high and lowest low within “o” bars before the beginning of the line
Atr Value of “p” bars before the beginning of the line
Moving average of “r” bars before the beginning of the line
Moving average of “s” bars before the beginning of the line
All the data to copy/save should be refreshed with each bar automatically.
There should be a manual store all objects/store selected button on the chart as well.
The csv file name should have a manual specifiable name and also automatically the Symbolname with the timeframe.
Ähnliche Aufträge
I need to make EA (Expert Advisor) and would appreciate it if you could provide your most competitive quote. Please let me know your best price for completing these changes, as I’m looking to get this done promptly and effectively. Thank you
I need a programmer for converting a MetaTrader indicator into ea for TradeLocker. Additionally, I would like to have a new EA built in TradeLocker that mirrors the logic of the original MetaTrader, including the specific rules and conditions I need. Please contact me only if you have prior experience converting scripts from MetaTrader to TradeLocker
I HAVE A SQ EA AND IT NEEDS TO RUN WITH 3 SETS WITH DIFFERENT TIME CONFIGURATION. Basically the trade logic will read different input values for the same parameter with the same and/or different timeframes and manage trades accordingly and individually. If it is a trouble, timeframe can be ignored and we can continue only with the parametrization
I need to make several modifications to an EA (Expert Advisor) and would appreciate it if you could provide your most competitive quote for these edits. Please let me know your best price for completing these changes, as I’m looking to get this done promptly and effectively. Thank you
hello here am looking for someone that can assist me in removing validation form my demo file and if anyone is interested dm the for more details i will be waiting to get any reply by some on that can assist me with this
I want a combined Standard deviation channel and Fibonacci channel indicators into just one indicator. The standard deviation channel lines would have same characteristics as the Fibonacci lines in terms of format (adjustable width, colors, type, size etc.). I want unique buffer values for all the lines (for both the 3 upper and 3 lower STD.DEV lines and the same for the Fibonacci channel lines) which would be
A green point should be added at the Low point of candlesticks in the oversold zone—it is the L point. If there is at least one L point between two H points, search for a LL point in the interval between two H points. The candlestick with the lowest Low price will be the LL point. Generally, the LL point is not necessarily an L point. Search for candlesticks with the lowest Low price. If there is at least one H point
Trading robots are programs, which operate according to underlying algorithms. An algorithm is a set of actions that need to be performed in response to certain events. For example, the most common task in algo trading is the identification of the "New bar" event. When the event occurs, the robot checks the emergence of trading signals and acts accordingly. Before you decide to program or order a trading robot, you
The overbought zone is determined as candlesticks, at which the indicator value Value > Lmax (Lmax=-20). The oversold zone is determined as candlesticks, at which the indicator value Value < Lmin (Lmin=-80). The values of Lmax and Lmin should be included in indicator parameters. A yellow point should be added at the High point of candlesticks in the overbought zone—it is the H point. A green point should be added at
Help me to trade create orders for me and analyze the markets and decide when is a good time to buy or sell. Determine which pairs are best to use to trade with and indicate trading signals to me