Lorentzos Roussos
Lorentzos Roussos
4.8 (209)
  • Informazioni
11+ anni
esperienza
11
prodotti
297
versioni demo
220
lavori
0
segnali
0
iscritti
🎱🏓🎷💚☕️

💎 The simplest Neural Network Coding Guide : https://www.mql5.com/en/blogs/post/752324

💎 The simplest DLL for mql5 Coding Guide : https://www.mql5.com/en/blogs/post/753426

💎 Harmonic patterns scanner for MT5 : https://www.mql5.com/en/market/product/51212

💎 Similar price action candlestick patterns indicator for MT5 : https://www.mql5.com/en/market/product/133318

💎 Fibonacci Sonar indicator : https://www.mql5.com/en/market/product/133627

💎 Chart projection indicator : https://www.mql5.com/en/market/product/5569

💎 Youtube : https://www.youtube.com/@lorentzor1938
Lorentzos Roussos
Lorentzos Roussos
Header file with all activation functions and all derivation functions from metaquotes .
Dive in : https://c.mql5.com/3/406/VectorActivationFunction.mqh

From here : https://www.mql5.com/en/forum/445076#comment_46333973

☕️
Lorentzos Roussos
Lorentzos Roussos
fake usdjpy candles with neural network and autoencoder 😊

https://www.mql5.com/en/blogs/post/752382
ArpitTailang
[Eliminato] 2023.04.09
wow
Lorentzos Roussos
Lorentzos Roussos 2023.04.10
😊
Lorentzos Roussos
Lorentzos Roussos
Simple neural network example with mql5 . 😊☕️

https://www.mql5.com/en/blogs/post/752324
Lorentzos Roussos
Warning : this is my first attempt at an autoencoder i've seen a video or 2 on autoencoders so i might butcher this With that out of the way let's pop a beer open and grab the keyboard...
Lorentzos Roussos
Read Part 1 : The simplest XOR gate neural network Okay . What do we have : nodes , layers and the net and the feed forward functions . So what does that mean in the spectrum of "a problem...
Lorentzos Roussos
XOR Gate example neural network in mql5 , as simple as possible 🍺 I'll assume you know what the XOR gate "problem" is . A quick refreshing pro schematic : The first 2 columns are the 2 inputs and the third column is the expected result from that operation...
Lorentzos Roussos
Lorentzos Roussos
Node trying to separate the yellow class samples from the red class samples (dot=sample) 😂
That means :
a.i'm terrible in math 😂
b.the network believes "if you slap it around it will work" 😂(on a serious note , the display is the "world" the network creates )
back to the drawing board...
(90 features one node)
Eugen Funk
Eugen Funk 2023.04.01
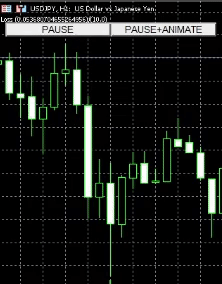
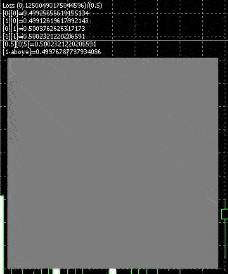
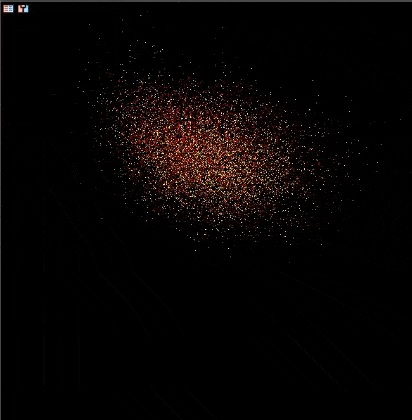
Nice animation. Btw, you won't be able to separate them as long as you use X and y only as "features".
Lorentzos Roussos
Lorentzos Roussos 2023.04.01
You mean i can't separate them on a 2 dimensional spectrum . (features are 90) but its one layer deep
Lorentzos Roussos
If you found this blog post it implies you've been bombarded with maths , every lecture and every tutorial you watch has a giant black (or white) board full of equations and zero screens with source code...
prodotto condiviso
100% Free MT4 Indicator Includes :
✔️ Support Resistance Levels
✔️ Projection
✔️ Currency Strength of the 2 chart currencies (if on a currency pair)
✔️ Renko Chart
✔️ Heiken Ashi Chart
✔️ Some Data Charts
✔️ Info on latest asset highs and lows (such as 2nd higher high etc)

💎 More Info on this short video (dont need to have sound on its quitte visual) : https://www.youtube.com/watch?v=qkwq43ic2cs

📢 Subscribe to Telegram Channel for more : https://t.me/lorentzor
Recensioni: 44
FREE

Indicatore di proiezione del grafico La proiezione del grafico è iniziata come un piccolo indicatore che utilizzava l'indicatore tecnico a zig zag integrato per prevedere l'azione futura dei prezzi (puoi trovare il vecchio algoritmo nei commenti) L'idea è semplice, l'azione dei prezzi passata non si traduce nel futuro ma forse se non diventiamo eccessivamente specifici o, eccessivamente generici, possiamo estrarre linee guida su ciò che potrebbe accadere. La "tesi" della proiezione del grafico

Thanks 🙏🙏🙏
Lev Vladimirovic Marushkin
Recensione per prodotto Chart Projection
GREAT Indicator! Hopefully one day there will be on screen buttons to change the projection type. Really dont like to open settings every time to switch to another projection method BUT this is really
Lorentzos Roussos Prodotto pubblicato

Profilo del mercato Forex (FMP in breve) Cosa non è: FMP non è il classico display TPO con codice alfabetico, non mostra il calcolo generale del profilo dati del grafico e non segmenta il grafico in periodi e non li calcola. Cosa fa : Soprattutto, l'indicatore FMP elaborerà i dati che risiedono tra il bordo sinistro dello spettro definito dall'utente e il bordo destro dello spettro definito dall'utente. L'utente può definire lo spettro semplicemente tirando ciascuna estremità dell'indicatore

Lorentzos Roussos Prodotto pubblicato
Recensioni: 6
44.00 USD

Modelli armonici EA se preferisci vederlo su un grafico in tempo reale invece di leggere la descrizione,   puoi scaricare immediatamente una demo gratuita qui. Modelli inclusi: Modello ABCD Modello Gartley Modello pipistrello Modello cifrato 3Modello di guida Motivo cigno nero Motivo cigno bianco Motivo Quasimodo o Motivo Over Under Modello alternativo del pipistrello Motivo a farfalla Modello di granchio profondo Modello di granchio Modello di squalo Modello FiveO Modello testa e spalle

Kristina Suh
Kristina Suh 2022.03.15
Great EA, excited to start using it. do you have any presets that we can start with?
Lorentzos Roussos
Lorentzos Roussos 2022.05.28
Thank you
Lorentzos Roussos Prodotto pubblicato
Recensioni: 11
44.00 USD

Modelli armonici ,scanner e trader Modelli inclusi: Modello ABCD Modello Gartley Modello pipistrello Modello cifrato 3Modello di guida Motivo cigno nero Motivo cigno bianco Motivo Quasimodo o Motivo Over Under Modello alternativo del pipistrello Motivo a farfalla Modello di granchio profondo Modello di granchio Modello di squalo Modello FiveO Modello testa e spalle Modello triangolo ascendente Uno due tre modello E 8 modelli personalizzati Voenix è uno scanner di pattern armonici multi

Lorentzos Roussos Prodotto pubblicato
Recensioni: 44
FREE

Indicatore di proiezione del grafico La proiezione del grafico è iniziata come un piccolo indicatore che utilizzava l'indicatore tecnico a zig zag integrato per prevedere l'azione futura dei prezzi (puoi trovare il vecchio algoritmo nei commenti) L'idea è semplice, l'azione dei prezzi passata non si traduce nel futuro ma forse se non diventiamo eccessivamente specifici o, eccessivamente generici, possiamo estrarre linee guida su ciò che potrebbe accadere. La "tesi" della proiezione del grafico