Volume Profile Analyzer

# Volume Profile Analyzer — Comprendi dove il mercato negozia

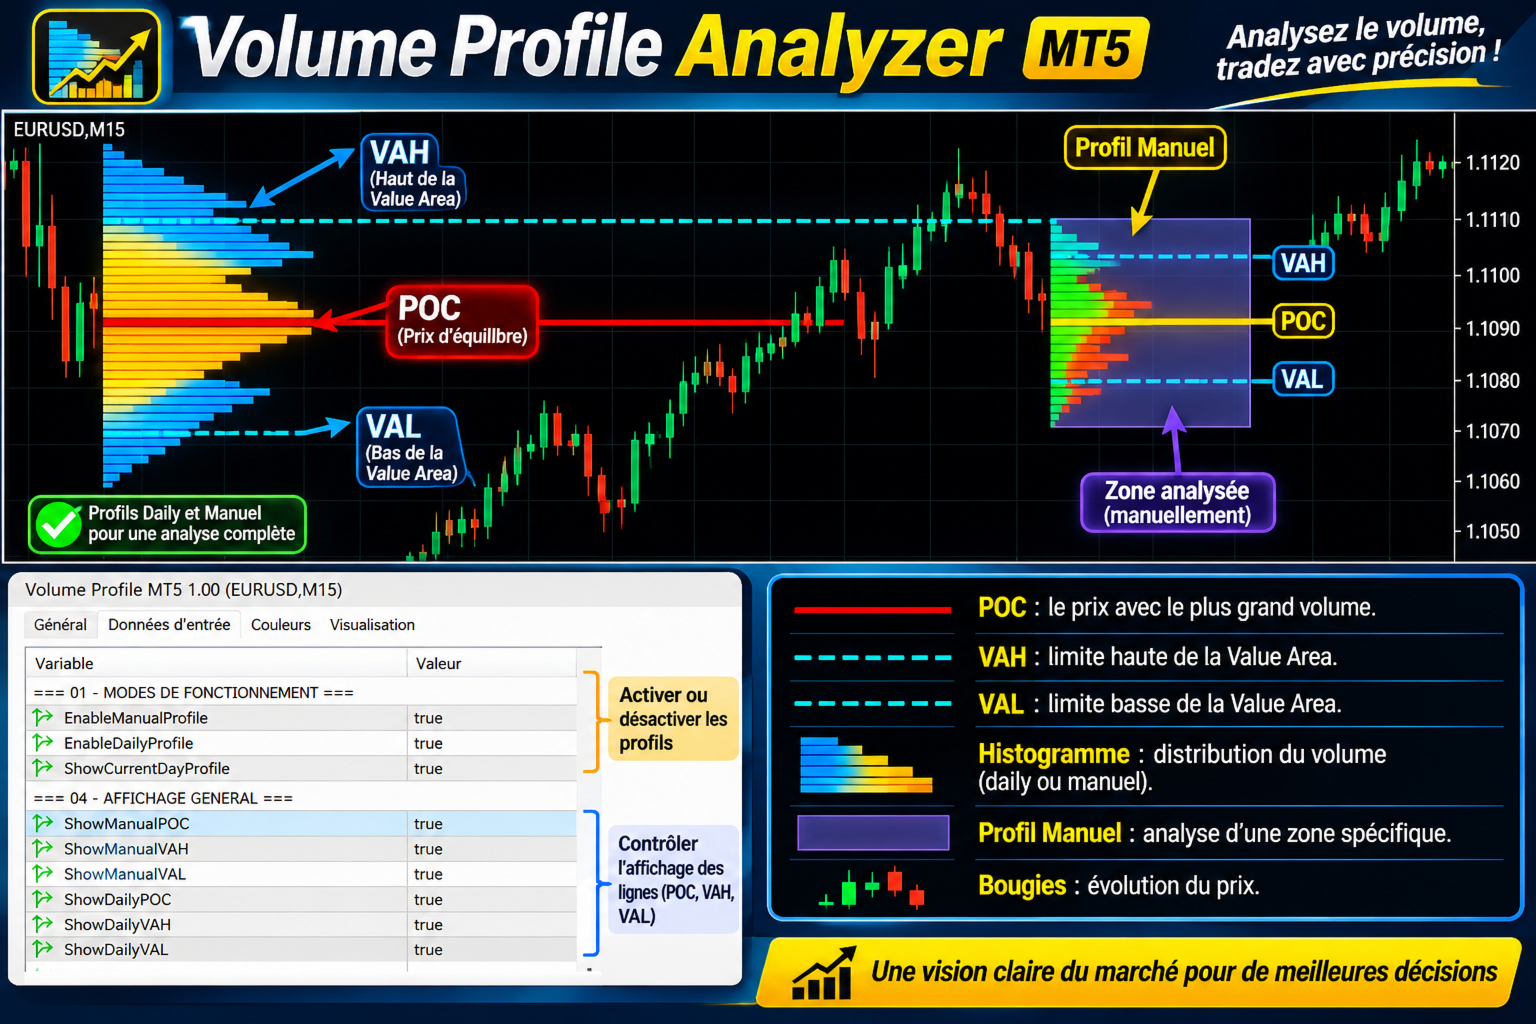
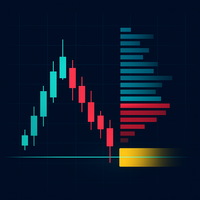
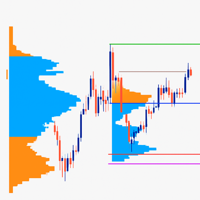
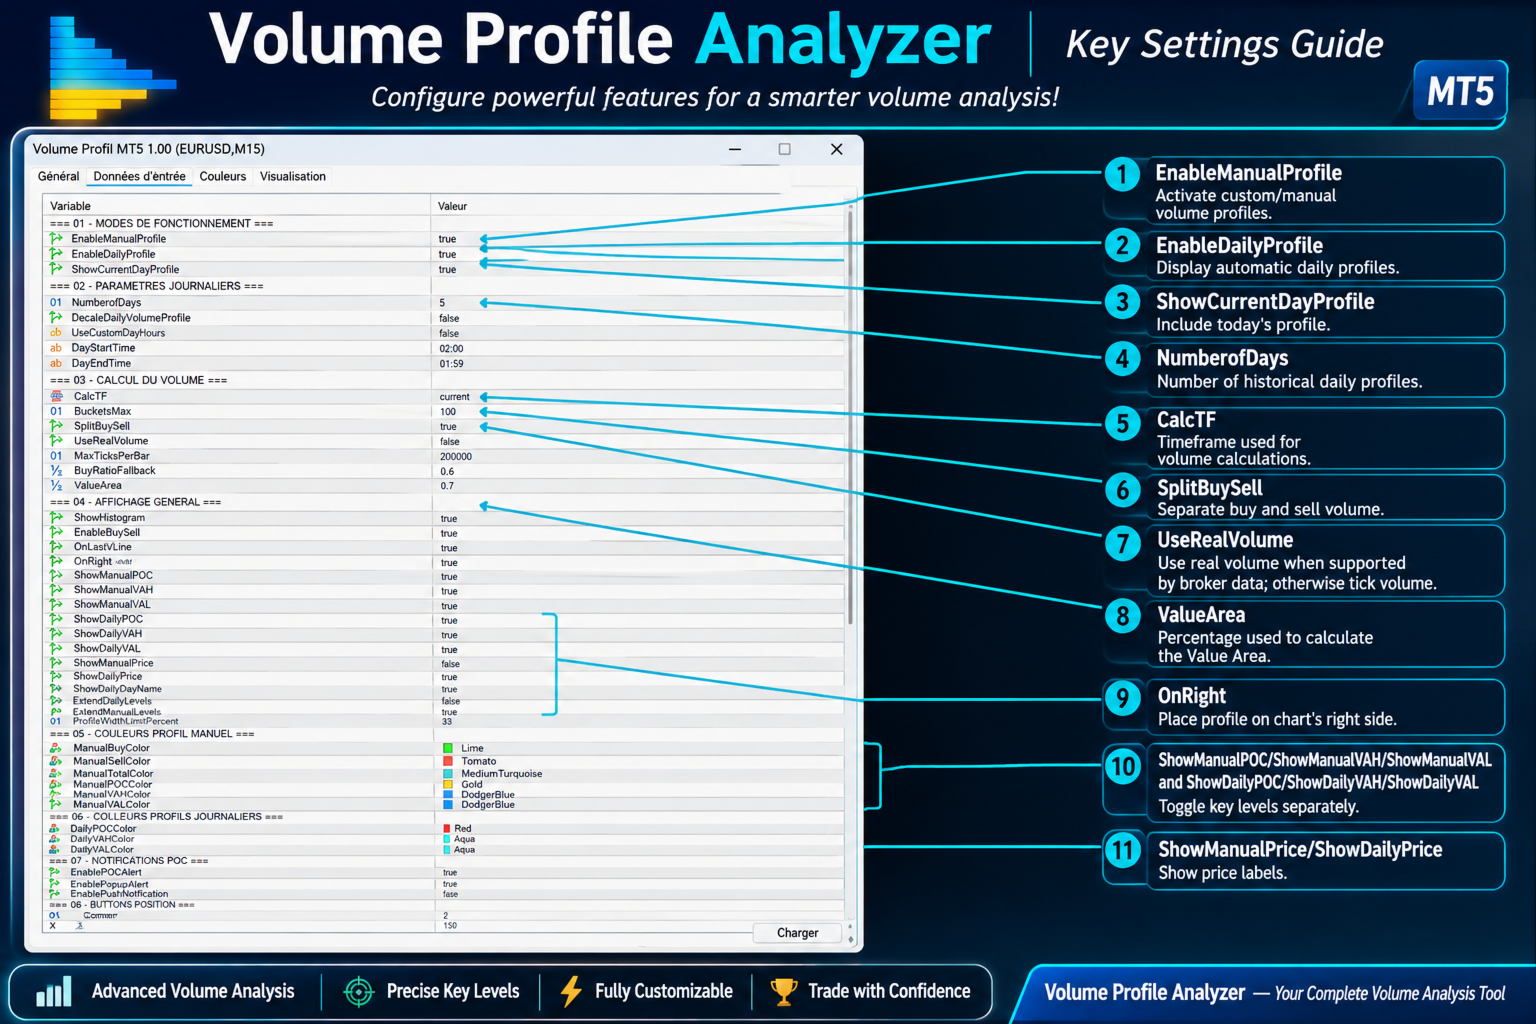
**Volume Profile Analyzer** è un potente strumento di analisi dei volumi per MetaTrader 5, progettato per aiutare i trader a comprendere come l'attività di mercato si distribuisce sui diversi livelli di prezzo.

Invece di concentrarsi esclusivamente su quando il prezzo si muove, l'indicatore permette di individuare dove si concentra maggiormente il volume, quali livelli mostrano una maggiore attività e quali aree potrebbero essere importanti per future reazioni del mercato.

È adatto allo scalping, al day trading e allo swing trading.

## Funzionalità principali

### Daily Volume Profile — Profilo Volume Giornaliero
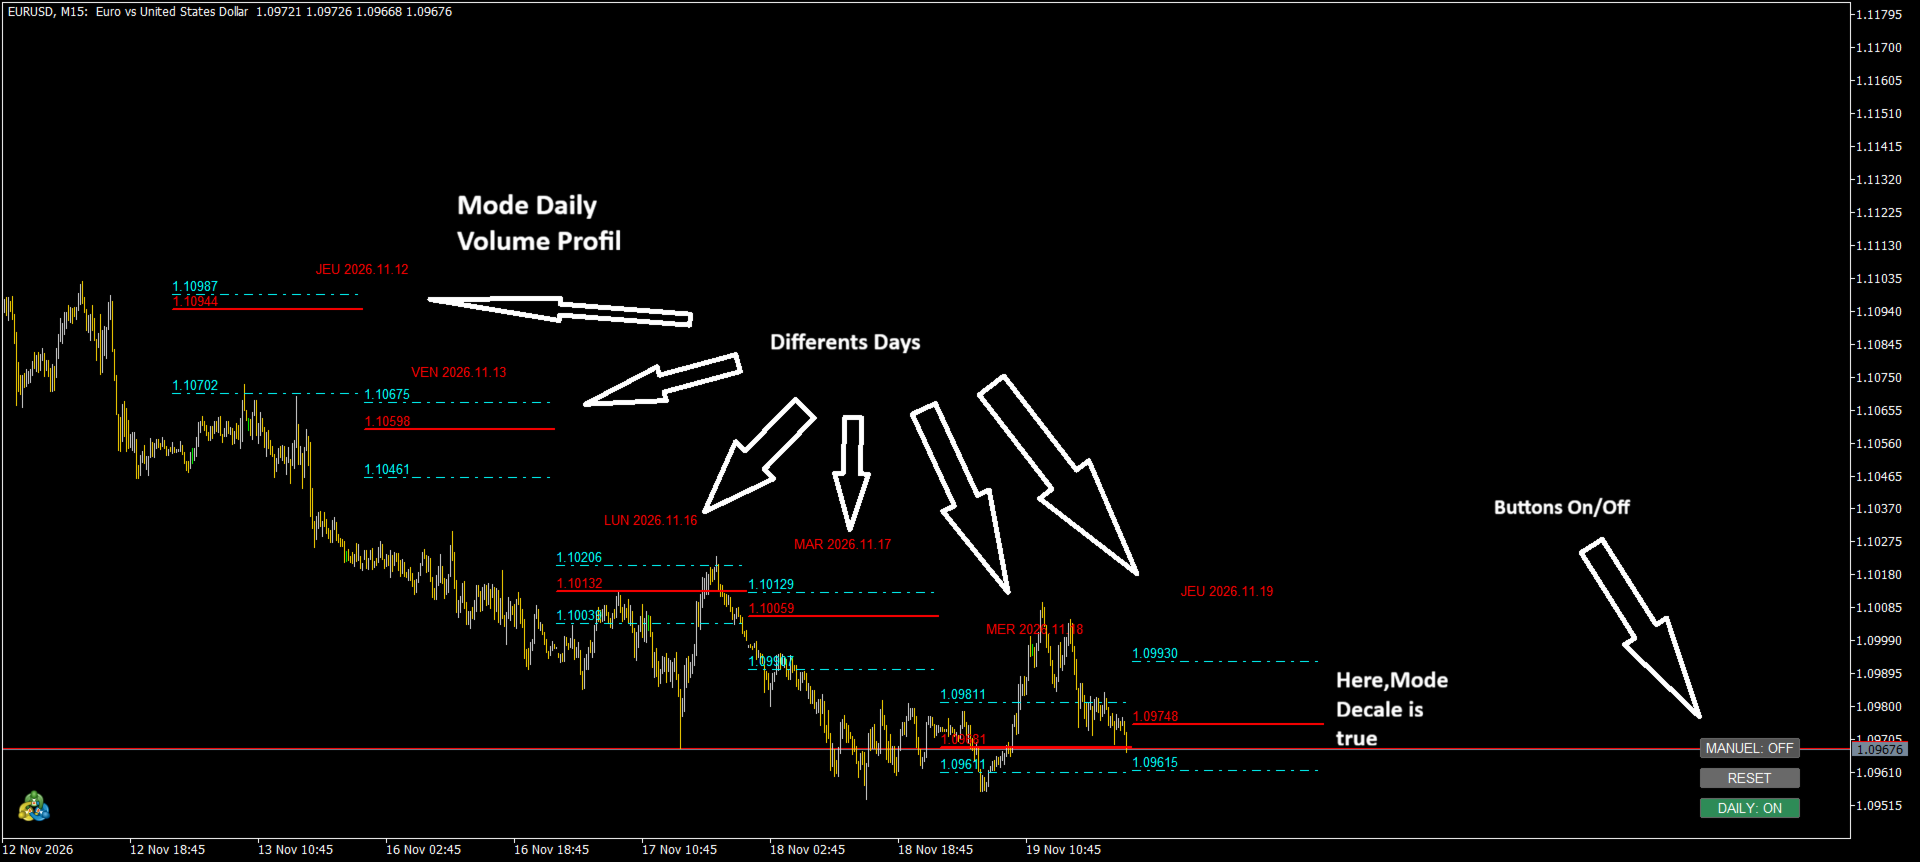
Visualizza automaticamente i profili dei volumi delle sessioni giornaliere.

- Visualizzazione di più profili giornalieri storici.
- Configurazione del numero di giorni da visualizzare.
- Personalizzazione dell'orario di inizio e fine della sessione.
- Spostamento dei profili giornalieri per una migliore leggibilità.
- Possibilità di visualizzare il profilo della giornata corrente.
- Analisi della distribuzione dei volumi per livello di prezzo.
- Estensione dei livelli giornalieri importanti.
- Opzione per visualizzare il nome o il giorno della sessione.

### Manual Volume Profile — Profilo Volume Manuale
Crea profili personalizzati direttamente sul grafico per analizzare specifiche aree di prezzo o periodi di mercato.

- Analisi di intervalli di prezzo selezionati.
- Studio della distribuzione dei volumi in aree specifiche.
- Personalizzazione dei colori dei profili manuali.
- Controllo indipendente della visualizzazione dei profili manuali e dei loro elementi.

### Point of Control (POC)
Il POC identifica il livello di prezzo con la maggiore concentrazione di volume all'interno di un profilo.

Può essere utilizzato per individuare aree di elevata attività, possibili punti di attrazione del prezzo e zone importanti da monitorare in caso di reazioni del mercato.

### VAH e VAL — Value Area
La Value Area rappresenta l'intervallo di prezzo che contiene la percentuale di volume definita nelle impostazioni.

- **VAH:** limite superiore della Value Area.
- **VAL:** limite inferiore della Value Area.

Questi livelli aiutano a identificare la principale zona di attività e a valutare se il prezzo si trova al suo interno, al di sopra o al di sotto.

### Istogramma dei volumi

- Visualizzazione della distribuzione dei volumi direttamente sul grafico.
- Possibilità di mostrare il volume totale.
- Distribuzione Buy/Sell Volume.
- Colori dell'istogramma personalizzabili.
- Regolazione della posizione e della larghezza dei profili.

### Analisi Buy/Sell Volume
Analizza la distribuzione del volume di acquisto e vendita sui diversi livelli di prezzo.

In base ai dati disponibili e alle impostazioni di calcolo, l'indicatore può utilizzare Real Volume o Tick Volume.

### Impostazioni avanzate di calcolo

- Selezione del timeframe di calcolo.
- Regolazione del numero di segmenti di prezzo del profilo.
- Configurazione della suddivisione Buy/Sell.
- Selezione tra Real Volume e Tick Volume, quando supportati.
- Configurazione dei limiti di calcolo e delle opzioni alternative.
- Personalizzazione della percentuale della Value Area.

### Visualizzazione flessibile

- Controllo indipendente di POC, VAH e VAL.
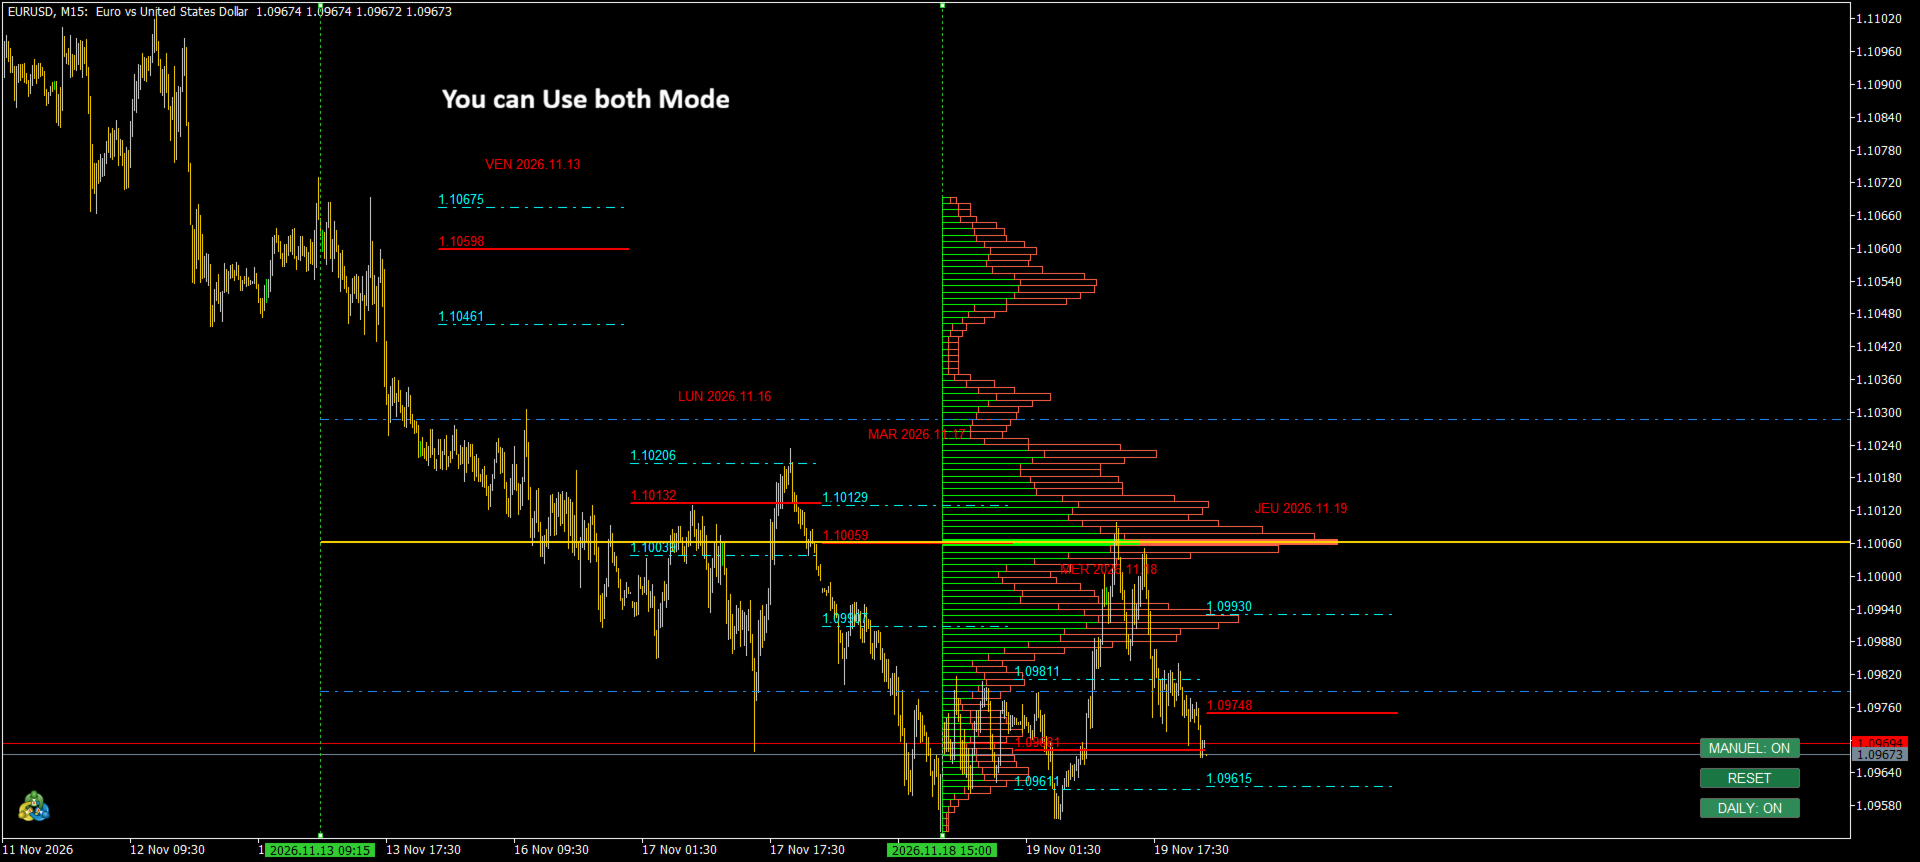
- Gestione separata dei profili Daily e Manual.
- Configurazione dell'estensione dei livelli.
- Visualizzazione delle etichette di prezzo.
- Regolazione del posizionamento dei profili.
- Limitazione della larghezza dei profili rispetto al grafico.
- Personalizzazione dei colori degli istogrammi e dei livelli chiave.
- Controlli disponibili direttamente sul grafico.

### Alert
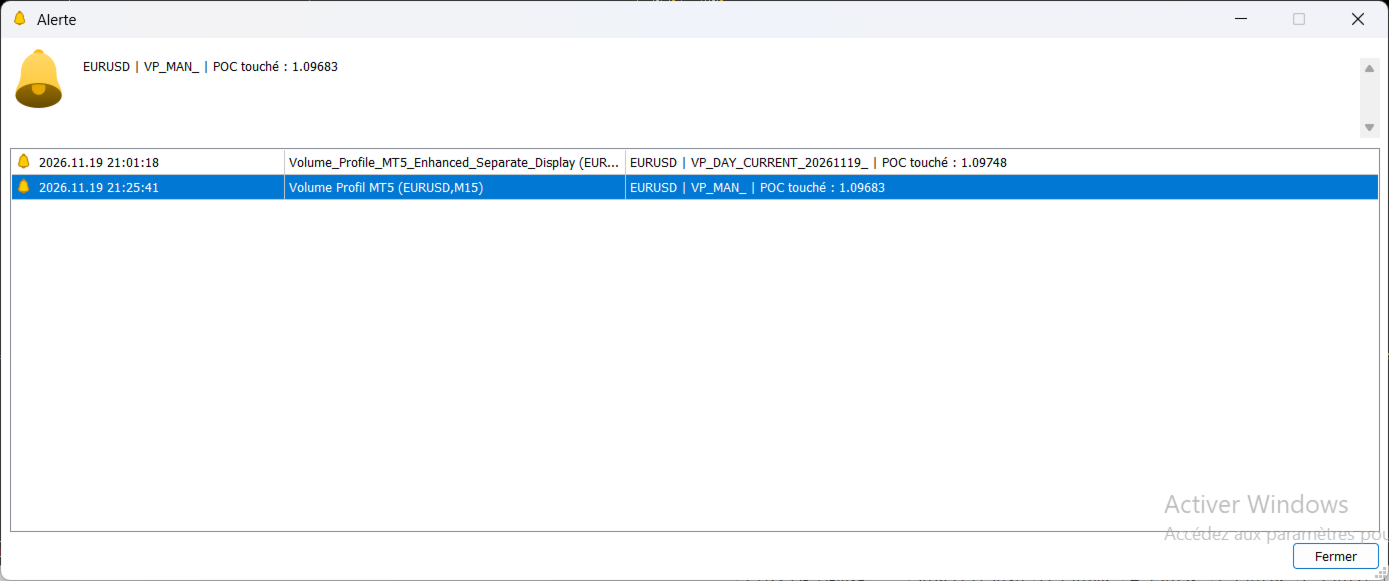
Utilizza le opzioni di alert disponibili per monitorare gli eventi legati al POC e prestare attenzione ai livelli di volume più importanti.

## Come utilizzare Volume Profile Analyzer nel trading

**1. Analizza i profili giornalieri**

Osserva la distribuzione dei volumi delle sessioni precedenti. Identifica POC, VAH, VAL e la forma generale del profilo.

**2. Individua le zone di prezzo importanti**

Segna le aree di maggiore concentrazione dei volumi e i limiti della Value Area. Utilizzale per preparare scenari di trading.

**3. Osserva la reazione del prezzo**

Quando il prezzo si avvicina a un POC, VAH o VAL, analizza eventuali rifiuti, accettazioni, consolidamenti, breakout o cambiamenti di momentum.

**4. Utilizza i profili manuali**

Crea profili su movimenti specifici, impulsi, range o fasi di consolidamento per studiare in dettaglio la distribuzione dei volumi.

**5. Combina l'indicatore con la tua strategia**

Integra Volume Profile Analyzer con Price Action, struttura del mercato, trend, liquidità, supporti e resistenze o altri strumenti di analisi tecnica.

Volume Profile Analyzer non prevede il mercato. Offre una rappresentazione strutturata dell'attività di trading per supportare analisi più consapevoli e decisioni meglio organizzate.

**Analizza i volumi. Comprendi la struttura dei prezzi. Fai trading con maggiore chiarezza.**
Prodotti consigliati
Stratamark Volume Profile shows where the volume really traded, period by period. Each profile is a histogram next to the candles with the point of control (POC), the value area (VAH / VAL), high and low volume nodes, and the POCs of earlier periods that price has not touched yet (naked POC). One chart object, no clutter, no signals: you read the levels and decide. Analysis tool. No signals, no profit promises. WHAT YOU GET 1. Profiles for every period you work with Sessions: Asia, London and Ne
Delta Profile Volume
Teresinha Moraes Correia
Technical Description of the Indicator – Delta Profile for MetaTrader 5 The Delta Profile is an indicator developed for MetaTrader 5 focused on detailed analysis of volume flow within a defined range of candles. It organizes and displays information about the imbalance of positive volumes (associated with upward movements) and negative volumes (associated with downward movements) at different price levels. The result is a clear view of the chart points where the highest concentration of trades o
Dual Scale Candles
Mohamed Amr Mohamed Osama Abdelwahab
Dual Scale Candles sovrappone le candele reali di un secondo simbolo direttamente sul tuo grafico, con una scala di prezzo indipendente sull'asse sinistro. Confronta l'oro con una valuta, il petrolio con un indice o due strumenti qualsiasi sullo stesso grafico - ciascuno mantiene i propri prezzi reali. Le due serie sono allineate nel punto che scegli: la prima barra del giorno corrente mostrata sul grafico, la prima barra della settimana corrente o la barra più vecchia disegnata - sulla barra d
FREE
L'indicatore costruisce le quotazioni attuali, che possono essere confrontate con quelle storiche e su questa base fanno una previsione del movimento dei prezzi. L'indicatore ha un campo di testo per una rapida navigazione fino alla data desiderata. Opzioni: Simbolo - selezione del simbolo che visualizzerà l'indicatore; SymbolPeriod - selezione del periodo da cui l'indicatore prenderà i dati; IndicatorColor - colore dell'indicatore; HorisontalShift - spostamento delle virgolette disegnate d
Volume Candle Indicator
Pablo Filipe Soares De Almeida
Istogramma del Volume Colorato per MetaTrader 5 Questo indicatore mostra il volume come un istogramma in una finestra separata. Le barre sono colorate in base alla direzione della candela: verde per rialzista (chiusura > apertura) e rosso per ribassista (chiusura < apertura). Funzionalità principali Fonte del volume: volume dei tick o volume reale (selezionabile). Linea di media mobile opzionale sopra l’istogramma del volume. Tipi di media supportati: SMA, EMA, SMMA, LWMA. Periodo medio configur
ORDER FLOW STRUCTURE AUTOPOC PRO Order Flow Structure AutoPOC Pro is a MetaTrader 5 market analysis indicator that combines market structure, Order Flow, Volume Profile, POC, Value Area, liquidity, FVG, Order Blocks, daily levels, session analysis and risk planning in one visual workspace. The indicator is designed for traders who want to analyze price action and market participation without relying on multiple separate indicators. It does not execute trades automatically. All trading decisions
SMART EXIT Currency Strength Meter is a professional Forex currency strength indicator designed to identify the strongest and weakest currencies in real time. The indicator analyzes 27 major Forex pairs and ranks the 8 major currencies according to their relative strength. By combining EMA momentum analysis with volatility-adjusted calculations, traders can quickly identify market leaders and laggards without manually reviewing dozens of charts. Main Features • Real-time ranking of the 8 major c
PnlVision
Patrick Amenuveve Koudjo Johnson
PnLVision is a chart overlay for MetaTrader 5 that complements the built-in crosshair. The native crosshair shows the price and the time under the cursor. PnLVision adds the measurements that are usually calculated by hand. How it works Move the mouse over the chart. A compact text block follows the cursor and shows: - the symbol and the lot size used for the calculation; - the number of bars between the reference point and the cursor; - the distance in ticks and in pips; - the profit or loss th
FREE
Market Profile 3 ForexArby com
Hussien Abdeltwab Hussien Ryad
4 (15)
Market Profile 3 MetaTrader 5 indicator  version 4.70— is a classic Market Profile implementation that can show the price density over time, outlining the most important price levels, value area, and control value of a given trading session. This indicator can be attached to timeframes between M1 and D1 and will show the Market Profile for daily, weekly, monthly, or even intraday sessions. Lower timeframes offer higher precision. Higher timeframes are recommended for better visibility. It is als
FREE
UPD1 Profile Levels MT5
Vitaliy Kuznetsov
5 (4)
L'indicatore trova i livelli del volume di prezzo massimo e minimo (profilo di mercato) nell'istogramma di lavoro per il numero specificato di barre.   Profilo composito. L'altezza dell'istogramma è completamente automatica e si adatta a qualsiasi strumento e periodo di tempo. Viene utilizzato l'algoritmo dell'autore e non ripete analoghi noti. L'altezza dei due istogrammi è approssimativamente uguale all'altezza media della candela. Smart alert (smart alert) ti aiuta a comunicare il prezzo rela
Gold Pressure Matrix
Christopher Calmerin
OVERVIEW -------- Gold Pressure Matrix MTF is a professional MetaTrader 5 indicator designed to estimate bullish and bearish pressure in the gold market. Instead of relying on one signal, the indicator combines five analytical modules across five configurable timeframes. It then displays Buy Pressure, Sell Pressure, timeframe alignment, signal quality, market condition, and a final directional signal inside a clear black dashboard. The indicator is primarily designed for XAUUSD and can be used a
FREE
L'indicatore Cumulative Volume Delta (CVD) – e le relative candele "Volume Delta" – rientra nella categoria degli indicatori di *order flow* (flusso degli ordini) basati sui volumi. A differenza di un indicatore di volume standard, che mostra semplicemente il volume totale degli scambi, il CVD misura nello specifico la differenza netta tra la pressione in acquisto e quella in vendita sul mercato. Ecco come è strutturato: Volume Delta (le candele): misura la differenza tra gli ordini di acqui
Deriv Synthetic HTF Candle Projection GMT2 Higher Timeframe Candle Projection & Previous Levels Tool for Deriv Synthetic Indices (MT5) Overview Deriv Synthetic HTF Candle Projection GMT2 is a professional MetaTrader 5 indicator built specifically for Deriv Synthetic indices . It projects the current forming Higher Timeframe (HTF) candle onto the chart and automatically draws key reference levels from previous candles. This indicator is designed to help traders maintain higher timeframe context
FREE
Demo test with Demo  account  NB: Ask for manual user and vip setting DigitopiaVolumeProfileV2 is a professional Anchored Volume Profile indicator for MetaTrader 5. Designed for institutional traders, it provides precise visualization of liquidity, value areas, and order flow.  KEY FEATURES: Manually Anchored Profiles: Define your own analysis periods with draggable Start/End lines. Value Area (CME): Automatic calculation of POC, VAH, and VAL according to market standards. Delta Volume & True Ti
Dolphin Wave Rider IMM is an automated MetaTrader 5 strategy designed to evaluate structured trend opportunities using hourly price data. The strategy combines market-structure breaks with trend alignment and Relative Strength Index confirmation. By default, trading decisions use completed candles to reduce intrabar signal changes. ### Trade management Automatic entries use broker-adapted stop-loss and take-profit prices. Position volume can be calculated from an equity-risk percentage or a fixe
Daily Volume Profile (Multi-Day) for MT5 This indicator provides a clean, fast and highly optimized Daily Volume Profile for the last N days , updated automatically every minute without flickering or chart lag. It draws full market structure: POC, VAH, VAL, Value Area, Day High/Low, Volume Distribution Buckets , and adapts dynamically to any timeframe using built-in shifting logic. Key Features: Volume Profile for the last N days (configurable) True daily POC, VAH, VAL with automatic labels
Accesso Ufficiale all'Ecosistema BlueDigitsFx Ricevi aggiornamenti sull'infrastruttura, risorse operative, nuovi prodotti e accesso all'ecosistema ufficiale BlueDigitsFx. Ecosistema Telegram Sito Web Versione MT4 BlueDigitsFx Spike And Strike Reversal MT5 — Oscillatore Composito per l'Analisi delle Inversioni di Mercato e del Momentum BlueDigitsFx Spike And Strike Reversal è un oscillatore composito che combina molteplici segnali di indicatori per aiutare i trader a identificare potenziali i
Price Volume Trend (PVT) Oscillator Description:  The PVT Oscillator is a volume indicator that serves as an alternative to the standard On-Balance Volume (OBV). While ordinary volume indicators can be noisy and hard to read, this tool converts volume flow into a clear Histogram Oscillator, similar to a MACD, but for Volume. It is designed to detect first  Trend Reversals and Divergences by analyzing the difference between a Fast and Slow PVT moving average. Why is this better than standard OBV?
FREE
Orange Indicator by Quant Atlas Creator:  https://www.quant-atlas.com/ Orange Indicator is a clean reversal focused indicator for MetaTrader 5, designed to highlight potential turning points directly on the chart using simple orange buy and sell markers. The indicator focuses on moments where price may be transitioning out of short term exhaustion and into a possible reaction phase. When a bullish setup appears, an orange upward triangle is displayed below the candle. When a bearish setup appear
FREE
RSI Currency Strength Meter is a powerful and elegant multi-currency indicator that measures the real-time relative strength of the 8 major currencies using RSI logic. By calculating the smoothed performance of each currency across its major pairs and applying the RSI formula, it delivers clean and responsive strength lines that make it easy to spot which currencies are truly strong or weak at any moment. This indicator is particularly useful for visualizing currency correlations and divergence
This is a multi timeframe version of the  Supply and Demand indicator . It allows you to analyze a chart using the law of supply and demand on three different timeframes at a time. You will see zones of sales and purchases and determine the most profitable points to open positions. The indicator is based on the principle of market fractality. Supply and demand zones show places where a strong buyer or seller has made the price reverse and change its direction. The indicator has several types of
FREE
Price Magnet — Price Density and Attraction Levels Indicator Price Magnet is a professional analytical tool designed to identify key support and resistance levels based on statistical Price Density. The indicator analyzes a specified historical period and detects price levels where the market spent the most time. These zones act as “magnets,” attracting price action or forming a structural base for potential reversals. Unlike traditional Volume Profile tools, Price Magnet focuses on price-time d
MVProfile
Patrick Omar Sanduyogan
Market Volume Profile Indicator Built on Auction Market Theory , this indicator shows where price is accepted (high volume) and rejected (low volume). It helps you identify: POC / Value Areas → where price returns (fair value) LVN (Low Volume Nodes) → where price moves fast LVNs are most effective when located near the edges of VAH/VAL Strategy 1: Trend Model (Momentum Setup) When to use: Trending market (not balanced) Strong moves Higher highs / lower lows Breakout continuation How it works:
VR Grid Mt5
Vladimir Pastushak
3 (9)
L'indicatore Griglia VR è progettato per creare una griglia grafica con impostazioni definite dall'utente. A differenza della griglia standard , VR Grid viene utilizzata per costruire livelli circolari . A seconda della scelta dell'utente, il passaggio tra i livelli rotondi può essere arbitrario. Inoltre, a differenza di altri indicatori e utilità, VR Grid mantiene la posizione della griglia anche quando cambia l'intervallo di tempo o si riavvia il terminale. È possibile ottenere impostazioni, f
FREE
PROP VOLUME PROFILE ==================== Cumulative Volume Profile for MetaTrader 5 -------------------------------------------- Prop Volume Profile shows you where price has spent the most time and volume over the selected period - directly on your chart, in a clean vertical profile on the right edge. One glance tells you the "fair value" zone, the strongest price level, and whether the current price is stretched far above or below where the market actually trades. HIGHLIGHTS ---------- -
FREE
Symbol: EURUSD Timeframe: 30 minutes (M30) For other symbols or timeframes, adjust the settings to match the market. Volume Profile POC Breakout builds a volume profile from recent candles, finds the Point of Control (POC) and marks clean breakouts of that level. Each breakout is shown as a complete trade plan with entry, stop loss and three take profit levels, filtered by the higher timeframe trend and rated by a quality score. The indicator does not open trades. It is a visual and analysis to
Smart Candle Analyzer pro
Ahmed Bin Mansour Bin Saad Al Alwan
Smart Candle Analyzer Pro Advanced Candlestick Pattern Recognition, Liquidity Analysis & Signal Quality Evaluation for MetaTrader 5 Smart Candle Analyzer Pro is a technical analysis indicator developed for MetaTrader 5 (MT5). It combines Japanese candlestick pattern recognition, price action analysis, liquidity sweep detection, relative tick-volume activity, and signal quality evaluation into a single indicator. The indicator helps traders identify potential bullish and bearish trading opportuni
MarketPredict Pro – Analisi di mercato avanzata a più livelli   Come funziona MarketPredict Pro combina sei livelli analitici indipendenti per generare previsioni altamente accurate sulla prossima candela.   Analisi a 6 livelli Buyers/Sellers Pressure   – misura la forza di compratori e venditori Trend Strength   – calcolo del trend tramite SMA a 20 periodi Volatility   – modello di volatilità simile all’ATR (14 periodi) Market Pressure   – pressione cumulativa delle ultime 5 candele
Smart Volume Zone
Gleidson Duca De Aguiar
Launch price: 30 USD - price will increase after the first purchases, so early buyers lock in this rate. Smart Volume Zone marks the trading candle with the highest tick volume within the last N trading days (configurable, default 10) and highlights it directly in the terminal's native Volumes panel, with no separate window and no third-party dependency. How it works: the indicator scans every M1 candle within each of the last N days, finds the single highest-volume candle per day, then compar
Metis Hurst Regime
Victor Gomez Sanchez
Metis Hurst Regime — is the market trending, mean-reverting or just random? This indicator estimates the Hurst exponent of the recent price series — a statistical measure of memory. It tells you whether moves have tended to continue (trending), to reverse (mean-reverting) or to show no memory at all (random walk), and how much confidence that reading deserves. Knowing the current regime helps you choose the right kind of strategy: trend-following logic suffers in mean-reverting conditions and vi
FREE
Gli utenti di questo prodotto hanno anche acquistato
Trend Sniper X
Sarvarbek Abduvoxobov
4.87 (46)
Trend Sniper X è un indicatore trend-following multi-timeframe per MetaTrader 5 che aiuta i trader a identificare la direzione del trend e i potenziali punti di inversione con chiarezza e precisione. per MT4: https://www.mql5.com/en/market/product/193245 Informazioni sul prezzo: Il prezzo attuale è promozionale ed è soggetto a modifiche con il rilascio di futuri aggiornamenti e nuove funzionalità. Offerta Bonus: Per ricevere GRATIS l'Auto-Trade Assistant EA per questo indicatore, invia un messa
Entry Points Pro vi mostra dove entrare, dove mettere lo stop e con quale lotto operare — prima di piazzare l'ordine. PREZZO Ora 199 USD: 4 copie a questo prezzo, poi 249 USD. Il prezzo finale è di 349 USD. Guadagno facendo trading sui mercati e lo dimostro, quindi non ho bisogno di vendere questo indicatore a tutti. È uno strumento per trader che ragionano con la propria testa, non un pulsante magico. Nessuna rottura, nessun trade. Una freccia grigia è un segnale annullato: il prezzo non ha ro
Gann Made Easy è un sistema di trading Forex professionale e facile da usare che si basa sui migliori principi del trading utilizzando la teoria di mr. WD Gann. L'indicatore fornisce segnali ACQUISTA e VENDI accurati, inclusi i livelli di Stop Loss e Take Profit. Puoi fare trading anche in movimento utilizzando le notifiche PUSH. CONTATTAMI DOPO L'ACQUISTO PER RICEVERE GRATUITAMENTE LE ISTRUZIONI DI TRADING E OTTIMI INDICATORI EXTRA! Probabilmente hai già sentito parlare molte volte dei metodi d
Ultra Indicator
Ihor Otkydach
5 (1)
ULTRA è un indicatore tecnico che funziona secondo un approccio “tutto in uno”: analizza autonomamente il mercato, genera segnali di trading, visualizza i livelli per l’impostazione degli ordini stop-loss e suggerisce quando chiudere le operazioni per realizzare profitti o ridurre al minimo le perdite. In altre parole, non importa se non sai come analizzare il mercato, determinare i livelli — dove impostare lo stop-loss — o se hai difficoltà con la gestione del capitale. ULTRA farà tutto questo
Currency Strength Wizard   è un indicatore molto potente che ti fornisce una soluzione all-in-one per un trading di successo. L'indicatore calcola la potenza di questa o quella coppia forex utilizzando i dati di tutte le valute su più intervalli di tempo. Questi dati sono rappresentati in una forma di indice di valuta facile da usare e linee elettriche di valuta che puoi utilizzare per vedere il potere di questa o quella valuta. Tutto ciò di cui hai bisogno è collegare l'indicatore al grafico ch
Indicatore multi-valuta di forza e momentum MT5 Dynamic Forex28 Navigator è l'evoluzione dei nostri indicatori popolari da lunga data, che riunisce la potenza di cinque in uno: Advanced Currency Strength28 Indicator (700 recensioni) Advanced Currency IMPULSE with ALERT (530 recensioni) Currency Strength EXOTICS GOLD Impulse with Alert CS28 Combo Signals (bonus attuale) Non serve acquistare quattro indicatori e impilarli sui grafici. Tutto è riunito in un solo indicatore potente: la forza delle 2
M1 Sniper MT5
Oleg Rodin
5 (7)
M1 SNIPER   è un sistema di indicatori di trading facile da usare. Si tratta di un indicatore a freccia progettato per l'intervallo temporale M1. L'indicatore può essere utilizzato come sistema autonomo per lo scalping sull'intervallo temporale M1 e come parte del tuo sistema di trading esistente. Sebbene questo sistema di trading sia stato progettato specificamente per il trading sull'intervallo temporale M1, può comunque essere utilizzato anche con altri intervalli temporali. Inizialmente ho p
Azimuth Pro
Ottaviano De Cicco
5 (7)
Azimuth Pro V2: Synthetic Fractal Structure and Confirmed Entries for MT5 Overview Azimuth Pro is a multi-level swing structure indicator by Merkava Labs . Four nested swing layers, swing-anchored VWAP, ABC pattern detection, three-timeframe structural filtering, and closed-bar confirmed entries — one chart, one workflow from micro-swings to macro-cycles. This is not a blind signal product. It is a structure-first workflow for traders who care about location, context, and timing. 1. What Change
Boba Analysis Suite
Trade Ready Solutions LLC
5 (2)
Boba Analysis Suite Boba Analysis Suite è un indicatore di analisi per MetaTrader 5. Riunisce la struttura del mercato, le zone di prezzo rilevanti e il contesto generale del mercato in un’unica visualizzazione del grafico. Sviluppato sulla base dell’esperienza pratica come trader e formatore di trading, supporta un processo di analisi strutturato: valutare la direzione del mercato, individuare livelli importanti e analizzare congiuntamente più intervalli temporali. Analisi nel contesto del merc
Naked Forex Tweezer Pro Indicator Tweezer Pro Indicator is a pattern recognition indicator for Forex, Stocks, Indices, Futures, Commodities and Cryptos. The standard Tweezer is a two bar pattern. Our enhanced version is a multi-bar pattern. We filter the patterns for you so that you only get the     best and most effective patterns   and ignore the noise. The Tweezer pattern is a simple and effective pattern to trade. The strategy that comes with the Tweezer is based on price action. The Twe
Fx Levels Premium Indicator Support and Resistance are important concepts in trading. Fx Levels Premium was created to easily draw important levels of support and resistance for the active trader. The indicator will give you all important levels (support/resistance) to watch for a wide range of assets. Trading without these levels on your chart is like driving a car for a long journey without a roadmap. You would be confused and blind. Support and resistance levels should be used as guideline
OrderFlux – Indicatore Orderflow Footprint Chart, Volume Profile e Market Profile per MetaTrader 5 OrderFlux è un indicatore Footprint di Order Flow per MetaTrader 5 che permette di osservare direttamente cosa accade all’interno di ogni candela. Mostra il volume scambiato a ogni livello di prezzo, distinguendo gli acquirenti aggressivi dai venditori aggressivi. A partire dai tick, costruisce in tempo reale un grafico Footprint completo con delta, squilibri, assorbimento, Volume Profile, Market P
Meridian Pro
Ottaviano De Cicco
4 (3)
Meridian Pro 2.00: Professional Multi-Timeframe Trend Matrix for MT5 Meridian Pro 2.00 is a professional adaptive trend matrix for MetaTrader 5. It combines the original Meridian trend engine, a clean chart ribbon, closed-bar signal arrows, an 8-timeframe dashboard, Fuel momentum, weighted consensus, synthetic HTF processing and chart-native higher-timeframe context lines. The goal is simple: read current trend, multi-timeframe structure, strength, momentum and EA-ready state from one discipline
PZ Swing Trading MT5
PZ TRADING SLU
5 (5)
Protect against whipsaws: revolutionize your swing trading approach Swing Trading is the first indicator designed to detect swings in the direction of the trend and possible reversal swings. It uses the baseline swing trading approach, widely described in trading literature. The indicator studies several price and time vectors to track the aggregate trend direction and detects situations in which the market is oversold or overbought and ready to correct. [ Installation Guide | Update Guide | Tro
Apollo SR Master è un indicatore di Supporto/Resistenza con caratteristiche speciali che rendono il trading con le zone di Supporto/Resistenza più semplice e affidabile. L'indicatore calcola le zone di Supporto/Resistenza in tempo reale senza alcun ritardo, rilevando i massimi e i minimi dei prezzi locali. Quindi, per confermare la nuova area SR formata, l'indicatore mostra un segnale speciale che segnala che la zona SR può essere presa in considerazione e utilizzata come un vero e proprio segna
Neuro Poseidon MT5
Daria Rezueva
4.68 (53)
Neuro Poseidon is a new indicator by Daria Rezueva. It combines precise trading signals with adaptive TP/SL levels - creating best possible trades as a result! Message me and get  Neuro Poseidon Assistant  as a gift to automize your trading process! What makes it stand out? 1. Proven profitability on all assets and timeframes 2. Only confirmed BUY and SELL signals present on the chart 3. Adaptive TP & SL levels generated by the software for each trade 4. Easy to understand - suitable for al
Trend Lines PRO MT5
Roman Podpora
5 (1)
LINEE DI TENDENZA PRO       Aiuta a capire dove il mercato sta realmente cambiando direzione. L'indicatore mostra reali inversioni di tendenza e punti in cui i principali attori rientrano. Vedi  Linee BOS   Cambiamenti di tendenza e livelli chiave su timeframe più ampi, senza impostazioni complesse o rumore inutile. I segnali non vengono ridisegnati e rimangono sul grafico dopo la chiusura della barra. VERSIONE MT 4     -      Svela il suo massimo potenziale se abbinato all'indicatore   RFI LEVE
Bill Williams Advanced
Siarhei Vashchylka
5 (11)
Bill Williams Advanced is designed for automatic chart analysis using Bill Williams' "Profitunity" system. The indicator analyzes four timeframes at once. Manual (Be sure to read before purchasing) Advantages 1. Analyzes the chart using Bill Williams' "Profitunity" system. Signals are displayed in a table in the corner of the screen and on the price chart. 2. Finds all known AO and AC signals, as well as zone signals. Equipped with a trend filter based on the Alligator. 3. Finds "Divergence Bar
TPA True Price Action indicator reveals the true price action of the market makers through 100% non-repainting signals strictly at the close of a candle! TPA shows entries and re-entries, every time the bulls are definitely stronger than the bears and vice versa. Not to confuse with red/green candles. The shift of power gets confirmed at the earliest stage and is ONE exit strategy of several. There are available now two free parts of the TPA User Guide for our customers. The first "The Basics"
ARICoins
Temirlan Kdyrkhan
ARICoin is a powerful trading companion designed to generate high-probability entry signals with dynamic TP/SL/DP levels based on volatility. Built-in performance tracking shows win/loss stats, PP1/PP2 hits, and success rates all updated live. Key Features: Buy/Sell signals with adaptive volatility bands Real-time TP/SL/DP levels based on ATR Built-in MA Filter with optional ATR/StdDev volatility Performance stats panel (Success, Profit/Loss, PP1/PP2) Alerts via popup, sound, push, or email Cust
Precision Spike Detector
Francisco Mandomo Simbine
5 (2)
Precision Spike Detector V3 – Institutional-Grade AI Trading System Attention: The price increases by US$50 for every 10 purchases.  Final price: US$599 Precision Spike Detector V3   is a   state-of-the-art, institutional-grade market analysis system   for   MetaTrader 5 , designed to detect   high-probability market movements   in synthetic indices such as   Boom, Crash, GainX, and PainX . After purchase, send me a private message to receive the optimized configuration files,  the installation
Superhero
Ihor Otkydach
5 (3)
L'indicatore SUPERHERO è un sistema di trading multivaluta progettato secondo un approccio "all-inclusive". L'indicatore analizza autonomamente il mercato e fornisce segnali su quando aprire e chiudere le posizioni. Utilizza ordini Stop Loss e Take Profit. Il rapporto R:R è 1:1. Questo sistema è in grado di inviare notifiche push sul tuo smartphone, consentendoti di effettuare operazioni "in mobilità" senza dover rimanere incollato al PC. È perfetto per le società di trading proprietario. UN OMA
Apex Patterns PRO Acquista l'indicatore - Ottieni GRATUITAMENTE l'Expert Advisor basato su di esso. Intelligenza auto-ottimizzante per pattern grafici e breakout Gli scanner di pattern tradizionali si basano su input fissi, registrando spesso prestazioni inferiori quando la volatilità e le strutture del mercato cambiano. Apex Patterns PRO è progettato per adattarsi alle mutevoli condizioni di mercato combinando il riconoscimento dei pattern grafici strutturali, il filtraggio del momentum e l'au
Divergence Bomber
Ihor Otkydach
4.89 (94)
Ogni acquirente dell’indicatore riceverà inoltre gratuitamente: L’utilità esclusiva “Bomber Utility”, che gestisce automaticamente ogni operazione, imposta i livelli di Stop Loss e Take Profit e chiude le posizioni secondo le regole della strategia I file di configurazione (set file) per adattare l’indicatore a diversi asset I set file per configurare il Bomber Utility in tre modalità: “Rischio Minimo”, “Rischio Bilanciato” e “Strategia di Attesa” Una guida video passo-passo per installare, con
The Oracle Pro
Ottaviano De Cicco
5 (1)
The Oracle Pro: Synthetic Multi-Timeframe Bias Engine for MT5 The Oracle Pro is a premium multi-timeframe bias engine for MetaTrader 5, built for demanding and professional traders. It answers one question with discipline: what is the directional bias on each timeframe right now, how strong is it, and how much do the timeframes agree? Everything is computed on closed bars only - no repainting. The Oracle Pro is a multi-factor consensus system. It combines proprietary indicators and optimized alg
ScalpPoint
Temirlan Kdyrkhan
ScalpPoint is a powerful trading companion designed to generate high-probability entry signals with dynamic TP/SL/DP levels based on volatility. Built-in performance tracking shows win/loss stats, PP1/PP2 hits, and success rates — all updated live. Key Features: Buy/Sell signals with adaptive volatility bands Real-time TP/SL/DP levels based on ATR Built-in MA Filter with optional ATR/StdDev volatility Performance stats panel (Success, Profit/Loss, PP1/PP2) Alerts via popup, sound, push, or emai
Scalper Vault è un sistema di trading potente e completo, progettato per i trader che desiderano ottenere risultati costanti nel trading intraday. Questo indicatore ad alta precisione funge da sistema di trading autonomo, offrendo analisi di livello istituzionale sia per il mercato Forex che per le Opzioni Binarie. CONTATTAMI DOPO L'ACQUISTO PER RICEVERE I MIEI CONSIGLI DI TRADING E UN FANTASTICO BONUS! Eliminando le congetture e le complesse analisi manuali, Scalper Vault ti permette di concen
AriFocus
Temirlan Kdyrkhan
AriFocus - Non-Repainting Buy/Sell Signals AriFocus - one clear signal. AriFocus marks buy and sell signals directly on the chart and suggests a stop-loss level for each one. Every signal is confirmed on bar close and never repaints. - Buy/sell arrows, confirmed on bar close - Suggested stop-loss level for every signal - Trend band and candle coloring to show direction at a glance - 10 ready-made presets, or your own settings (14 calculation methods) - Pop-up, push and email alerts with entr
RelicusRoad Pro MT5
Relicus LLC
4.96 (25)
Basta andare a intuito nei tuoi trade. Sai quando entrare, dove uscire e da che parte va il mercato, tutto su un solo grafico. RelicusRoad Pro riunisce quasi venti strumenti in un unico indicatore, e attivi quelli che si adattano al tuo modo di operare. Ingressi chiari. Uscite chiare. Un piano su ogni grafico. Ti suona familiare? Compri, e un minuto dopo il prezzo ti va contro. Chiudi troppo presto, poi guardi il movimento proseguire senza di te. Cinque indicatori sul grafico, cinque risposte di
ARIPoint
Temirlan Kdyrkhan
1 (4)
ARIPoint is a powerful trading companion designed to generate high-probability entry signals with dynamic TP/SL/DP levels based on volatility. Built-in performance tracking shows win/loss stats, PP1/PP2 hits, and success rates all updated live. Key Features: Buy/Sell signals with adaptive volatility bands Real-time TP/SL/DP levels based on ATR Built-in MA Filter with optional ATR/StdDev volatility Performance stats panel (Success, Profit/Loss, PP1/PP2) Alerts via popup, sound, push, or email Cu
Altri dall’autore
DailyHighLow
Komi Eyram F Kahoho
5 (1)
Please remember to rate the indicator to help me with visibility. The DailyHighLow Indicator for MetaTrader 4 (MT4) provides a sophisticated tool for tracking daily price movements. Designed for traders who need clear, actionable insights into market highs and lows, this indicator automatically plots trend lines based on the highest and lowest prices over a customizable number of days. Key Features: Trend Lines Customization: Define colors, line styles, and widths for both broken and unbroken
FREE
DailyHighLow MT5
Komi Eyram F Kahoho
Please remember to rate the indicator to help me with visibility. The DailyHighLow Indicator for MetaTrader 5 (MT5) provides a sophisticated tool for tracking daily price movements. Designed for traders who need clear, actionable insights into market highs and lows, this indicator automatically plots trend lines based on the highest and lowest prices over a customizable number of days. Key Features: Trend Lines Customization:   Define colors, line styles, and widths for both broken and unbroken
FREE
Before diving into the features of this indicator, please rate this product, leave a comment to share your experience, and subscribe to my page to stay updated on the latest releases and tools. Your support is valuable and helps me continuously improve my creations! Description: The TradingSessionVisualizer is a powerful MetaTrader 4 indicator designed to provide a clear and customizable visualization of major trading sessions on your charts. This tool allows you to easily distinguish between As
FREE
FVG Analyzer
Komi Eyram F Kahoho
4 (1)
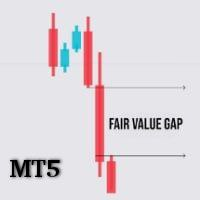
FVG Analyzer – The Ultimate Tool for Precise Fair Value Gap (FVG) Detection FVG Analyzer is a powerful and fully customizable indicator built for serious traders who leverage Fair Value Gaps (FVG) in their strategies. With smart detection and clean visuals, this tool allows you to quickly identify market inefficiencies—areas where price is likely to return before continuing in its trend. Key Features: Automatic Detection of Fair Value Gaps (bullish and bearish) based on candlestick patterns. Sel
OrderBlock Analyzer
Komi Eyram F Kahoho
The OrderBlock Analyzer is a powerful custom MetaTrader 4 (MT4) indicator designed to detect and highlight critical Order Blocks on your price charts, helping you identify potential reversal points and key areas of market interest. Key Features: Order Block Detection: Automatically identifies bullish and bearish Order Blocks, marking areas where institutional traders are likely to enter or exit positions. Customizable Display: Choose your preferred colors and styles for bullish and bearish Order
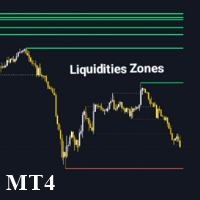
The Liquidity Zone Detector is an advanced technical indicator designed to identify and highlight key liquidity zones in the market using the ZigZag indicator. This tool pinpoints price levels where significant liquidity is likely present by drawing trendlines at the highs and lows detected by the ZigZag. The Liquidity Zone Detector assists traders in spotting potential reversal or trend continuation areas based on liquidity accumulation or release. Key Features: Automatic Liquidity Zone Identif
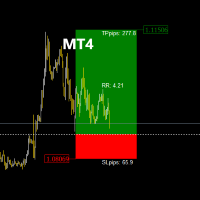
The RR_TradeManager Visualizer is a trade management indicator designed for traders who want to easily visualize their Take Profit (TP) and Stop Loss (SL) levels on a chart. This initial version provides a simple graphical representation that displays SL and TP zones as well as the entry price. Please note that this current version focuses solely on the graphical display of SL and TP zones as figures on the chart. Current Version Features: SL and TP Zones Display: Clear visualization of stop los
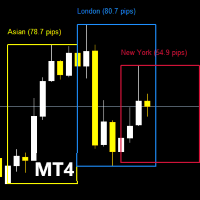
Before diving into the features of this indicator, please remember to rate this product, leave a comment to share your experience, and subscribe to my page to stay informed about the latest updates and new tools. Your support is invaluable and helps me constantly improve my creations! Description: TradingSessionPipsVisualizer - The Professional Tool for Mastering Trading Sessions Visualize Forex sessions at a glance and optimize your trading timing! The TradingSessionPipsVisualizer is a premium
FVG Analyzer MT5
Komi Eyram F Kahoho
FVG Analyzer – The Ultimate Tool for Precise Fair Value Gap (FVG) Detection FVG Analyzer is a powerful and fully customizable indicator built for serious traders who leverage Fair Value Gaps (FVG) in their strategies. With smart detection and clean visuals, this tool allows you to quickly identify market inefficiencies—areas where price is likely to return before continuing in its trend. Key Features: Automatic Detection of Fair Value Gaps (bullish and bearish) based on candlestick patterns. Se
Before diving into the features of this indicator, please remember to rate this product, leave a comment to share your experience, and subscribe to my page to stay informed about the latest updates and new tools. Your support is invaluable and helps me constantly improve my creations! Description: TradingSessionPipsVisualizer - The Professional Tool for Mastering Trading Sessions Visualize Forex sessions at a glance and optimize your trading timing! The   TradingSessionPipsVisualizer   is a prem
The   TradeManagerRR Visualizer MT5   is a trade management indicator designed for traders who want to easily visualize their Take Profit (TP) and Stop Loss (SL) levels on a chart. This initial version provides a simple graphical representation that displays SL and TP zones as well as the entry price. Please note that this current version focuses solely on the graphical display of SL and TP zones as figures on the chart. Current Version Features: SL and TP Zones Display:   Clear visualization of
OrderBlock Analyzer MT5
Komi Eyram F Kahoho
5 (2)
The OrderBlock Analyzer is a powerful custom MetaTrader 5 (MT5) indicator designed to detect and highlight critical Order Blocks on your price charts, helping you identify potential reversal points and key areas of market interest. Key Features: Order Block Detection:   Automatically identifies bullish and bearish Order Blocks, marking areas where institutional traders are likely to enter or exit positions. Customizable Display:   Choose your preferred colors and styles for bullish and bearish O
Liquidity Zone Detector MT5
Komi Eyram F Kahoho
5 (1)
The Liquidity Zone Detector is an advanced technical indicator designed to identify and highlight key liquidity zones in the market using the ZigZag indicator. This tool pinpoints price levels where significant liquidity is likely present by drawing trendlines at the highs and lows detected by the ZigZag. The Liquidity Zone Detector assists traders in spotting potential reversal or trend continuation areas based on liquidity accumulation or release. Key Features: Automatic Liquidity Zone Identif
Filtro:
Nessuna recensione
Rispondi alla recensione