Tudas Divergence and Whales
- Indicatori
-
Yevhen Hladchenko
 I build trading tools for MetaTrader 5 and trade with them myself, live.
Every weekday at 8:20 New York time I stream gold (XAUUSD) on YouTube with my own indicator, TUDAS by ARGUS: every entry in real time, no edits. Channel: youtube.com/@tudasgold
What I do: - Versione: 1.0
Tudas Divergence and Whales shows two modules of the TUDAS indicator and nothing else. It is a reading aid for the chart, not a trading signal.
1. Divergence circles (on the price chart)
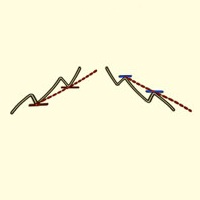
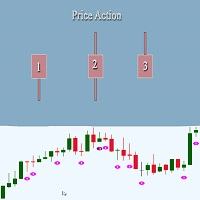
When price makes a new low or a new high and the oscillators do not follow it, that is a divergence. Tudas Divergence and Whales marks it with a circle with a digit:
- a green circle under the candle: price made a new low, the oscillators did not (bullish divergence);
- a red circle over the candle: price made a new high, the oscillators did not (bearish divergence);
- the digit is how many of 11 oscillators agree: RSI, MACD, Stochastic, Awesome Oscillator, CCI, Momentum, OBV, ADX, MFI, ROC and Williams %R. A circle appears from 3 of 11;
- a circle with a filled disc behind the digit means that the money-flow oscillators (OBV, MFI) agree as well: a stronger divergence;
- a circle appears after the swing is confirmed. A mark found on loaded history stands on the extreme bar itself and is shown only if the price then moved at least 1.5 ATR within 10 bars; so the history shows fewer marks than a live chart does. This is how the module works, and it is the same in the full version.
2. Whales (in the indicator window)
A purple bar is a bar with abnormally high volume (volume z-score of 1.8 or more over 20 bars). The bar fades out over about 12 bars, like a hill. Labels at the bar:
- I up / I down - impulse: a wide candle on that volume, the move continues in the arrow direction;
- R up / R down - reversal: a narrow candle on that volume that closes at its edge (absorption at a low, distribution at a high);
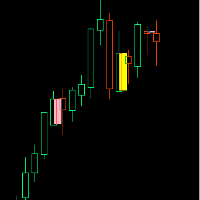
- a yellow / orange dot at the candle extreme: three whale events in a row in the same direction (readiness).
Notes
- Works on any symbol and any timeframe. Volume is the broker's tick volume; nothing is read from outside the terminal.
- The indicator does not trade, does not send alerts and does not use files, DLL or the internet.
- Inputs: show the divergence circles, show the whales, colour theme, the I / R labels, the readiness dot.
- Both modules are the modules of the full TUDAS indicator, with the same calculation. The full version, TUDAS Foresight, is sold as Argus Indicator. It puts fifteen modules on one chart - EMA ribbon, price channel, support and resistance zones, candle signals, money flow, trend ribbon, impulse, overheat scale, Heikin Ashi, volume profile and more - with 92 strategies tested on XAUUSD with entry, stop and target, a time machine that keeps the strategies in form, and a projection of the next five M15 Heikin Ashi candles. Tudas Divergence and Whales does not include these.
- Past behaviour of an indicator does not predict the future. Trading is risky; use the marks together with your own analysis and risk management.