RSI Patterns

Overview

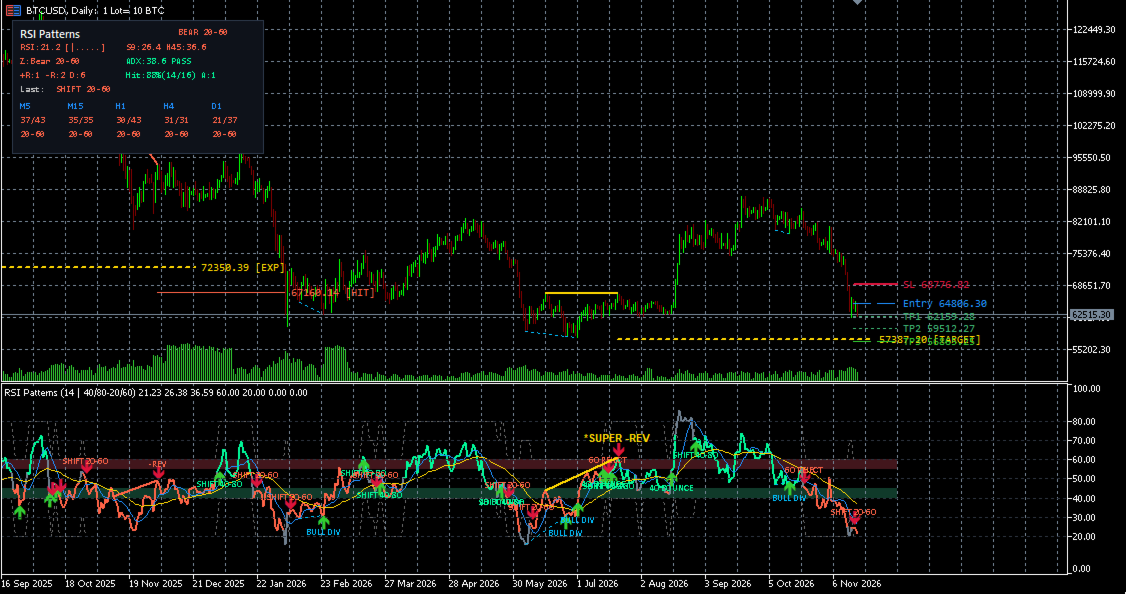
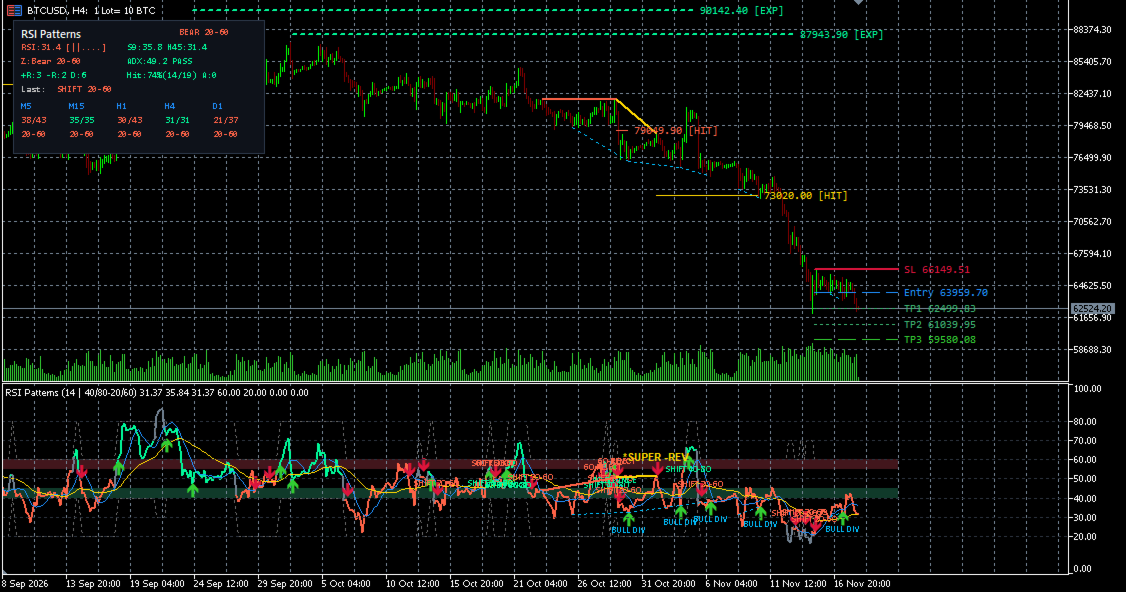
RSI Patterns is a technical analysis indicator for MetaTrader 5 designed to evaluate momentum structure, dynamic oscillator regimes, and recurring chart-oscillator patterns using the Relative Strength Index (RSI) alongside price action.

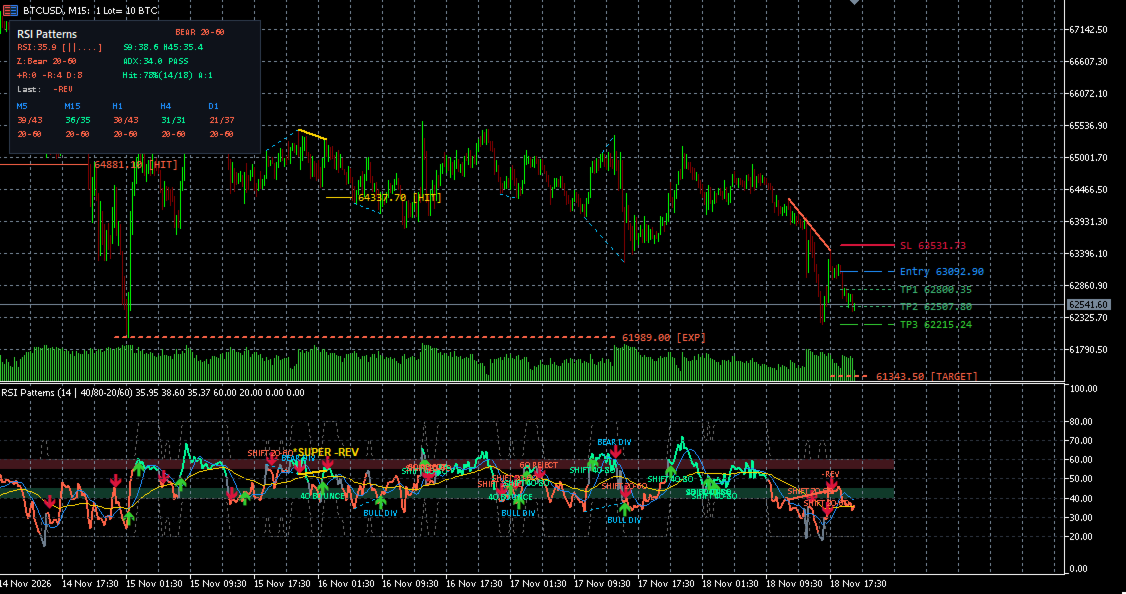
Instead of relying solely on fixed 70/30 thresholds, the indicator combines a regime-aware RSI oscillator, fast and slow momentum moving averages (Simple Moving Average (SMA) and Weighted Moving Average (WMA)), swing-based pattern recognition, optional Average Directional Index (ADX) filtering, projected price objectives, Average True Range (ATR) reference levels, and a compact Heads-Up Display (HUD) with an integrated Multi-Timeframe (MTF) scanner.

Key Features

  • Regime-Colored RSI & Dynamic Bounds: Colors the RSI line according to the active bullish, bearish, or neutral regime and displays dynamic upper/lower operating bounds on the sub-window.
  • Momentum Moving Averages on RSI: Plots a fast Simple Moving Average (SMA) and a slower Weighted Moving Average (WMA) directly on the RSI to help assess short-term and baseline oscillator momentum.
  • Swing Pattern Detection (Non-Repainting Confirmation): Signal arrows, pattern labels, alerts, and EA buffer outputs are generated strictly at the close of the confirmation bar ( Shift 1 ), once the required right-side swing confirmation bars have closed. Confirmed signals never disappear or shift retroactively. Connecting lines trace the two underlying swing pivots that formed the pattern, while the signal marker and projected target start directly on the confirmation bar.
  • Projected Price Targets & Historical Hit Rate: Draws projected price objective levels on the main chart for qualifying reversal setups and tracks how many resolved targets were reached versus expired.
  • Risk Reference Levels: Optionally plots reference entry, Stop Loss (SL), and Take Profit (TP) lines derived from the Average True Range (ATR) for the most recent signal.
  • Compact HUD & MTF Scanner: Summarizes current RSI readings, active zone, pattern counts, target hit rate, and live status across M5 (5-minute), M15 (15-minute), H1 (1-hour), H4 (4-hour), and D1 (Daily) timeframes.
  • Configurable Alerts & EA Buffers: Supports MetaTrader 5 popups, sound alerts, push notifications, emails, and exposes calculation buffers for integration with an Expert Advisor (EA).

Detected Patterns & Signals

Below are the labels displayed on the sub-window and HUD, along with the full meaning of each abbreviation:

  • Positive Reversal ( +REV ): A bullish continuation pattern detected when price forms a higher swing low while the Relative Strength Index (RSI) forms a lower swing low. Projects an upward measured price target on the main chart.
  • Negative Reversal ( -REV ): A bearish continuation pattern detected when price forms a lower swing high while the RSI forms a higher swing high. Projects a downward measured price target on the main chart.
  • Super Positive Reversal ( *SUPER +REV ): A higher-confluence Positive Reversal ( +REV ) that develops shortly after a Bearish Divergence ( BEAR DIV ) near the lower bullish support zone.
  • Super Negative Reversal ( *SUPER -REV ): A higher-confluence Negative Reversal ( -REV ) that develops shortly after a Bullish Divergence ( BULL DIV ) near the upper bearish resistance zone.
  • Classic Bullish Divergence ( BULL DIV ): Detected when price makes a lower low while the RSI makes a higher low, highlighting potential downward exhaustion or counter-trend reaction.
  • Classic Bearish Divergence ( BEAR DIV ): Detected when price makes a higher high while the RSI makes a lower high, highlighting potential upward exhaustion or pullback risk.
  • Bullish Regime Shift ( SHIFT 40-80 ): Signals that the oscillator and trend filter have transitioned into the upper bullish operating range.
  • Bearish Regime Shift ( SHIFT 20-60 ): Signals that the oscillator and trend filter have transitioned into the lower bearish operating range.
  • Bullish Support Bounce ( 40 BOUNCE ): Signals an upward momentum reaction when the RSI rebounds from the bullish support zone while price remains aligned with the trend reference.
  • Bearish Resistance Rejection ( 60 REJECT ): Signals a downward momentum reaction when the RSI turns down from the bearish resistance zone while price remains aligned with the downtrend reference.

HUD & MTF Scanner Abbreviations

  • OB ( Overbought ): Readings above the upper extreme threshold.
  • OS ( Oversold ): Readings below the lower extreme threshold.
  • 40SUP ( 40 Support ): Price and RSI situated near the lower bullish support area.
  • 60RES ( 60 Resistance ): Price and RSI situated near the upper bearish resistance area.
  • NEUT ( Neutral ): Transitional or range-bound readings between regimes.

Input Parameters

1. RSI Engine & Momentum Moving Averages

  • RSI Period: Lookback period used for the internal RSI calculations.
  • RSI Applied Price: Price field (such as Close, Median, or Typical) fed into the RSI calculation.
  • Fast RSI SMA Period: Lookback period for the fast Simple Moving Average (SMA) plotted over the RSI.
  • Slow RSI WMA Period: Lookback period for the slower Weighted Moving Average (WMA) plotted over the RSI.
  • Max History Bars to Analyze: Maximum number of recent historical bars scanned for pattern detection and visual objects.

2. Dynamic Regime Bands (40/80 & 20/60)

  • Bull Regime Low: Lower boundary used to define the bullish RSI operating zone.
  • Bull Regime High: Upper boundary used to define the bullish RSI operating zone.
  • Bear Regime Low: Lower boundary used to define the bearish RSI operating zone.
  • Bear Regime High: Upper boundary used to define the bearish RSI operating zone.
  • Regime Trend SMA Period: Lookback period for the price Simple Moving Average (SMA) used as the regime trend reference.
  • Regime Confirmation Bars: Number of consecutive bars required before confirming a regime change.
  • Enable ADX Sideways Filter: Enables or disables the Average Directional Index (ADX) filter to suppress regime-shift signals during low-strength markets.
  • ADX Period: Lookback period used for the internal ADX calculation.
  • Minimum ADX Strength: Minimum ADX value required when the sideways filter is active.
  • Detect Support/Resistance Zone Bounces: Enables or disables detection of 40 BOUNCE and 60 REJECT momentum reactions.

3. Reversals, Divergences & Price Targets

  • Swing Pivot Length: Number of bars to the left and right used to confirm price swing highs and lows.
  • Max Bars Between Swings: Maximum bar distance allowed between two consecutive swings forming a pattern.
  • Signal Direction Filter: Restricts signal output to both directions, bullish patterns only, or bearish patterns only.
  • Mid-Range Swings Only: When enabled, filters out reversal swings formed inside extreme Overbought (OB) or Oversold (OS) territory.
  • Overbought Reference Level: Upper threshold used for visual reference and mid-range filtering.
  • Oversold Reference Level: Lower threshold used for visual reference and mid-range filtering.
  • Enable Macro Trend SMA Filter: Requires reversal patterns to align with a longer-term Simple Moving Average (SMA) trend filter.
  • Macro Trend SMA Period: Lookback period for the macro trend SMA filter.
  • Detect Divergences & Super-Setups: Enables or disables classic divergence detection and combined super-setup labeling.
  • Super-Setup Lookback Window (Bars): Maximum number of bars after a divergence in which a subsequent reversal can qualify as a super-setup.
  • Show Measured Price Targets: Displays projected price objective lines on the main chart for qualifying reversal signals.
  • Target Expiration (Bars): Maximum number of bars an unreached price target continues extending before expiring.

4. Risk Levels & Chart Visuals

  • Show Pattern Lines on Main Chart: Draws connecting lines between pattern swing points on the main price chart.
  • Show Pattern Lines in RSI Sub-Window: Draws connecting lines between pattern swing points inside the RSI sub-window.
  • Show Pattern Labels: Displays pattern text labels inside the RSI sub-window.
  • Highlight Key Support/Resistance Zones: Shades the internal bullish support and bearish resistance bands in the RSI sub-window.
  • Max Recent Patterns Drawn: Limits the number of historical pattern drawings kept on the chart to maintain visual clarity.
  • Show Entry / SL / TP Levels (Last Signal): Plots reference Entry, Stop Loss (SL), and three Take Profit (TP1, TP2, TP3) lines for the most recent signal.
  • ATR Period for Risk Levels: Lookback period used for the Average True Range (ATR) volatility reference.
  • Stop Loss ATR Multiplier: Distance multiplier applied to the ATR to place the reference Stop Loss line.
  • Take Profit 1 ATR Multiplier: Distance multiplier applied to the ATR for the TP1 reference line.
  • Take Profit 2 ATR Multiplier: Distance multiplier applied to the ATR for the TP2 reference line.
  • Take Profit 3 ATR Multiplier: Distance multiplier applied to the ATR for the TP3 reference line.

5. HUD Panel & Multi-Timeframe Scanner

  • Show HUD Panel: Shows or hides the compact summary Heads-Up Display (HUD) panel.
  • Show Multi-Timeframe Scanner (M5-D1): Shows or hides the Multi-Timeframe (MTF) scanner row for M5, M15, H1, H4, and D1 inside the HUD.
  • HUD Display Window: Selects whether the HUD is drawn on the main chart or inside the RSI sub-window.
  • HUD Corner Position: Selects the chart corner where the HUD panel is anchored (defaults to Top Left).
  • Pattern Count Lookback Window (Bars): Lookback window in bars used to count recent patterns displayed in the HUD.

6. Colors & Styling

  • Bullish Color: Color used for bullish RSI segments, lines, and labels.
  • Bearish Color: Color used for bearish RSI segments, lines, and labels.
  • Neutral Color: Color used for neutral or transitional states.
  • Super-Setup Color: Highlight color for higher-confluence super-setup patterns.
  • Divergence Color: Color used for classic divergence lines and labels.
  • HUD Background Color: Background fill color of the HUD panel.
  • HUD Border Color: Border color of the HUD panel.

7. Alerts

  • Alert on Positive / Negative Reversals: Triggers alerts when +REV or -REV patterns confirm on bar close.
  • Alert on Super-Setups: Triggers alerts when *SUPER +REV or *SUPER -REV patterns confirm on bar close.
  • Alert on Regime Shifts: Triggers alerts when a new bullish or bearish regime shift is confirmed.
  • Alert on Zone Bounces / Rejections: Triggers alerts on 40 BOUNCE or 60 REJECT signals.
  • Alert on Price Target Reached: Triggers alerts when price reaches an active measured target.
  • Enable MT5 Popup Alert: Displays standard MetaTrader 5 popup alerts.
  • Enable Sound Alert: Plays an audio file when an alert triggers.
  • Sound File Name: Audio filename from the MetaTrader 5 Sounds folder.
  • Enable Mobile Push Notification: Sends alerts to the MetaTrader 5 mobile app (requires MetaQuotes ID configured in terminal settings).
  • Enable Email Notification: Sends alert emails (requires SMTP configured in terminal settings).

Confirmation & Non-Repainting Behavior

  • Confirmed Signals ( Shift 1 ): All pattern detections, signal arrows, pattern labels, alert triggers, and calculation buffer signals are evaluated on closed bars only. Swing-based patterns require Swing Pivot Length closed bars to the right of the second swing before confirmation, and the resulting signal arrow, label, and projected target start on that exact confirmation bar—without back-painting arrows onto earlier bars. Once a bar closes, its confirmed signal does not repaint or vanish.
  • Live Forming Bar ( Shift 0 ): As with standard MetaTrader 5 oscillators, the RSI line, moving averages, regime coloring on the currently forming candle, and the live Multi-Timeframe (MTF) scanner reflect live intrabar price updates until each candle closes.

Disclaimer

RSI Patterns is provided strictly for technical analysis and educational purposes. All pattern detections, regime classifications, projected targets, and ATR reference levels are analytical tools derived from historical price data and do not guarantee future market performance.

Nothing displayed by this indicator constitutes financial, investment, or trading advice. Trading financial instruments involves substantial risk of loss; always apply independent judgment and proper risk management.
Prodotti consigliati
MT5 Drawdown Tracker – Track Your EA’s Performance with Precision! Take your trading analysis to the next level with our MT5 indicator designed to monitor, record, and report the drawdown of any Expert Advisor. Whether you’re fine-tuning your strategies or optimizing risk management, this tool gives you the insights you need. Key Features: Effortless Tracking: Automatically monitors the drawdown levels of your EAs with precision. Comprehensive Data Storage: Accurately logs each drawdown event,
ZigZag3LZZ
Igor Nagorniuk
ZigZag_3LZZ — Indicatore ZigZag a Tre Livelli L'indicatore ZigZag_3LZZ è progettato per l'analisi tecnica dei mercati finanziari. Mostra sul grafico tre linee ZigZag colorate con diversi periodi (5, 13, 34), consentendo al trader di:     Identificare visivamente i livelli chiave di inversione del prezzo     Filtrare le fluttuazioni di prezzo insignificanti e il rumore del mercato     Tracciare linee di tendenza basate sugli ultimi estremi     Calcolare automaticamente i livelli di Fibonacc
Astral Momentum
Ottaviano De Cicco
Astral Momentum Separate the impulse from the momentum picture. Launch Special — $78 · Save 35% · $120 after launch. A fast price impulse and a momentum turn are different readings. For discretionary traders who want to understand their relationship, Astral Momentum separates them visually and brings higher-timeframe context into the same workspace. Understand what is changing. Compare the immediate impulse with the momentum curve's direction instead of treating them as one measurement. Set a co
PipFinite Binary Options PRO MT5
Karlo Wilson Vendiola
4.29 (14)
This LEGIT Indicator Can Accurately Predict the Outcome of One Bar. Imagine adding more filters to further increase your probability! Unlike other products, Binary Options PRO can analyze past signals giving you the statistical edge. How Increase Your Probability Information revealed here www.mql5.com/en/blogs/post/727038 NOTE: The selection of a Good Broker is important for the overall success in trading Binary Options. Benefits You Get Unique algorithm that anticipates price weakness. Gene
Duchesne RSI Divergence finds divergences between the RSI and the price and draws them in the RSI window and on the chart. Main features - Regular bullish divergence: lower low on price, higher low on the RSI - Regular bearish divergence: higher high on price, lower high on the RSI - Hidden divergences on request - Swings confirmed after a number of bars on each side, so markers do not change afterwards - Minimum and maximum distance between the two swings - Lines in the RSI window and on the
The indicator detects divergence signals - the divergences between the price peaks and the MACD oscillator values. The signals are displayed as arrows in the additional window and are maintained by the messages in a pop-up window, e-mails and push-notifications. The conditions which formed the signal are displayed by lines on the chart and in the indicator window. The indicator parameters MacdFast - fast MACD line period MacdSlow - slow MACD line period MacdSignal - MACD signal line period Macd

This indicator is based on a classic Moving Average indicator. Moving averages help us to first define the trend and second, to recognize changes in the trend. Multi TimeFrame indicator MTF-MA shows MA data from the 4 timeframes by your choice. By default this indicator has external parameters: TF1 = 1; TimeFrame2b = true; TF2 = 5; TimeFrame3b = true; TF3 = 15; TimeFrame4b = true; TF4 = 60; InpPSARStep = 0.02; InpPSARMaximum = 0.2; You can change TF1-TF4 in the next limits: TF1 from M1 (1) to H4
Fisher Kuskus indicator for MT5
Renaud Herve Francois Candel
Fisher Kuskus Indicator Fisher Kuskus is an indicator used by scalpers on low time frames like M1. The Fisher Kuskus is now available for Metatrader platform. Inputs of the indicator are: Period : period to be used for calculation of the indicator PriceSmoothing : value of 0.0 to 0.99 IndexSmoothing : value of 0.0 to 0.99 The indicator can be used with any time frame. It can be used with any class of assets: Forex, Stocks, Indices, Futures, Commodities and Cryptos. Other indicators for MT4:
Strumenti per il guadagno e la ricerca. Il nucleo dei segnali e della strategia di trading si basa sull'algoritmo dell'autore per la formazione di modelli di previsione dei prezzi. Applicabile a qualsiasi strumento! Integrato con un sistema di controllo basato sull'MA "Volpe a nove code" , aggiornando e regolando il segnale nel modo più accurato possibile per il mercato, lo strumento e il periodo di lavoro. Idoneo: tutti gli strumenti in tutti i mercati (ci sono eccezioni). A chi è rivolto: h
Confluence Edge Indicator è uno strumento completo di analisi tecnica tutto-in-uno, progettato per offrirti una visione completa del mercato su più intervalli temporali. Elimina la necessità di sovraccaricare i grafici con numerosi indicatori, combinando le metodologie di analisi tecnica più efficaci in un'unica dashboard pulita e intuitiva. Questo indicatore non effettua il repaint (non ridisegna i segnali) e fornisce calcoli in tempo reale basati esclusivamente su Price Action, volume, momentu
WaveSniper
Alessandro Farinella
Wave Sniper One indicator. Adaptive baseline, multi-layer signal engine, and closed-bar confirmed entries — designed for traders who want precision without complexity. I tried to build the perfect indicator. I ended up deleting most of them. I used, studied and coded hundreds of indicators. I analyzed and converted entire libraries from PineScript, ProRealCode, EasyLanguage, MQL. Oscillators, moving averages, bands, candlestick pattern: you name it! I spent weeks, even months optimizing param
# MQL5 Submission - Trend Momentum Signals (Indicator) Ready-to-paste text for the MQL5 Market. It's an INDICATOR (Product type = Indicators). Honest, no performance claims - it shows signals; the buyer decides. --- **Product name:** Trend Momentum Signals **Product type:** Indicators **Account type:** Any **Short description (top line buyers read first):** Trend-aligned momentum and breakout signal arrows for any symbol and timeframe. Two trend-filtered entry patterns, RSI/ATR confirmatio
ATR Line
Evgeny Levchenko
The indicator - "ATR Line" determines the current trend and gives signals to buy (green arrow to the top) or sell (red arrow to the bottom). The indicator calculation is based on the deviation of the average price of the instrument from its average true range - ATR. The moving average of prices is used to reduce "market noise". If the main line of the indicator - "ATR Line" is lower the instrument price chart, then the market is in a "bullish" trend. If the main line of the indicator is higher t
This is my trusted friend of trading. So... I musted re-write this in MQL5 to use in brokers where there is only MT5. The indicator is like a mother-in-law, who talks often, talks a lot and often inappropriately. The indicator, in addition to giving us an entry signal on parameters which I will then list, monitors the trend of the hourly timeframe, OSMA to understand the entry direction, RSI to sense any overbought or oversold conditions from which to abstain, ATR for the volatility and ADX fo
CasperIT Z-Score Intelligence MT5 CasperIT Z-Score Intelligence is a professional market stretch indicator for MetaTrader 5. It uses Z-Score analysis to measure how far price has stretched from its statistical mean and presents the result through a clean institutional dashboard. The indicator is designed to help traders identify overbought, oversold, stretched, and extreme market conditions. It does not open trades. It provides market context, probability guidance, regime classification, and v
Indicatore Crypto_Forex "Hanging Man e Inverted Hammer" per MT5, senza ricalcolo e senza ritardo. - L'indicatore "Hanging Man e Inverted Hammer" è un indicatore molto potente per il trading basato sulla Price Action. - L'indicatore rileva i pattern Inverted Hammer rialzisti e Hanging Man ribassisti sul grafico: - Inverted Hammer rialzista: segnale con freccia blu sul grafico (vedi immagini). - Hanging Man ribassista: segnale con freccia rossa sul grafico (vedi immagini). - Con avvisi per PC e n
Institutional Flow Dashboard is a comprehensive technical analysis tool that combines two powerful methodologies: Volume Profiling and Relative Currency Strength . This all-in-one interface is designed to help traders identify high-liquidity price levels and market momentum in real-time. Key Features: Volume Profile Analysis: Visualizes the distribution of volume across price levels, identifying the Point of Control (POC) and Value Area (VA) . Multi-Currency Strength Meter: Analyses 8 major curr
Soft Dozer
Aleksei Sukhoi
Soft Dozer MT5 — Trend Channel professionale con filtraggio su timeframe superiori Soft Dozer MT5 è un sistema di trading potente e flessibile, implementato come un singolo indicatore tecnico sviluppato specificamente per la piattaforma MetaTrader 5. L'algoritmo si basa sul classico ritracciamento a ventaglio di Fibonacci, costruito attorno a un kernel di media mobile dinamico e smussato. Lo strumento è ideale per il trading di oro (XAUUSD), principali coppie di valute, indici e criptovalute su
Canal of shizukesa
Vincent Albert Feugier
SHIZUKESA Channel – Precision Volatility via Kijun Dynamics The SHIZUKESA Channel (Japanese for "Serenity") is a high-performance technical analysis tool built for traders who demand structural clarity. Unlike standard envelopes or Bollinger Bands that fluctuate with noise, this channel is mathematically rigid : it creates a 100% synchronized clone of the Kijun-Sen to identify objective price deviations. Core Features & Functionality Perfect Clone Structure : The bands do not rely on variable st
Trend Momentum MA
Flavio Javier Jarabeck
Imagine a simple and powerful line that gives you everything you need: Trend and Momentum . Welcome to the Trend Momentum Moving Average ! Visually it seems like a very simple Moving average, but in fact it is a VIDYA ( Variable/Volatility Index Dynamic Average ) type of moving average - originally created by Tushar Chande - and the main purpose of this special Moving Average is to understand and interpret the current volatility of the market and apply it as a smoothing factor for a traditional
Supply Demand areas
Makarii Gubaydullin
Zone di offerta/domanda: aree osservabili dove il prezzo si è avvicinato più volte in passato. Utilità multifunzionale:  66+ funzioni , inclusa questo indicatore  |   Contattami  per qualsiasi domanda  |  Versione MT4 L’indicatore mostra dove il prezzo potrebbe potenzialmente invertirsi di nuovo. Di solito, più volte il prezzo è stato respinto da un livello, più questo è significativo. Nelle impostazioni di input   puoi regolare: Abilitare o disabilitare zone deboli; Mostrare o nascondere descr
SMART TRADING SIGNALS MT5 Precision. Clarity. Confidence. Elevate Your Trading Experience with Smart Trading Signals Smart Trading Signals MT5 is a professional trading indicator designed to provide traders with a clearer, more organized view of market movements. Through an elegant visual interface, it presents trading opportunities and essential price levels in a comprehensive design that combines precision, clarity, and ease of use. Developed to be a practical trading companion, Smart Trad
Ava 3
Sveinn FRIDFINNSSON
5 (1)
AvA 3 SET files AvA 3 - HELLENIC: Dynamic Multi-Module Trading System AvA 3 - HELLENIC is a sophisticated Expert Advisor meticulously engineered for serious forex traders seeking exceptional versatility and precision in automated trading. This powerful EA integrates multiple trading modules within a flexible framework, delivering a complete trading solution adaptable to diverse market conditions. At its core, AvA 3 - HELLENIC features four specialized trading modules - ALPHA, BETA, GAMMA, and
ZeroLag TrendCandle Signal
Martin Alejandro Bamonte
ZeroLag TrendCandle — Sistema di colorazione delle candele e allarmi in tempo reale (Senza Repainting) ZeroLag TrendCandle è uno strumento di rilevamento del trend in tempo reale che applica una colorazione delle candele senza repaint basata su un'analisi avanzata dell'indicatore Williams Percent Range (WPR). Evidenzia i cambiamenti di trend, le variazioni di momentum e i potenziali inversioni tramite un sistema cromatico dinamico — consentendo ai trader di capire immediatamente la direzione d
Apex Trend Analyzer Indicator is a professional trend-following tool designed to help traders identify high-probability trading opportunities with greater confidence. By combining the analytical strength of Bollinger Bands , Exponential Moving Average (EMA) , and Simple Moving Average (SMA) , the indicator filters market noise and highlights the prevailing trend for more informed trading decisions. Whether you are a scalper, day trader, or swing trader, Apex Trend Analyzer simplifies market anal
Rainbow EA MT5
Jamal El Alama
Description : Rainbow EA MT5 is a simple Expert advisor based on   Rainbow MT5 indicator witch is based on Moving average with period 34. The indicator is incorporated in the EA, therefore, it is not required for the EA to operate, but if you wish, you can download it from   my product page . The Expert Advisor settings are as follows : Suitable for Timeframes up to H1 The parameters below can be set according to your trading rules. StopLoss ( Stop Loss in pips) TakeProfit ( Take Profit in pips
Auto Triangle Patterns Overview Auto Triangle Patterns is a chart indicator for MetaTrader 5. It scans the price history of the current chart and looks for three classical triangle formations: ascending, descending and symmetrical. When a formation is found, the indicator draws its two boundary lines, fills the area between them and adds a text label with the name of the formation. The pattern stays on the chart and is extended to the right with every new bar. When price leaves the formation in
MACD Divergence Radar EA MACD divergence EA for MT5: automated divergence trading with regular and hidden divergences, a stop beyond the pivot and a fixed reward-to-risk target. MACD Divergence Radar EA trades MACD divergences automatically. It uses the same signal engine as the indicator MACD Divergence Radar Pro — price pivots compared with the MACD histogram (OsMA) or the MACD main line, regular and hidden divergences, bullish and bearish — and turns every freshly confirmed divergence into a
Naked Forex Big Shadow indicator for MT5
Renaud Herve Francois Candel
5 (1)
Naked Forex Big Shadow Indicator Big Shadow Indicator is a pattern recognition indicator for Forex, Stocks, Indices, Futures, Commodities and Cryptos. When you have a Big Shadow on your chart then this is a strong signal meaning that you might be ahead of a reversal. You can take other elements (momentum, trend, volatility, price action, fundamentals) to build a complete strategy and confirm your entries. Beware that you might not make money just following the arrows generated by the pattern re
RSI Divergence Risk Target Signals RSI Divergence Risk Target Signals is a MetaTrader 5 indicator that detects confirmed bullish and bearish RSI divergence and combines the signals with optional trend filters, ATR-based Stop Loss levels, three Take Profit targets, alerts and an internal trade statistics dashboard. The indicator compares confirmed RSI pivot structure with corresponding price highs and lows. It is designed to help traders identify momentum divergence while providing a structure
Gli utenti di questo prodotto hanno anche acquistato
Trend Sniper X
Sarvarbek Abduvoxobov
4.87 (46)
Trend Sniper X è un indicatore trend-following multi-timeframe per MetaTrader 5 che aiuta i trader a identificare la direzione del trend e i potenziali punti di inversione con chiarezza e precisione. per MT4: https://www.mql5.com/en/market/product/193245 Informazioni sul prezzo: Il prezzo attuale è promozionale ed è soggetto a modifiche con il rilascio di futuri aggiornamenti e nuove funzionalità. Offerta Bonus: Per ricevere GRATIS l'Auto-Trade Assistant EA per questo indicatore, invia un messa
Entry Points Pro vi mostra dove entrare, dove mettere lo stop e con quale lotto operare — prima di piazzare l'ordine. PREZZO Ora 199 USD: 4 copie a questo prezzo, poi 249 USD. Il prezzo finale è di 349 USD. Guadagno facendo trading sui mercati e lo dimostro, quindi non ho bisogno di vendere questo indicatore a tutti. È uno strumento per trader che ragionano con la propria testa, non un pulsante magico. Nessuna rottura, nessun trade. Una freccia grigia è un segnale annullato: il prezzo non ha ro
Gann Made Easy è un sistema di trading Forex professionale e facile da usare che si basa sui migliori principi del trading utilizzando la teoria di mr. WD Gann. L'indicatore fornisce segnali ACQUISTA e VENDI accurati, inclusi i livelli di Stop Loss e Take Profit. Puoi fare trading anche in movimento utilizzando le notifiche PUSH. CONTATTAMI DOPO L'ACQUISTO PER RICEVERE GRATUITAMENTE LE ISTRUZIONI DI TRADING E OTTIMI INDICATORI EXTRA! Probabilmente hai già sentito parlare molte volte dei metodi d
Ultra Indicator
Ihor Otkydach
5 (1)
ULTRA è un indicatore tecnico che funziona secondo un approccio “tutto in uno”: analizza autonomamente il mercato, genera segnali di trading, visualizza i livelli per l’impostazione degli ordini stop-loss e suggerisce quando chiudere le operazioni per realizzare profitti o ridurre al minimo le perdite. In altre parole, non importa se non sai come analizzare il mercato, determinare i livelli — dove impostare lo stop-loss — o se hai difficoltà con la gestione del capitale. ULTRA farà tutto questo
Currency Strength Wizard   è un indicatore molto potente che ti fornisce una soluzione all-in-one per un trading di successo. L'indicatore calcola la potenza di questa o quella coppia forex utilizzando i dati di tutte le valute su più intervalli di tempo. Questi dati sono rappresentati in una forma di indice di valuta facile da usare e linee elettriche di valuta che puoi utilizzare per vedere il potere di questa o quella valuta. Tutto ciò di cui hai bisogno è collegare l'indicatore al grafico ch
Auto Optimized SpeedAngle è un sistema di vettorizzazione del momento di livello istituzionale che elimina l'overfitting ( curve-fitting ) attraverso l'ottimizzazione continua Walk-Forward (WFO). Invece di affidarsi a input statici che si degradano quando i regimi di mercato cambiano, l'indicatore recalibra dinamicamente i suoi parametri utilizzando la validazione Out-of-Sample (OOS), assicurando che i segnali visualizzati rappresentino reali vantaggi statistici anziché anomalie storiche. Quadro
Indicatore multi-valuta di forza e momentum MT5 Dynamic Forex28 Navigator è l'evoluzione dei nostri indicatori popolari da lunga data, che riunisce la potenza di cinque in uno: Advanced Currency Strength28 Indicator (700 recensioni) Advanced Currency IMPULSE with ALERT (530 recensioni) Currency Strength EXOTICS GOLD Impulse with Alert CS28 Combo Signals (bonus attuale) Non serve acquistare quattro indicatori e impilarli sui grafici. Tutto è riunito in un solo indicatore potente: la forza delle 2
M1 Sniper MT5
Oleg Rodin
5 (7)
M1 SNIPER   è un sistema di indicatori di trading facile da usare. Si tratta di un indicatore a freccia progettato per l'intervallo temporale M1. L'indicatore può essere utilizzato come sistema autonomo per lo scalping sull'intervallo temporale M1 e come parte del tuo sistema di trading esistente. Sebbene questo sistema di trading sia stato progettato specificamente per il trading sull'intervallo temporale M1, può comunque essere utilizzato anche con altri intervalli temporali. Inizialmente ho p
Azimuth Pro
Ottaviano De Cicco
5 (7)
Azimuth Pro V2: Synthetic Fractal Structure and Confirmed Entries for MT5 Overview Azimuth Pro is a multi-level swing structure indicator by Merkava Labs . Four nested swing layers, swing-anchored VWAP, ABC pattern detection, three-timeframe structural filtering, and closed-bar confirmed entries — one chart, one workflow from micro-swings to macro-cycles. This is not a blind signal product. It is a structure-first workflow for traders who care about location, context, and timing. 1. What Change
Boba Analysis Suite
Trade Ready Solutions LLC
5 (2)
Boba Analysis Suite Boba Analysis Suite è un indicatore di analisi per MetaTrader 5. Riunisce la struttura del mercato, le zone di prezzo rilevanti e il contesto generale del mercato in un’unica visualizzazione del grafico. Sviluppato sulla base dell’esperienza pratica come trader e formatore di trading, supporta un processo di analisi strutturato: valutare la direzione del mercato, individuare livelli importanti e analizzare congiuntamente più intervalli temporali. Analisi nel contesto del merc
Naked Forex Tweezer Pro Indicator Tweezer Pro Indicator is a pattern recognition indicator for Forex, Stocks, Indices, Futures, Commodities and Cryptos. The standard Tweezer is a two bar pattern. Our enhanced version is a multi-bar pattern. We filter the patterns for you so that you only get the     best and most effective patterns   and ignore the noise. The Tweezer pattern is a simple and effective pattern to trade. The strategy that comes with the Tweezer is based on price action. The Twe
Fx Levels Premium Indicator Support and Resistance are important concepts in trading. Fx Levels Premium was created to easily draw important levels of support and resistance for the active trader. The indicator will give you all important levels (support/resistance) to watch for a wide range of assets. Trading without these levels on your chart is like driving a car for a long journey without a roadmap. You would be confused and blind. Support and resistance levels should be used as guideline
OrderFlux – Indicatore Orderflow Footprint Chart, Volume Profile e Market Profile per MetaTrader 5 OrderFlux è un indicatore Footprint di Order Flow per MetaTrader 5 che permette di osservare direttamente cosa accade all’interno di ogni candela. Mostra il volume scambiato a ogni livello di prezzo, distinguendo gli acquirenti aggressivi dai venditori aggressivi. A partire dai tick, costruisce in tempo reale un grafico Footprint completo con delta, squilibri, assorbimento, Volume Profile, Market P
Meridian Pro
Ottaviano De Cicco
4 (3)
Meridian Pro 2.00: Professional Multi-Timeframe Trend Matrix for MT5 Meridian Pro 2.00 is a professional adaptive trend matrix for MetaTrader 5. It combines the original Meridian trend engine, a clean chart ribbon, closed-bar signal arrows, an 8-timeframe dashboard, Fuel momentum, weighted consensus, synthetic HTF processing and chart-native higher-timeframe context lines. The goal is simple: read current trend, multi-timeframe structure, strength, momentum and EA-ready state from one discipline
PZ Swing Trading MT5
PZ TRADING SLU
5 (5)
Protect against whipsaws: revolutionize your swing trading approach Swing Trading is the first indicator designed to detect swings in the direction of the trend and possible reversal swings. It uses the baseline swing trading approach, widely described in trading literature. The indicator studies several price and time vectors to track the aggregate trend direction and detects situations in which the market is oversold or overbought and ready to correct. [ Installation Guide | Update Guide | Tro
Apollo SR Master è un indicatore di Supporto/Resistenza con caratteristiche speciali che rendono il trading con le zone di Supporto/Resistenza più semplice e affidabile. L'indicatore calcola le zone di Supporto/Resistenza in tempo reale senza alcun ritardo, rilevando i massimi e i minimi dei prezzi locali. Quindi, per confermare la nuova area SR formata, l'indicatore mostra un segnale speciale che segnala che la zona SR può essere presa in considerazione e utilizzata come un vero e proprio segna
Neuro Poseidon MT5
Daria Rezueva
4.68 (53)
Neuro Poseidon is a new indicator by Daria Rezueva. It combines precise trading signals with adaptive TP/SL levels - creating best possible trades as a result! Message me and get  Neuro Poseidon Assistant  as a gift to automize your trading process! What makes it stand out? 1. Proven profitability on all assets and timeframes 2. Only confirmed BUY and SELL signals present on the chart 3. Adaptive TP & SL levels generated by the software for each trade 4. Easy to understand - suitable for al
Trend Lines PRO MT5
Roman Podpora
5 (1)
LINEE DI TENDENZA PRO       Aiuta a capire dove il mercato sta realmente cambiando direzione. L'indicatore mostra reali inversioni di tendenza e punti in cui i principali attori rientrano. Vedi  Linee BOS   Cambiamenti di tendenza e livelli chiave su timeframe più ampi, senza impostazioni complesse o rumore inutile. I segnali non vengono ridisegnati e rimangono sul grafico dopo la chiusura della barra. VERSIONE MT 4     -      Svela il suo massimo potenziale se abbinato all'indicatore   RFI LEVE
Bill Williams Advanced
Siarhei Vashchylka
5 (11)
Bill Williams Advanced is designed for automatic chart analysis using Bill Williams' "Profitunity" system. The indicator analyzes four timeframes at once. Manual (Be sure to read before purchasing) Advantages 1. Analyzes the chart using Bill Williams' "Profitunity" system. Signals are displayed in a table in the corner of the screen and on the price chart. 2. Finds all known AO and AC signals, as well as zone signals. Equipped with a trend filter based on the Alligator. 3. Finds "Divergence Bar
TPA True Price Action indicator reveals the true price action of the market makers through 100% non-repainting signals strictly at the close of a candle! TPA shows entries and re-entries, every time the bulls are definitely stronger than the bears and vice versa. Not to confuse with red/green candles. The shift of power gets confirmed at the earliest stage and is ONE exit strategy of several. There are available now two free parts of the TPA User Guide for our customers. The first "The Basics"
ARICoins
Temirlan Kdyrkhan
ARICoin is a powerful trading companion designed to generate high-probability entry signals with dynamic TP/SL/DP levels based on volatility. Built-in performance tracking shows win/loss stats, PP1/PP2 hits, and success rates all updated live. Key Features: Buy/Sell signals with adaptive volatility bands Real-time TP/SL/DP levels based on ATR Built-in MA Filter with optional ATR/StdDev volatility Performance stats panel (Success, Profit/Loss, PP1/PP2) Alerts via popup, sound, push, or email Cust
Precision Spike Detector
Francisco Mandomo Simbine
5 (2)
Precision Spike Detector V3 – Institutional-Grade AI Trading System Attention: The price increases by US$50 for every 10 purchases.  Final price: US$599 Precision Spike Detector V3   is a   state-of-the-art, institutional-grade market analysis system   for   MetaTrader 5 , designed to detect   high-probability market movements   in synthetic indices such as   Boom, Crash, GainX, and PainX . After purchase, send me a private message to receive the optimized configuration files,  the installation
Superhero
Ihor Otkydach
5 (3)
L'indicatore SUPERHERO è un sistema di trading multivaluta progettato secondo un approccio "all-inclusive". L'indicatore analizza autonomamente il mercato e fornisce segnali su quando aprire e chiudere le posizioni. Utilizza ordini Stop Loss e Take Profit. Il rapporto R:R è 1:1. Questo sistema è in grado di inviare notifiche push sul tuo smartphone, consentendoti di effettuare operazioni "in mobilità" senza dover rimanere incollato al PC. È perfetto per le società di trading proprietario. UN OMA
Apex Patterns PRO Acquista l'indicatore - Ottieni GRATUITAMENTE l'Expert Advisor basato su di esso. Intelligenza auto-ottimizzante per pattern grafici e breakout Gli scanner di pattern tradizionali si basano su input fissi, registrando spesso prestazioni inferiori quando la volatilità e le strutture del mercato cambiano. Apex Patterns PRO è progettato per adattarsi alle mutevoli condizioni di mercato combinando il riconoscimento dei pattern grafici strutturali, il filtraggio del momentum e l'au
Adaptive Price Action Engine Acquista un indicatore, ricevi l'EA gratis Analisi Auto-Ottimizzata del Trend e dei Pattern Candlestick Multi-Timeframe I mercati cambiano continuamente e non tutti i pattern di Price Action hanno lo stesso valore in ogni condizione di mercato. Adaptive Price Action Engine è progettato per adattarsi alle condizioni di mercato in continua evoluzione, combinando struttura del trend, analisi Multi-Timeframe, pattern Candlestick e ottimizzazione statistica in un unico fr
Divergence Bomber
Ihor Otkydach
4.89 (94)
Ogni acquirente dell’indicatore riceverà inoltre gratuitamente: L’utilità esclusiva “Bomber Utility”, che gestisce automaticamente ogni operazione, imposta i livelli di Stop Loss e Take Profit e chiude le posizioni secondo le regole della strategia I file di configurazione (set file) per adattare l’indicatore a diversi asset I set file per configurare il Bomber Utility in tre modalità: “Rischio Minimo”, “Rischio Bilanciato” e “Strategia di Attesa” Una guida video passo-passo per installare, con
The Oracle Pro
Ottaviano De Cicco
5 (1)
The Oracle Pro: Synthetic Multi-Timeframe Bias Engine for MT5 The Oracle Pro is a premium multi-timeframe bias engine for MetaTrader 5, built for demanding and professional traders. It answers one question with discipline: what is the directional bias on each timeframe right now, how strong is it, and how much do the timeframes agree? Everything is computed on closed bars only - no repainting. The Oracle Pro is a multi-factor consensus system. It combines proprietary indicators and optimized alg
ScalpPoint
Temirlan Kdyrkhan
ScalpPoint is a powerful trading companion designed to generate high-probability entry signals with dynamic TP/SL/DP levels based on volatility. Built-in performance tracking shows win/loss stats, PP1/PP2 hits, and success rates — all updated live. Key Features: Buy/Sell signals with adaptive volatility bands Real-time TP/SL/DP levels based on ATR Built-in MA Filter with optional ATR/StdDev volatility Performance stats panel (Success, Profit/Loss, PP1/PP2) Alerts via popup, sound, push, or emai
Scalper Vault è un sistema di trading potente e completo, progettato per i trader che desiderano ottenere risultati costanti nel trading intraday. Questo indicatore ad alta precisione funge da sistema di trading autonomo, offrendo analisi di livello istituzionale sia per il mercato Forex che per le Opzioni Binarie. CONTATTAMI DOPO L'ACQUISTO PER RICEVERE I MIEI CONSIGLI DI TRADING E UN FANTASTICO BONUS! Eliminando le congetture e le complesse analisi manuali, Scalper Vault ti permette di concen
AriFocus
Temirlan Kdyrkhan
AriFocus - Non-Repainting Buy/Sell Signals AriFocus - one clear signal. AriFocus marks buy and sell signals directly on the chart and suggests a stop-loss level for each one. Every signal is confirmed on bar close and never repaints. - Buy/sell arrows, confirmed on bar close - Suggested stop-loss level for every signal - Trend band and candle coloring to show direction at a glance - 10 ready-made presets, or your own settings (14 calculation methods) - Pop-up, push and email alerts with entr
Altri dall’autore
The Liquidation Zones Heatmap is a custom technical indicator designed for the MetaTrader 4 (MT4) platform. It calculates and visualizes estimated liquidation zones based on price action and internal algorithms, displaying them as a dynamic heatmap on the chart. These zones are known by several names, sometimes referred to as liquidity pools, liquidity levels, leverage levels, liquidation heatmap levels, leverage heatmap zones, or leverage heatmap levels. These zones represent potential areas of
Auto Elliott Engine The Auto Elliott Engine is a tool designed for MetaTrader 4 that automates the identification, decomposition, and projection of price structures based on the Elliott Wave Theory. Powered by a pattern-recognition engine, this indicator processes price action to identify market configurations, translating data into structured scenarios. Key Features Multi-Degree Recognition: Analyzes price action across multiple fractal levels. From higher degrees, such as Supercycle or Cycle,
Elliott Wave Engine The Auto Elliott Engine is a tool designed for MetaTrader 5 that automates the identification, decomposition, and projection of price structures based on the Elliott Wave Theory. Powered by a pattern-recognition engine, this indicator processes price action to identify market configurations, translating data into structured scenarios. Key Features Multi-Degree Recognition: Analyzes price action across multiple fractal levels. From higher degrees, such as Supercycle or Cycle,
The Smart Liquidation Clusters  is a custom technical indicator designed for the MetaTrader 4 (MT4) platform. It calculates and visualizes   estimated liquidation zones   based on price action and internal algorithms, displaying them as a dynamic heatmap on the chart. These zones are known by several names, sometimes referred to as liquidity pools, liquidity levels, leverage levels, liquidation heatmap levels, leverage heatmap zones, or leverage heatmap levels. These zones represent   potential
The   Smart Liquidation Clusters    is a custom technical indicator designed for the MetaTrader 5 (MT5) platform. It calculates and visualizes   estimated liquidation zones   based on price action and internal algorithms, displaying them as a dynamic heatmap on the chart. These zones are known by several names, sometimes referred to as liquidity pools, liquidity levels, leverage levels, liquidation heatmap levels, leverage heatmap zones, or leverage heatmap levels. These zones represent   potent
SMC Framework Pro
Enrique Gauto Sand
SMC Framework Pro is a technical analysis indicator developed for the MetaTrader 5 platform. It integrates multiple tools commonly associated with Smart Money Concepts (SMC) into a single environment, focusing on the visualization of price action, market structure, and selected price patterns. The indicator processes historical and incoming price data to identify structural points, price imbalances, and recurring formations. Its purpose is to assist in chart analysis by organizing this informati
SMC Pattern Detector (Rilevatore di Pattern SMC) è uno strumento di analisi tecnica basato sui concetti di Smart Money (Smart Money Concepts - SMC). Questo indicatore automatizza l'identificazione della struttura di mercato, delle zone di domanda e offerta e dei pattern SMC. Basato su un'architettura senza riverniciatura (No-Repaint), tutti i segnali vengono confermati a candela chiusa. Crediamo nella trasparenza al 100%. Non basarti solo sugli screenshot; guarda come l'indicatore reagisce alle
Elliott Wave ABC
Enrique Gauto Sand
Elliott Wave ABC  Overview Elliott Wave ABC is an interactive indicator designed for MetaTrader 5 (MT5) that automates the detection, scoring, and visualization of Elliott Wave Zig-Zag (A-B-C) structures. It scans chart data to locate both completed and incomplete Zig-Zag patterns, offering structural analysis, Fibonacci projection targets, and a stacked dual-panel user interface. This Elliott Wave indicator is only focused an ABC - Zig-Zag Pattern. --- Key Features 1. Automated Zig-Zag D
Crypto Liquidation Zones is a technical visualization tool designed for MetaTrader 5 that attempts to estimate and display theoretical liquidation areas on the chart. Based on historical price extremes and user-defined leverage levels, the indicator models where leveraged market participants could potentially face stop-outs or liquidation thresholds, representing these zones via a dynamic on-chart heatmap overlay. WHAT IT DOES  - Theoretical Zone Estimation: Derives estimated liquidation pri
Gold Liquidation Momentum is a premium, volume and momentum indicator specifically optimized for Gold (XAUUSD) , Forex, and major Indices. It analyzes price-action dynamics and tick volume to model hypothetically the momentum of different market participants and visualizes hypothetically  buyer/seller dominance in real-time. How It Works The indicator tracks market volume across 5 distinct leverage tiers (100x, 50x, 35x, 25x, and 10x). Using an advanced mathematical decay formula tailored for no
Astro Gann Cycles
Enrique Gauto Sand
Overview Astro Gann Cycles is an analytical timing indicator for MetaTrader 5 inspired by interpretations of W.D. Gann's work. Astro Gann Cycles tries to calculates planetary positions directly within MetaTrader to identify repeating astronomical configurations. By analyzing the celestial backdrop associated with major market highs and lows, the indicator models hypothetical cycle waves that could help anticipate potential timing windows where market turning points might occur. Important Note :
Astro Gann Intraday Astro Gann Intraday is an technical timing tool developed for MetaTrader 5 that maps hypothetical short-term astronomical cycles onto intraday price charts (M1 to H1). Inspired by W.D. Gann's work, the tool tries to   examine real-time celestial coordinates—primarily the Moon's movement, fast planetary positions, and local diurnal rotation angles—to help traders study potential harmonic timing windows. Overview Astro Gann Intraday  focus exclusively on fast-moving celestial b
Hurst Cycles MT5
Enrique Gauto Sand
Overview Hurst Cycles MT5 is a technical analysis indicator for MetaTrader 5 designed for Hurst cycle analysis using Centered Moving Average (CMA) envelopes across six harmonic periods (10, 20, 40, 80, 160, and 320 bars). It provides 2:1 harmonic trough synchronization, cycle bullishness/bearishness metrics, Valid Trend Line (VTL)  and cycle projections. Key Features Multi-Cycle CMA Envelopes (10–320): Displays six nested CMA center lines and standard deviation bands on the main chart (with opti
Filtro:
Nessuna recensione
Rispondi alla recensione