Stochastic Wave Trends

  1. General Information.

The SWT basic indicator is the main indicator of the SWT method — a method for quantitative analysis of financial markets.

The method is based on decomposing the price chart of a financial instrument into a basis of Stochastic Wave Trends (SWT-Method).

The complete toolkit of the method includes:

  • the SWT basic indicator — the main indicator of the system;

  • the SWTch peak volatility channel indicator;

  • the SWTsr support/resistance channel indicator;

  • the SWTtr digital trend indicator (auxiliary, used at the trader's discretion);

  • the SWTml digital volume indicator (auxiliary, used at the trader's discretion);

  • the SWT-Robot trading robot builder (for those who prefer automation of algorithmic trading, full or partial).

The indicators can be used autonomously for manual work, and with robot support for automatic and semi-automatic trading in the market.

The working area of the SWT method with the full set of installed indicators and a table of settings and robot status parameters is shown in Fig.1.

The SWT basic indicator performs the following functions:

  • dividing the price chart of a financial instrument into a system of Stochastic Wave Trends;

  • displaying trends in a separate chart window;

  • analyzing the nature of market movement for each of the trends of the analyzed financial instrument;

  • calculating the current value of root-mean-square and peak volatility and displaying volatility channels for each analyzed trend.

The data from the basic indicator are the foundation for the operation of the SWT-Robot trading algorithms and are the source data for the auxiliary service indicators.

The basic indicator contains no configurable parameters; its operating algorithm is hard-coded, once and for all.
The two parameters available for configuration are intended to enable or disable the display mode of additional indicator functions:
input bool ShowVolChannelForW4 = false;
input bool SUMM = false.
The purpose of these parameters and the functions and indicator elements displayed when they are enabled will be discussed at the end of the description.

  1. Theory.

The SWT basic indicator separates the overall price movement into components whose average cycle is concentrated in different regions spaced along the frequency (period) scale. These components are separated in such a way as not to introduce distortions into the original process, and the sum of all components of the resulting decomposition yields the original price chart (decomposition principle).
Technically, the separation is performed using a system of band-pass filters whose amplitude-frequency characteristics are presented in Fig.2. The inputs of these filters receive the time series corresponding to the price chart quotes, and the output yields a set of time functions into which this signal is separated.

The separation components are time functions with different spectral composition and different rates (speeds) of change and different amplitudes (ranges) of oscillation.
The separation elements — stochastic waves — retain the stochastic nature of the original process. Hereinafter we will call these functions Stochastic Wave Trends.

The characteristics of wave trends are determined by the nature of the process generating them, i.e., the price chart, and its most general properties.
The energy spectrum of processes with an envelope of the form 1/f^n, where n>1 (a special case for white noise is n=2), allows us to naturally and from a unified standpoint explain the fractal nature and the cyclic movement of market prices, as well as the hierarchy and nesting of cycles noted in a number of studies devoted to the study of cyclic and wave properties of market processes.
Whichever scale of the price chart we take as the initial movement, on smaller-scale charts the movements will on average be smaller, since their power decreases inversely proportional to a power function of frequency, and movements on larger-scale charts for the same reason will have larger amplitudes and periods of cycles. That is, fast oscillations will occur against the background of and within the framework of slow movements of larger amplitude.

The presence in the spectrum of an envelope of the form 1/f^n leads to a rapid decrease in the output signal levels of the filters with increasing frequency and naturally limits the number of waves that make a significant contribution to market dynamics.

In theory, the number of filters and waves of the SWT method is infinite. From the standpoint of the theory of self-organized criticality systems, it is necessary to use all information about the process, but in practice the decomposition reduces to a fairly small finite number of significant components, and the rest can be discarded as insignificant.
The limitation of the number of waves considered is natural in nature and is due to the parameters of real markets and the requirements of real problems, as a result of which the formula for the price chart takes the form

z(t) = ∑ Wi(t) + n(t) + Φ(t),

where

  • z(t) is the function describing the price chart;

  • under the summation sign are the waves represented on the chart;

  • n(t) is the so-called "price noise" — market movements within the bars of the chart that are of no practical importance for the tasks of analyzing the current chart;

  • Φ(t) represents slow oscillations with high energy that correspond to waves not represented on the chart and whose rate of development is much lower than the movements represented on the chart.

As noted above, the step of the filter comb is not of fundamental importance and can be anything. Only the characteristics of the separated components and the time parameters of the trends under consideration will change.
Such trends themselves are largely artificial in nature and do not have a single generating factor or process. We simply group into a single time function all random factors whose action is concentrated in a certain frequency interval, nothing more. Nevertheless, the choice of an interval with a multiplicity of 5 has a certain physical basis, namely:

  • there are 5 days in a week;

  • a day contains 24 hours, which is close to 25;

  • a month has slightly more than 4 weeks, which is also close to 5.

It is natural to expect that the market contains cycles of daily and weekly activity. And then we simply extrapolate the scales up and down from the daily and weekly cycles. The resulting trends are artificial in nature, but they reflect the real part of all movements in a given frequency band (period interval).

The above relationships are valid for a continuous weekly trading session of 24 hours a day, 5 days a week. If there are gaps in the session, the one-to-one correspondence between trend cycles on charts of different scales will be fulfilled with an error that is greater the larger the gap. This does not prevent the use of wave trends for analyzing market dynamics, but it should be taken into account that the continuity of trends between waves displayed on timeframes of different intervals will also have an error.

In the hardware implementation of the method, 10 stochastic wave trends with different average cycle periods are used, the main ones being:

  • global trend — 50-75 years;

  • main trend — 10-15 years;

  • long-term trend — 2-3 years;

  • medium-term trend — 5-7 months;

  • short-term trend — 4-6 weeks;

  • local trend — 4-6 days;

  • daily trend — 20-30 hours;

  • intraday trend — 4-6 hours;

  • hourly trend — 50-70 minutes;

  • intra-hour trend — 10-15 minutes.

The main parameters of the waves and their designation on the charts are presented in the table (Fig.3).

So, we used a system of filters whose center frequencies are multiples of the number 5 (...F/25, F/5, F, 5F, ...). But the multiplicity of the time scale of timeframes differs from 5, so the indicator uses automatic normalization of parameters depending on the chart scale. This enables one-to-one mapping of the same trends on charts of different scales (Fig.3).

  1. Indicator Properties

On the charts for each timeframe, in accordance with the table in Fig.3, three waves are displayed: W2 — light blue, W3 — red, and W4 — turquoise, which represent wave trends, as well as auxiliary lines displaying the parameters and nature of trend movement. The default indicator chart is presented in Fig.4.
To examine waves (trends) of a larger or smaller scale, simply change the timeframe.

When analyzing the market and planning long-term trades, the role of trends from daily and below is insignificant. Their behavior and characteristics are considered mainly from tactical considerations when trading in the direction of trends of a higher hierarchy level. The exception is intraday trading with a short position holding time.

Analysis of even shorter components must be carried out on tick charts, and its area of application is automated trading using high-frequency trading robots, since humans are no longer capable of making adequate decisions under such rapidly changing conditions. But this requires entirely different hardware and software tools.

The method of decomposing the price chart into a set of stochastic wave trends — The Stochastic Wave Trends Method or SWT method — allows identifying trends and cycles that are not artificially attributed but are present in the internal structure of the general market movement HERE AND NOW. We do not impose anything from outside but observe the real characteristics of the real process without losses and can at any moment in time assess the intensity and nature of market dynamics in any given time scale. It is not the price that follows the indicator, but the indicator that follows the price.
We also note that the analysis of market dynamics within the SWT method must be performed across the entire set of wave components, taking into account their intensity, mutual direction, and speed of movement.

That concludes the principles of indicator construction. I will only add that by default the filter comb is tuned to the reference points of the expected trends of the daily and weekly cycles, i.e., the center frequencies of two filters correspond to periods of 24 and 120 hours, and then up and down with a multiplicity of 5, as described above in the text.
If the duration of daily and weekly trading sessions differs from the specified values, the method remains operational, but the one-to-one correspondence of waves on charts of different scales may be disrupted. This does not violate the principles of working with the indicator, but the interpretation of individual wave trends changes.

Now let us discuss the technical details.

When the indicator is dropped onto a chart, a settings window appears, presented in Fig.5.

ShowVolChannelForW4 — parameter for displaying the peak volatility channel for wave W4.
SUMM — parameter for displaying the sum of waves from W4 and younger.

Let us examine the indicator elements.
When the indicator is connected in default mode, the indicator elements shown in Fig.6 are displayed on the screen (the lower chart window is artificially enlarged for convenience of placing designations).

In addition to waves W2, W3, and W4, the chart displays volatility channels and trend direction indicators.
The indicator calculates:

  • the root-mean-square volatility channel of wave W3 — a dashed thin red line;

  • the peak volatility channel of wave W3 — a solid thin red line;

  • the root-mean-square volatility channel of wave W4 — a dashed thin turquoise line;

  • the peak volatility channel of wave W4 — a solid thin turquoise line (not displayed in default mode).

In addition, trend direction indicators are generated for waves W3 and W4. The trend direction is determined by formal numerical criteria and essentially represents the momentum of the wave of the corresponding level. In the current version, with a delay of one chart bar.

The location of trend direction indicators at the boundaries of volatility channels in the positive value region corresponds to the formal criterion for an uptrend, and in the negative value region — to the criterion for a downtrend.
The location of indicators inside the channels in the positive value region corresponds to a downward correction, and in the negative value region — to an upward correction of the corresponding trend.
If the indicator "jitters" or there are other problems with determining the reliable direction of a particular trend, it is recommended to switch to trends of higher hierarchy levels.

Using the table in Fig.3 and the SWT indicator, one can determine the direction of any of the trends considered within the SWT method. Summary characteristics of trends, except for the global one, are also provided in the table of the SWTtr service indicator and in the status parameter indication of the SWT-Robot.

Fig.7 shows the appearance of the SWT basic indicator in the mode of displaying the sum of waves and the peak volatility channel for wave W4.

Displaying the sum of waves can be useful when choosing the trading direction during consolidation across waves of younger trends in the target zone of the trend determined by wave W4.

The sum of all waves together with the peak volatility channel for wave W4 can be useful for assessing the "overbought" and "oversold" condition of the instrument when the sum of waves goes beyond the channel.
This does not mean that we should immediately open a trade in the opposite direction. More often in such situations, one should refrain from continuing purchases or sales.

  1. Graphical Patterns.

4.1. Trend Reversal Pattern

Looking at charts, we clearly see in the past where a trend or correction ended and where we could have opened a promising position on a pullback. But we cannot open a position in the past; we can only act in the present without knowing the future development of events.
Signs of a wave moving downward are not enough for us; we also need a tool for selecting these signs. And as such a tool, we use the trend reversal pattern (Fig.8).

We will examine the formation of the pattern using the example of Fig.8, which displays all the necessary components of the pattern at a convenient scale. (For convenience of examination, the volatility channels from the lower indicator window have been transferred to the price chart.)

The formal features of the pattern are as follows.

  1. The price returns to the peak volatility channel for wave W4, and wave W4 changes direction in the zone of maximums (or minimums) near the boundaries of the standard deviation channel. (More reliably on the second attempt (but it may not happen). Number 1 on the chart. The market maximum for the second attempt should be lower than the maximum for the first.

  2. Inside the peak volatility channel for wave W4, wave W3 of the same sign as W4 has moved to the other half-plane. An additional feature — the dynamics (direction of the local trend) of at least two market extremes must coincide with the direction of wave W3 movement after its reversal. Number 2 on the chart.

  3. Wave W2 has crossed the zero line in the direction of movement of waves W4 and W3 (additionally).

In general, a trade based on the pattern should be made if there is no contradiction between the direction of the reversal pattern and the direction of movement of higher trends, as well as patterns formed by higher trends. However, the trader may, at their discretion, also trade counter-trend — a trade against the movement of higher trends based on signs of a possible reversal.

The stop is placed beyond the price corresponding to the pattern extremum plus a confidence interval.
If trading in the direction of the higher trend, the stop can (and should) be placed according to the parameters of that trend.
Targets are standard within the chosen strategy, but it is recommended to use intermediate profit-taking at the boundaries of volatility channels and/or support/resistance channels.
The development of a formed trend reversal pattern can follow two scenarios:

  • continuation of movement in the direction of the reversal pattern;

  • cancellation of the pattern and restoration of the previous direction of market movement, i.e., a restoration pattern.

4.2. Trend Restoration Pattern

The restoration pattern is formed as a counter reversal pattern on a wave one level lower. In Fig.8, the zone of formation of the restoration pattern is shown inside the oval, and it is formed on wave W3 of the daily chart.
Details can be seen on the H4 chart (Fig.9).

The features of formation are the same as for the reversal pattern. The only difference is that the pullback of wave W4 may not lead to going beyond the root-mean-square volatility channel of wave W4.
The development of a formed restoration pattern can follow two scenarios:

  • renewal of the market maximum (minimum) and cancellation of the reversal pattern per section 4.1;

  • continuation of the reversal within the framework of the "Channel-1" pattern.

4.3. Graphical Pattern "Channel-1"

The "Channel-1" pattern can form as a transitional one between the moment of formation of the trend reversal pattern and the actual reversal, i.e., the transition of wave W4 to the other half-plane (change of wave sign). That is, the pattern is active until the moment of reversal of wave W4 (Fig.10).

It works during prolonged sideways market movements and represents alternating up/down oscillations on wave W3 within the boundaries of the volatility channels of that wave.
for conducting trades based on the pattern.

4.4. Graphical Pattern "Channel-2"

The "Channel-2" pattern is formed in the trend reversal zone (in Fig.11, a downward reversal pattern) and is characterized by the completion of the "Channel-1" pattern with the cessation of oscillatory movements of wave W3 and its stable location in one half-plane (in Fig.11, in the negative value region).

The principle of using the pattern in the situation shown in the figure is aggressive selling based on signs of restoration of downward movement of waves W2 and W3.
Sales continue until the pattern is cancelled by counter patterns, including those on trends of a lower hierarchy level. And, of course, with strict control of the risk size.
Intermediate growth targets at the boundary of the volatility channel of wave W3.
Intermediate pullback targets in the zone of the boundary of the volatility channel of wave W2.
The "Channel-2" pattern is recommended for aggressive accumulation of position volume.

4.5. Alternation of Patterns

Graphical patterns form and flow into each other, forming their own movement targets and their own criteria for the development of the situation for each stage. This must be remembered. "Everything flows, everything changes." Both the situation and the interpretation, and the targets and plans.
And besides, one should not forget about the situation on higher timeframe charts, tracking possible divergence of market movements.
Trading by patterns is easy and pleasant if everything goes "according to plan." But the main problems arise if something goes wrong, and in the market this happens very often.
The recipe is very simple — keep risks within reasonable limits.
And a general remark that implicitly follows from the material considered. Entry into the market, as a rule, is better done on a pullback, based on signs of its completion by patterns of trends of a lower hierarchy level.

DISCLAIMER

Trading in foreign currency, gold, CFD, and other financial market assets involves significant risk. Past results do not guarantee future ones, and losses are possible — both for objective reasons and due to the personal qualities of the investor. Results may differ among different brokers and on different accounts due to order execution conditions, spreads, slippage, liquidity, and technical infrastructure.

Any market analysis is formed based on events that have already occurred and remains relevant only at the moment of its conduct. It does not limit future market behavior, which can be anything. New data — including data not yet publicly available — can completely change the situation and trading tactics.

The set of software tools provided (the SWT method toolkit) is intended for technical market analysis and is not an automatic trading system. Trading decisions are made by the trader, and only the trader. Such decisions do not exhaust all market possibilities, do not account for all price changes, and do not guarantee profitable trading. Subjective errors of the user in assessing market prospects, choosing the direction of price movement, strategy, and tactics are also not excluded.

There are no guarantees that the practical use of systems, programs, tactics, and strategies based on the SWT method will lead to financial gain or any other desired result. The user must be aware of and fully accept all possible risks associated with the application of the SWT method and the software tools implementing it, including the risks of financial losses. Due to the unpredictability of pricing, trades in financial markets contain a high degree of risk, and the chances of success are determined not only by its magnitude but also by the quality of assessment of these risks.

We bear no financial or other responsibility for any financial results of using the indicator software tools — whether with profit or loss, regardless of the reasons that led to such a result.

Carefully study the data received from the broker's or dealing center's server: there have been numerous cases where information contained errors, including critical ones, affecting the operability of programs and the correctness of their readings and operation results.

This list is not a complete and exhaustive list of all risks associated with the application of the presented materials in any types of capital investments and investments within the framework of trading in currency and other instruments of financial and commodity markets.

Prodotti consigliati
Pointer Trend Switch — precision trend reversal indicator Pointer Trend Switch is a high-precision arrow indicator designed to detect key moments of trend reversal based on asymmetric price behavior within a selected range of bars. It identifies localized price impulses by analyzing how far price deviates from the opening level, helping traders find accurate entry points before a trend visibly shifts. This indicator is ideal for scalping, intraday strategies, and swing trading, and performs equa
PABT Pattern Indicator - it's classical system one of the signal patterns. Indicator logic - the Hi & Lo of the bar is fully within the range of the preceding bar, look to trade them as pullback in trend. In the way if indicator found PABT pattern it's drawing two lines and arrow what showing trend way.  - First line - it's entry point and drawing at: 1. On the high of signal bar or on middle of the signal bar (depending from indicator mode) for buy; 2. On the low of signal bar or on middle of t
Trend Flasher Trend is your friend is the age old saying quote in trading arena, there are though many ways to gauge the trend and its direction, more scientific measure and logically meaningful will be an ATR break outs to identify and spot the trend and its acceleration, so we created this easy to use trend identification panel and optimized super trend based multi time frame panel entry system to aid and help the traders to make their trading decision. Unique Features of Trend Flasher 1. H
Alpha Trend sign has been a very popular trading tool in our company for a long time. It can verify our trading system and clearly indicate trading signals, and the signals will not drift. Main functions: Based on the market display of active areas, indicators can be used to intuitively determine whether the current market trend belongs to a trend market or a volatile market. And enter the market according to the indicator arrows, with green arrows indicating buy and red arrows indicating se
Auto Fibo Pro m
DMITRII GRIDASOV
Indicatore "Auto FIBO Pro" Crypto_Forex: è un ottimo strumento ausiliario nel trading! - L'indicatore calcola e posiziona automaticamente sul grafico i livelli di Fibo e le linee di tendenza locali (colore rosso). - I livelli di Fibonacci indicano le aree chiave in cui il prezzo può invertirsi. - I livelli più importanti sono 23,6%, 38,2%, 50% e 61,8%. - Puoi usarlo per lo scalping di inversione o per il trading di zone grid. - Ci sono molte opportunità per migliorare il tuo sistema attuale usa
The Alpha Trend
Ellan Dirgantara Tholkhah
The Alpha Trend Experience the cutting-edge in trend analysis. The Alpha Trend doesn't just identify trends—it filters out the noise, focusing only on the primary movements of price. Whether you're a Binary Option pro or a scalping enthusiast in the Forex world, this tool is tailored for you. Here's the secret: The initial thrust of a major trend often sets its enduring direction, irrespective of the minor fluctuations within. With Alpha Trend, you can decode this momentum, pinpointing the most
Towers
Yvan Musatov
Towers - Trend indicator, shows signals, can be used with optimal risk ratio. It uses reliable algorithms in its calculations. Shows favorable moments for entering the market with arrows, that is, using the indicator is quite simple. It combines several filters to display market entry arrows on the chart. Given this circumstance, a speculator can study the history of the instrument's signals and evaluate its effectiveness. As you can see, trading with such an indicator is easy. I waited for an a
This is the complete REX package. It consists of the lite, pro and ULTRA version.  Perfect for beginners and intermediates. REX complete is 100% non repaint. The strategy is based on a mix of different strategies, statistics, including pivot points, oscillators and patterns.  As the trading idea consists of a variety of some classic indicators like Momentum, Williams Percent Range, CCI, Force Index, WPR, DeMarker, CCI, RSI and Stochastic, it is clear that the fundamental indicators have being u
MACD Divergence
Sergey Deev
2.5 (2)
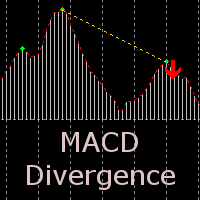
The indicator detects divergence signals - the divergences between the price peaks and the MACD oscillator values. The signals are displayed as arrows in the additional window and are maintained by the messages in a pop-up window, e-mails and push-notifications. The conditions which formed the signal are displayed by lines on the chart and in the indicator window. Indicator Parameters MacdFast - fast MACD line period MacdSlow - slow MACD line period MacdSignal - MACD signal line period MacdPric
Next level of trend trading here. Possibility 75%, the indicator analyzes the current market to determine short (small dot), middle (circle with a dot inside) and long (cross with a circle and a dot inside) trends.  Wingdings characters of  Aqua color represents the beginning of the UP trend. Wingdings characters of  Orange color represents the beginning of the DOWN trend. Possibility 75% Indicator will improve your trading in the world of forex, commodities, cryptocurrencies and indices.
VR Cub
Vladimir Pastushak
VR Cub è un indicatore per ottenere punti di ingresso di alta qualità. L'indicatore è stato sviluppato per facilitare i calcoli matematici e semplificare la ricerca dei punti di ingresso in una posizione. La strategia di trading per la quale è stato scritto l'indicatore ha dimostrato la sua efficacia per molti anni. La semplicità della strategia di trading è il suo grande vantaggio, che consente anche ai trader alle prime armi di commerciare con successo con essa. VR Cub calcola i punti di apert
Dear traders this is Our new Indicator called Hull Pro MTF Indicator — Precision Multi-Timeframe Trend Visualizer Overview The Hull Pro MTF Indicator is a next-generation Heiken-Ashi-based multi-timeframe visual tool designed for top-down market analysis . It blends the power of Hull Moving Average (HMA) logic and multi-level Heiken-Ashi smoothing to reveal directional bias, volatility ranges, and price symmetry across hourly, daily, weekly, monthly, and yearly structures — all in a single c
Divergence Matrix Pro for MetaTrader 4 Divergence Matrix Pro is a confirmed multi-oscillator divergence indicator for MetaTrader 4. It detects regular and hidden divergence between price and selected oscillators, then presents the confirmed structure through divergence lines, pivot labels, action markers, an optional current-timeframe Matrix Panel and optional alerts. The indicator is an analysis and confirmation tool. It does not open or close trades, and the signal score is not a win rate or a
Introduction It is common practice for professional trades to hide their stop loss / take profit from their brokers. Either from keeping their strategy to the themselves or from the fear that their broker works against them. Using this indicator, the stop loss / take profit points will be drawn on the product chart using the bid price. So, you can see exactly when the price is hit and close it manually.  Usage Once attached to the chart, the indicator scans the open orders to attach lines for t
GMMA Trade X is an EA based on GMMA. GMMA parameters such as MovingAveragePeriod1-24, MovingAverageMAShift1-24, MovingAverageShift1-24 and CandlestickShift1-24 can be adjusted. GMMA Trade X applies BTN TECHNOLOGY's state-of-the-art intelligent technology to help you create optimal results for your trades. May your dreams come true through GMMA Trade X. Good luck. = == == Inquiries = == == E-Mail:support@btntechfx.com
Gold Trader Pro Indicator
Massimiliano Tuzzolino
4.43 (7)
Gold Trader Pro is an advanced analytical tool specifically engineered for professional trading on XAUUSD (Gold). It provides an immediate comprehensive overview of market structure across 7 different timeframes, allowing traders to identify flow direction and signal strength through a modern, draggable, and interactive interface. Key Features Multi-Timeframe Analysis: Real-time monitoring of M1, M5, M15, M30, H1, H4, and D1. Two Operational Modes: MODE_SCALPING: Optimized for fast-paced analys
FREE
GeoWprPro
Georgij Komarov
WPR by Profile, or WPR for Professionals Geo_WprPro is one of the well-known currency profile indicators. It simultaneously displays two WPR indicators with different parameters in the matrix form on all timeframes of multiple currency pairs forming the currency profile . As follows from the description, " WPR is a leading indicator that often goes ahead of the price chart. The oscillator frequently reaches extreme values before the price reversal as if anticipating that event: it almost always
Market Structure Zig Zag
Lesedi Oliver Seilane
4.67 (30)
Free Market structure zig zag to assist in price action trading the screenshots describe how to use and how to spot patterns new version comes with alerts, email alert and  push notification alert can be used on all pairs  can be used on all timeframes  you can add additional confirmation indicators the indicator shows you your higher high and low highs as well as your lower lows and lower highs  the indication makes price action analysis easier to spot.
FREE
Free automatic Fibonacci is an indicator that automatically plots a Fibonacci retracement based on the number of bars you select on the BarsToScan setting in the indicator. The Fibonacci is automatically updated in real time as new highest and lowest values appears amongst the selected bars. You can select which level values to be displayed in the indicator settings. You can also select the color of the levels thus enabling the trader to be able to attach the indicator several times with differe
FREE
Prime Strike Signal
Camila Bernardez Camero
Prime Strike Signal – Ingresso Chiaro. Nessun Repaint. Prime Strike Signal No Repaint Never è uno strumento di segnale semplice e basato su regole, pensato per i trader che cercano chiarezza visiva e coerenza in condizioni di mercato volatili. Rileva i cambi di direzione con frecce immediate sul grafico, aiutandoti a restare allineata ai movimenti di prezzo a breve termine senza complicazioni inutili. Rimani Aggiornata Unisciti al canale ufficiale per restare informata su nuove versioni e agg
Quantum Falcon Signal Free is a smart visual trading indicator for MetaTrader 4 designed for Forex and Gold traders. The indicator combines: • Trend analysis • RSI momentum confirmation • MACD momentum filtering • ATR volatility filtering • Higher timeframe confirmation • Smart exit signal detection Main Features: • Smart Buy and Sell signals • Exit Buy / Exit Sell alerts • Real-time dashboard on chart • Professional candle arrows • Multi-timeframe trend confirmation • ATR market volatility filt
FREE
The Wing Patterns indicator scans for many different kinds of Patterns using an XABCD structure. The term Wing Pattern is used to refer to all types of patterns based on a general XABCD structure, which is plotted in an alternate high-low extreme form. In other words, assume that point X is started at a low point on the chart. The point A is plotted at the next highest point within a certain number of bars. This certain number of bars is called the depth level. In this example, point B would be
Robot scalper per timeframe M5. Negozia sulla coppia di valute GBPUSD. Questo robot è stato sviluppato appositamente da un'azienda di trader professionisti per il trading con la sterlina. Il robot apre approssimativamente da 5 a 15 operazioni al giorno. È meglio fare trading con broker che hanno uno spread basso su GBPUSD fino a 10 pip. Il deposito minimo consigliato per iniziare è di $ 500 o più. vantaggi: non usa martingala. non una rete. ogni operazione ha uno stop loss. bot professionale s
Trend Ray
Andriy Sydoruk
The indicator shows the potential trend direction by cyclical-wave dependence. Thus, all the rays of the intersection will be optimal rays, in the direction of which the price is expected to move, taking into account the indicator period. Rays can be used as a direction for potential market movement. But we must not forget that the approach must be comprehensive, the indicator signals require additional information to enter the market.
El indicador "MR BEAST ALERTAS DE LIQUIDEZ" es una herramienta avanzada diseñada para proporcionar señales y alertas sobre la liquidez del mercado basándose en una serie de indicadores técnicos y análisis de tendencias. Ideal para traders que buscan oportunidades de trading en función de la dinámica de precios y los niveles de volatilidad, este indicador ofrece una visualización clara y detallada en la ventana del gráfico de MetaTrader. Características Principales: Canal ATR Adaptativo: Calcula
FairyFibo
Syed Oarasul Islam
FairyFibo  can generate as many as 70 different BUY signals and 70 different SELL signals solely based on Price Action and Fibonacci levels. The idea is to catch as many as Swing High's and Swing Low's but with the consideration of the current trend mind. This indicator can be also used for Binary Options Trading as most of the time price tends to follow the signal direction immediately. Most of the strategies are already optimized for different time frames and different market conditions. While
Questo indicatore funziona con la teoria delle onde di Elliott in due modi: Modalità automatica: In questa modalità, l'indicatore rileverà automaticamente le cinque onde motrici sul grafico in conformità alla teoria delle onde di Elliott. Fornirà previsioni e individuerà potenziali zone di inversione. Inoltre, avrà la capacità di generare avvisi e messaggi push per informare i trader sugli sviluppi importanti. Questa funzionalità automatica semplifica il processo di identificazione e analisi dei
Galactic Volume spread analysis (VSA), is an indicator designed for the visualization of the Volume, and the proportion in which it affects the volatility of the spread of the different pairs. The strategy consists of the following: Bull Trend: Always going in favor of the trend, open buying operations at the lows of the trend, provided that it coincides with a high volume shown by the Galactic VSA indicator. Downtrend: Always going in favor of the trend, open sales operations at the highs of
Diamond Grail
Dmitriy Kashevich
The universal indicator Diamond Grail which received such a name is not so simple! The indicator has been tested for over a year by our experts! One of the best arrow indicators that is perfect for binary options and forex trading, If you trade on binary options, the best ragtime for it is from 3 minutes to a maximum of 5 minutes An arrow appears on the previous candle. If you trade forex, then the opening time from candle to candle Forex result From 40 To 1324 pips! Profitability of Diam
Chart Patterns Detect 15 patterns (Ascending Triangle, Descending Triangle, Rising Wedge, Falling Wedge, Bullish Flag, Bearish Flag, Bullish Rectangle, Bearish Rectangle Symmetrical triangle, Head and Shoulders, Inverted Head and Shoulders, Triple top, Triple Bottom, Double Top, Double Bottom) Use historical data to calculate the probability of each pattern to succeed (possibility to filter notification according to the chance of success) gives graphic indication about the invalidation level and
Gli utenti di questo prodotto hanno anche acquistato
PowerTech Prop Trading System PRO Intraday mapping, multi-source macroeconomic filtering, high-timeframe structural liquidity, and account risk control architecture engineered natively for MetaTrader 4 (MT4). Built specifically for Prop Firm Traders, Funded Account Challengers, and Day Traders, PowerTech Prop Trading System PRO organizes your intraday workflow directly on the chart: Asian/Tokyo accumulation boxes, multi-tier breakout target expansions, live prop-firm exposure tracking, automa
Miraculous Indicator Binary & Forex v3 StrategySafe Miraculous Indicator Binary & Forex v3 StrategySafe è un indicatore professionale progettato per trader che cercano segnali chiari, strumenti di conferma avanzati e un metodo strutturato per operare sui mercati Binary e Forex. La versione v3 include MIR Dashboard, Miraculous Confirmation Dashboard, GANN Law, livelli Square of 9, angoli GANN e una modalità Forex più completa per un’analisi di mercato più precisa. Caratteristiche principali Modal
OrderFlow Absorption – Indicatore professionale di Delta e Segnali di Assorbimento per MT4 Sblocca la potenza della vera analisi del flusso degli ordini con OrderFlow Absorption – l’indicatore definitivo di istogramma delta e segnali di assorbimento per MetaTrader 4. Progettato per i trader che vogliono vedere cosa succede davvero dietro ogni movimento di prezzo, questo strumento rivela la pressione nascosta di acquisto/vendita e gli eventi di assorbimento che muovono il mercato. Caratteristiche
CVD Divergenza Rilevazione - Analisi Avanzata del Delta Volume   IL PROBLEMA CHE RISOLVIAMO La maggior parte dei trader si affida esclusivamente all'azione del prezzo, perdendo informazioni cruciali sul flusso di volume che rivelano il vero sentiment del mercato. Gli indicatori tradizionali sono in ritardo rispetto ai movimenti di prezzo, causando entrate tardive e cattiva gestione del rischio. CVD Divergenza Rilevazione risolve questo analizzando la relazione tra prezzo e momentum del delta
FFx Engulfing Setup Alerter gives trade suggestions with Entry, Target 1, Target 2 and StopLoss. Below are the different options available: Entry suggestion - pips to be added over the break for the entry 3 different options to calculate the SL - by pips, by ATR multiplier or at the pattern High/Low 3 different options to calculate the 2 TPs - by pips, by ATR multiplier or at Risk/Reward Offset the dashboard - any place on the chart Remove the suggestion once the price reached the SL line Lines
FFx InsideBar Setup Alerter gives trade suggestions with Entry, Target 1, Target 2 and StopLoss. Below are the different options available: Entry suggestion - pips to be added over the break for the entry Minimum candle size - to avoid too close buy/sell entry suggestions 3 different options to calculate the SL - by pips, by ATR multiplier or at the pattern High/Low 3 different options to calculate the 2 TPs - by pips, by ATR multiplier or at Risk/Reward Offset the dashboard - any place on the c
FFx OutsideBar Setup Alerter gives trade suggestions with Entry, Target 1, Target 2 and StopLoss. Below are the different options available: Entry suggestion - pips to be added over the break for the entry. 3 different options to calculate the SL - by pips, by ATR multiplier or at the pattern High/Low. 3 different options to calculate the 2 TPs - by pips, by ATR multiplier or at Risk/Reward. Offset the dashboard - any place on the chart. Remove the suggestion once the price reached the SL line.
FFx PinBar Setup Alerter gives trade suggestions with Entry, Target 1, Target 2 and StopLoss. Below are the different options available: Entry suggestion - pips to be added over the break for the entry Minimum candle size - to avoid too small candles 3 different options to calculate the SL - by pips, by ATR multiplier or at the pattern High/Low 3 different options to calculate the 2 TPs - by pips, by ATR multiplier or at Risk/Reward Offset the dashboard - any place on the chart Remove the sugges
Automatic, live & interactive picture of all trendlines. Assign push, email and sound alerts to the lines of your choice and be informed about price rollback, breakout, rollback after breakout, number of rollbacks, line expiration by double breakout. Correct, drag or delete the lines and interactively tune the line system. https://youtu.be/EJUo9pYiHFA . Chart examples https: //www.mql5.com/en/users/efficientforex Price Interaction Events All events are effective immediately and only after one
The purpose of this new version of the MT4 standard indicator provided in your platform is to display in a sub-window multiple timeframes of the same indicator with its divergences. See the example shown in the picture below. But the display isn't like a simple MTF indicator. This is the real display of the indicator on its timeframe. Here's the options available in the FFx divergences indicator: Select the timeframes to be displayed (M1 to Monthly) Define the width (number of bars) for each tim
The purpose of this new version of the MT4 standard indicator provided in your platform is to display in a sub-window multiple timeframes of the same indicator with its divergences. See the example shown in the picture below. But the display isn't like a simple MTF indicator. This is the real display of the indicator on its timeframe. Here's the options available in the FFx divergences indicator: Select the timeframes to be displayed (M1 to Monthly). Define the width (number of bars) for each ti
The FFx Dashboard MTF alerter will show you on a single chart all the timeframes (M1 to Monthly) with their own status for the indicator. 2 Alert Options: Single timeframe: each selected timeframe alert separately when a signal occurs Multi timeframes: all selected timeframes must agree for an alert to be triggered Both options have an input to select the timeframes to be used for the alert(s). How to Understand the Status: Green/Red square: histogram above/below 0 line Green square + Red bord
The FFx Dashboard MTF alerter will show you on a single chart all the timeframes (M1 to Monthly) with their own status for the indicator. 2 Alert Options: Single timeframe: each selected timeframe alert separately when a signal occurs Multi timeframes: all selected timeframes must agree for an alert to be triggered Both options have an input to select the timeframes to be used for the alert(s). How to understand the status: Green/Red square: RSI above/below 50 line Green square + Red border: R
The FFx Dashboard MTF alerter will show you on a single chart all the timeframes (M1 to Monthly) with their own status for the indicator. 2 Alert Options: Single timeframe: each selected timeframe alert separately when a signal occurs Multi timeframes: all selected timeframes must agree for an alert to be triggered Both options have an input to select the timeframes to be used for the alert(s). How to understand the status: Green/Red square: Stoch above/below 50 line Green square + Red border:
The FFx Dashboard MTF alerter will show you on a single chart all the timeframes (M1 to Monthly) with their own status for the indicator. 2 Alert Options: Single timeframe: each selected timeframe alert separately when a signal occurs Multi timeframes: all selected timeframes must agree for an alert to be triggered Both options have an input to select the timeframes to be used for the alert(s). How to understand the status: Green/Red square: Price above/below Cloud (Kumo) Green square + Red bo
The FFx Dashboard MTF alerter will show you on a single chart all the timeframes (M1 to Monthly) with their own status for the indicator. 2 Alert Options: Single timeframe: each selected timeframe alert separately when a signal occurs Multi timeframes: all selected timeframes must agree for an alert to be triggered Both options have an input to select the timeframes to be used for the alert(s). How to understand the status: Green/Red square: MA pointing Up/Down Green square + Red border: MA po
The FFx Dashboard MTF alerter will show you on a single chart all the timeframes (M1 to Monthly) with their own status for the indicator. 2 Alert Options: Single timeframe: each selected timeframe alert separately when a signal occurs. Multi timeframes: all selected timeframes must agree for an alert to be triggered. Both options have an input to select the timeframes to be used for the alert(s). How to understand the status: Green square: Price above PSAR Red square: Price below PSAR Options
The FFx Dashboard MTF alerter will show you on a single chart all the timeframes (M1 to Monthly) with their own status for the indicator. 2 Alert Options: Single timeframe: each selected timeframe alert separately when a signal occurs Multi timeframes: all selected timeframes must agree for an alert to be triggered Both options have an input to select the timeframes to be used for the alert(s). How to understand the status: Green/Red square: CCI above/below levels (ie. 100/-100) Grey square: C
The FFx Dashboard MTF alerter will show you on a single chart all the timeframes (M1 to Monthly) with their own status for the indicator. 2 Alert Options: Single timeframe: each selected timeframe alert separately when a signal occurs Multi timeframes: all selected timeframes must agree for an alert to be triggered Both options have an input to select the timeframes to be used for the alert(s). How to understand the status: Green/Red square: ADX above level Grey square: ADX below level Red bor
The FFx Dashboard MTF alerter will show you on a single chart all the timeframes (M1 to Monthly) with their own status. 2 Alert Options: Single timeframe: each selected timeframe alert separately when a signal occurs Multi timeframes: all selected timeframes must agree for an alert to be triggered Both options have an input to select the timeframes to be used for the alert(s). How to understand the status: Green/Red square: bullish/bearish candle Options available in the FFx Dashboard Alerter
The indicator of a Professional Trader is an arrow indicator for predicting the direction of price movement. I have been working on this indicator since 2014. You can use this indicator as your main indicator, use its entry signals, and use it as your only indicator to find entry points. About the product: Recommended TF [H4-D1-W1]   . The indicator predicts the direction of the next candle. Fits a variety of tools; Flexibility in settings for different instruments and intervals through the MO
The [GRAFF] III manual trading system is based on multiple MetaTrader (MT4) indicators. Together, the entire PACK of GRAFF III indicators makes an advanced trading tool. The system consists of over 20 different custom-built indicators which have been carefully selected and tested in the long term to produce strong and efficient trading signals. The particular indicators are based on different mathematical formulas, so the entire system is calibrated to remove false signals from its own indicator
This indicator allows you to see the strength of the trend on all timeframes. It can be used for all currency pairs. The indicator can be displayed in the form of a column (from left to right): status buy / sell / strong buy / strong sell, strength of the trend in percentage, pips last candle, body candle now, remaining time, and the timeframe of M1 to MN. Information contained below (from left to right): total trend percent, sell percent, buy percent.
FFx Universal Strength Meter PRO is more than a basic strength meter. Instead of limiting the calculation to price, it can be based on any of the 19 integrated strength modes + 9 timeframes. With the FFx USM, you are able to define any period for any combination of timeframes. For example, you can set the dashboard for the last 10 candles for M15-H1-H4… Full flexibility! Very easy to interpret... It gives a great idea about which currency is weak and which is strong, so you can find the best pai
A simplistic indicator informing a user on RSI divergence by sending messages to mobile device and email. The indicator draws 2 vertical lines, marking two RSI extrema that formed the divergence. You get the alert, open the charts and make a decision. The indicator does not show past divergences, thus when you attach it to a chart for the first time you see nothing. Graphics and alerts will appear as soon as divergences do. Drop it in Tester to see how it works. Parameters: RSIPeriod - number of
ZLevels
Sergio Andres Zuleta Lopez
This indicator is based on Market Profile methodology, which contains the Z-Zone , unlike the latter, allows visualization of multiple time frames on the same graph. This methodology has proven to be very effective for: Reduce the number of windows required to analyze or track a financial asset. Display important resistance areas (ROZ), support (SoZ) and average distribution (PoC) in different periods of time. Define areas to take profits as well locate technical stop loss. Analysis in the devel
Pan PrizMA CD Phase is an analogue of the МetaТrader 5 indicator , and is an option based on the Pan PrizMA indicator. Details . Averaging by a quadric-quartic polynomial increases the smoothness of lines, adds momentum and rhythm. Extrapolation by the sinusoid function near a constant allows adjusting the delay or lead of signals. The value of the phase - wave status parameter (which is close in meaning to the trigonometric phase or the angle of the radius-vector rotation in the trigonometric p
Altri dall’autore
General Information. The SWT basic indicator is the main indicator of the SWT method — a method for quantitative analysis of financial markets. The method is based on decomposing the price chart of a financial instrument into a basis of Stochastic Wave Trends (SWT-Method). The complete toolkit of the method includes: the SWT basic indicator — the main indicator of the system; the SWTch peak volatility channel indicator; the SWTsr support/resistance channel indicator; the SWTtr digital trend ind


Filtro:
Nessuna recensione
Rispondi alla recensione