Smif
- Indicatori
-
Hlomohang John Borotho
 Quantitative intraday trading strategies
· MQL5 Expert Advisor development ·
Python + AI automation for MetaTrader 5.
Built by a developer who actually trades. - Versione: 1.0
Smif — Statistical Market Inflection Forecasting
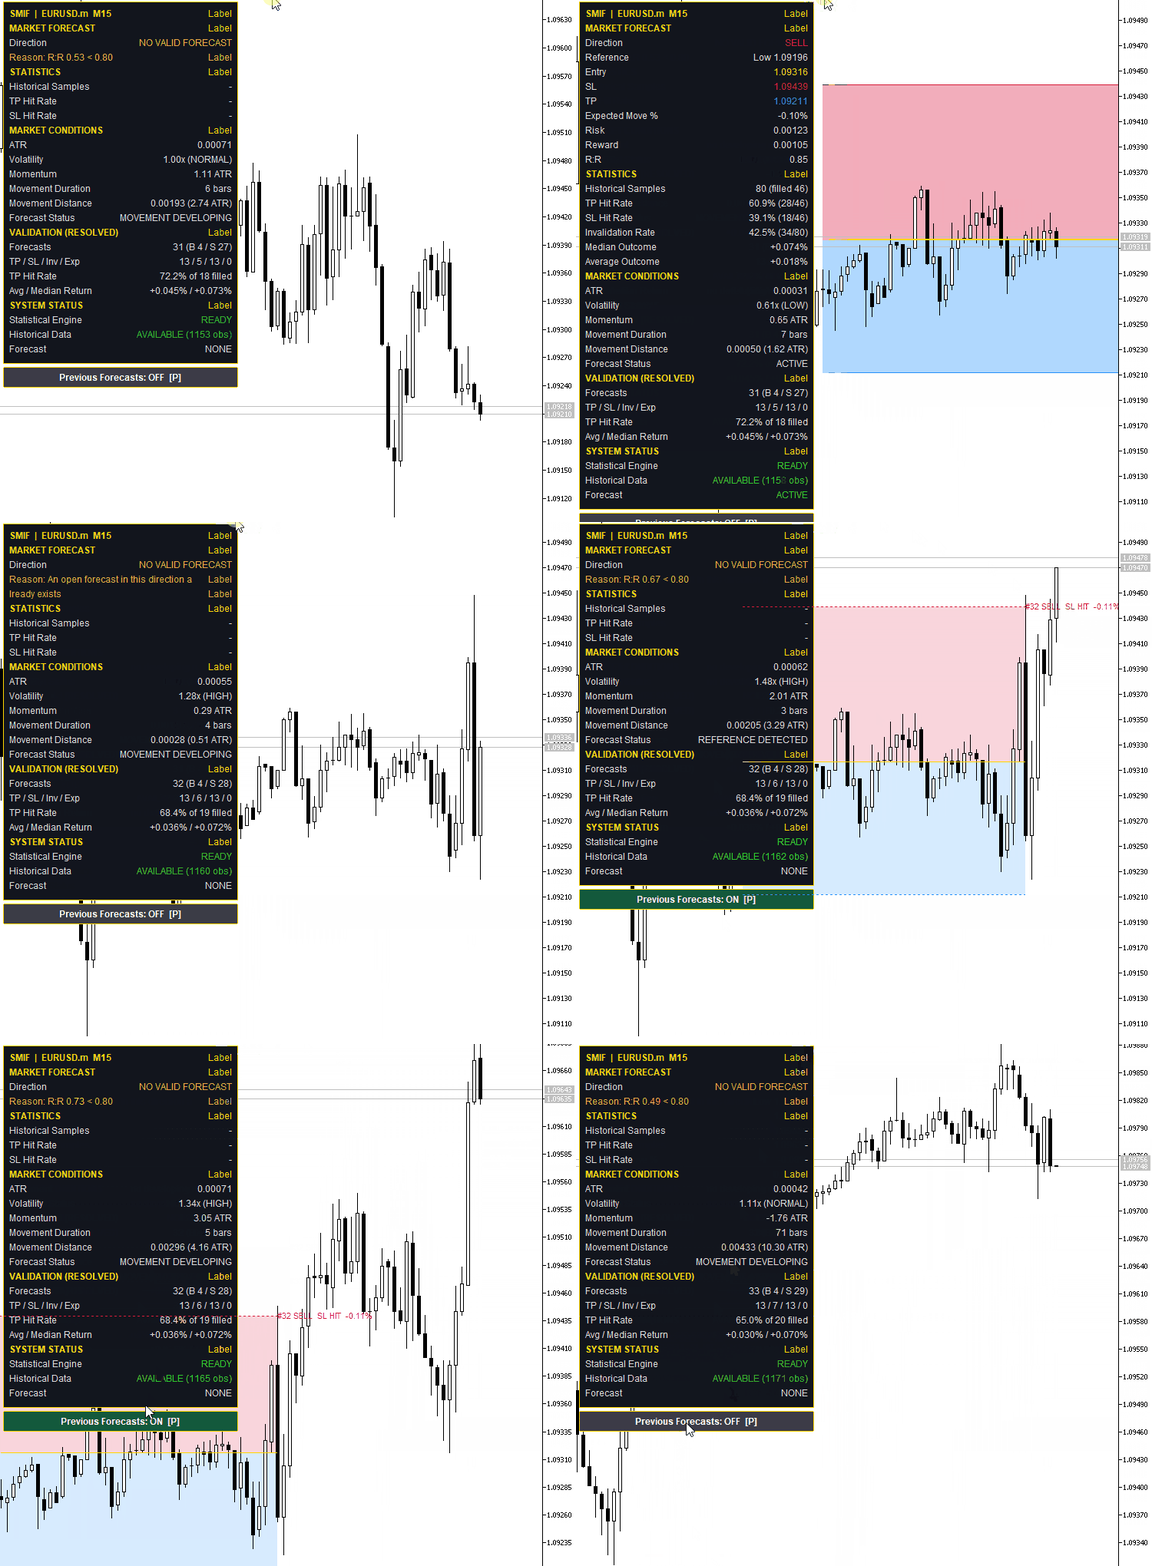
Smif shows where the current price move is likely to run out of steam, and what has typically happened after moves like it. Instead of fixed pip targets, every forecast is based on how this symbol has actually behaved in the past. Each one shows a suggested entry, stop loss and take profit, the number of past cases behind it, and how often those levels were reached. When there isn't enough evidence for a solid setup, Smif shows no forecast at all and tells you why.
Main features:
- Entry, stop loss and take profit drawn on the chart as risk and reward zones
- Hit rates and sample sizes shown with every forecast, so you can judge how strong each one is
- Forecasts never repaint, and finished ones are cleared from the chart automatically
- A "Previous Forecasts" button (or the P key) shows past forecasts and how each one ended: target reached, stop hit or cancelled
- A dashboard with the current forecast, market conditions and the indicator's track record on your chart
- Optional CSV export of every forecast for your own analysis
- Works on any symbol and any timeframe from M1 to D1
How to use it:
- Attach Smif to any chart. Give it a moment on first load while it reads the price history.
- Wait for a forecast. Until a setup meets the quality filters, the dashboard shows "NO VALID FORECAST" with the reason.
- When a forecast appears, treat it as a planned trade: the gold line is the suggested entry, the red zone the risk and the blue zone the target. A dashed entry line means price hasn't reached the entry yet. A solid line means it has.
- Check the hit rates and sample size before you act. Larger samples and higher hit rates mean stronger evidence.
- Press P now and then to review past forecasts and see how Smif has performed on that symbol and timeframe.
- To see forecasts more often, loosen the filters in the inputs. For fewer but better-supported forecasts, tighten them.
Smif is an analysis tool and does not place trades. Its forecasts describe what has happened in similar past conditions; they don't guarantee what price will do next. Use them together with your own analysis and risk management.