Super Trend Canvas
- Indicatori
- Versione: 4.0

Overview
The Super Trend Canvas is a volatility-based trend-following indicator designed for MetaTrader 5. Built on the Average True Range (ATR), it dynamically adjusts to market conditions to provide a visual representation of the current trend direction.
This indicator is primarily developed to help traders filter out market noise and identify sustained directional momentum, featuring a transparent graphical cloud that highlights the trend zones.
Key Features
- Dynamic Trend Lines: Calculates trailing levels based on market volatility (ATR).
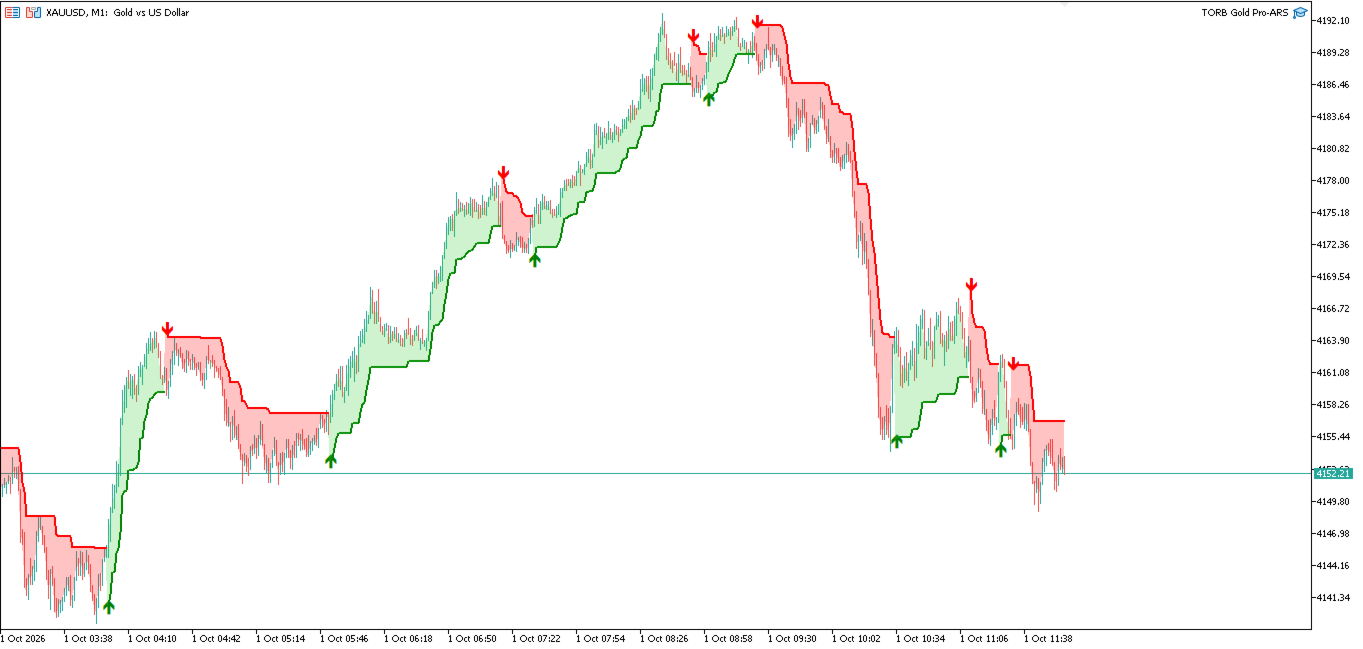
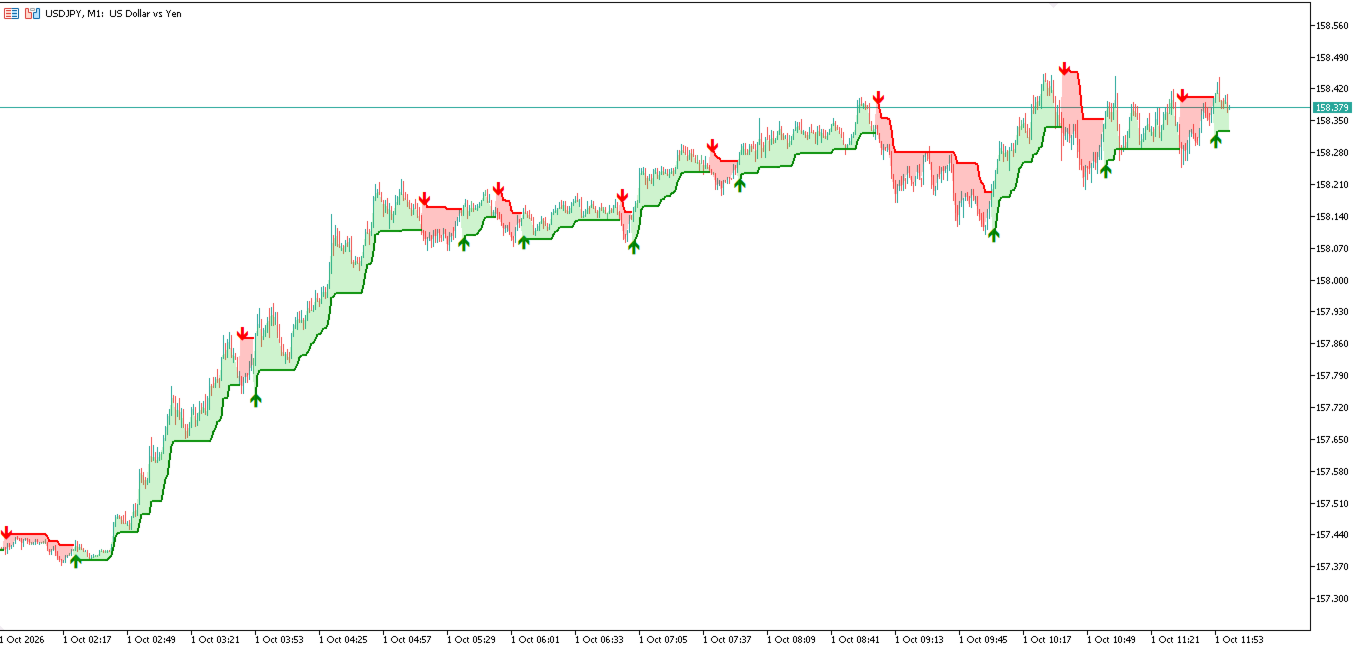
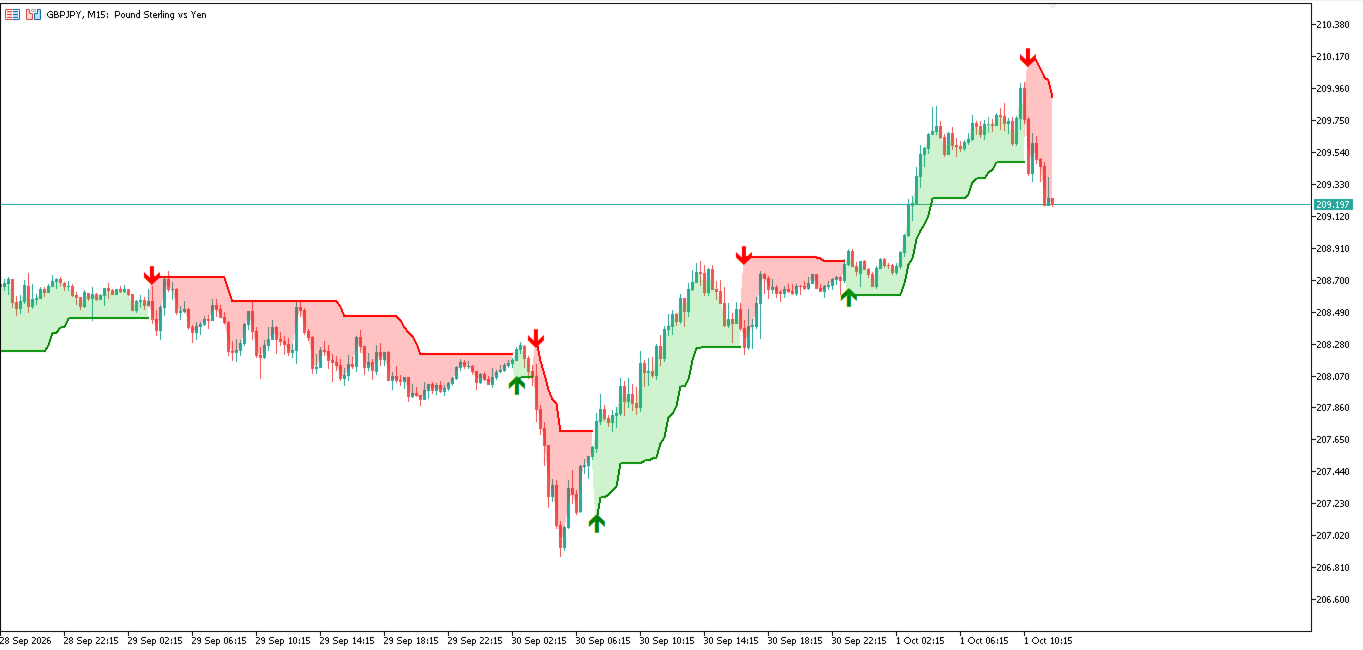
- Trend Visualization: Displays the trend direction on the chart (default: green line for uptrends, red line for downtrends).
- Transparent Trend Cloud: Includes a graphical cloud feature (Canvas-based) that fills the area between the price and the indicator line for enhanced visibility.
- Signal Arrows: Plots visual arrows on the chart indicating potential trend reversals.
Market Environments
The functionality of this indicator depends heavily on the market state:
- Trending Markets: The indicator is intended for markets exhibiting clear directional movements.
- Sideways Markets: It is not recommended to use this indicator in isolation during flat or consolidating markets, as ranging prices may generate false signals.
Indicator Parameters
The indicator settings can be adjusted according to your preferences:
- CalcTimeframe: Select the specific timeframe for the ATR calculation.
- AtrPeriod: Defines the number of historical bars used for the ATR calculation. Default is 10.
- AtrMultiplier: The factor multiplied by the ATR value to offset the indicator line from the price. Default is 3.0.
- ShowSignals: Enable or disable buy and sell signal arrows on the chart.
- ShowCloud: Enable or disable the transparent trend cloud.
- CloudUpColor / CloudDownColor: Customize the colors of the up and down trend clouds.
- CloudOpacity: Adjust the transparency level of the cloud (0 for transparent, 255 for solid).
- DebugMode: Prints developer messages to the Experts log when enabled.
Usage Guidelines
The indicator provides simple visual information:
- Uptrend Shift: Occurs when the price closes above the Super Trend line, and the line color shifts to the configured uptrend color.
- Downtrend Shift: Occurs when the price closes below the Super Trend line, and the line color shifts to the configured downtrend color.
- Trailing Stop Application: The indicator line can be utilized as a reference point for manual trailing stop-loss management.
Note: The Super Trend Canvas is an analytical tool. It is highly recommended to use it in conjunction with other technical analysis methods, such as Moving Averages, for signal confirmation.