Multi Candle N Pattern Filter Signals Arrow MT5
- Indicatori
- Versione: 1.66
- Attivazioni: 5

MULTI CANDLE PATTERN MULTI FILTER SIGNALS
No-Repaint Buy and Sell Arrows for MetaTrader 5
════════════════
PRODUCT TYPE
════════════════
Type : Technical Indicator
Platform : MetaTrader 5
Display : Chart window arrows
Markets : Forex, Gold, Indices, Crypto, Stocks, Oil
Timeframes : All timeframes (M1 to MN)
Signals : BUY and SELL arrows after candle close
Repaint : No. Forming candle stays empty
Version logic : Multi candle pattern + optional multi filter stack
Alerts : Popup, sound, push notification, Experts log
════════════════
SHORT OVERVIEW
════════════════
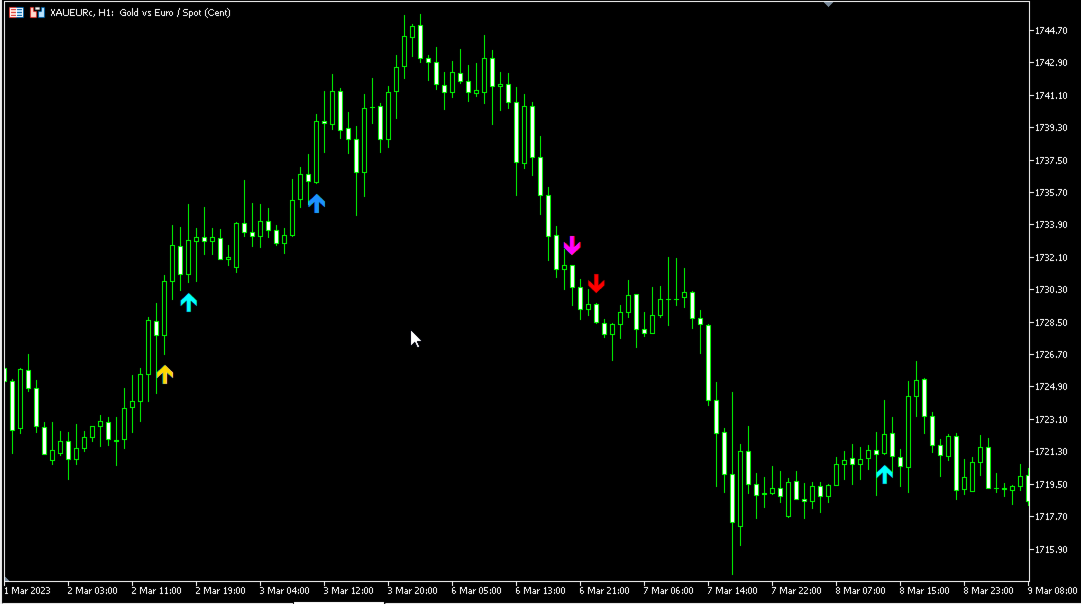
This indicator finds 4-candle, 5-candle, and 6-candle pullback continuation patterns and plots Buy or Sell arrows on the chart. Each pattern needs a run of same-color candles, one opposite pullback candle, then a confirmation candle in the original direction.
You can keep the raw price-action signals or stack optional filters: RSI, ADX, Moving Average, Ichimoku Senkou Span B, RSI 75, Double MA, Awesome Oscillator, Parabolic SAR, Heiken Ashi, CCI, RVI, MACD, Support and Resistance, and Fibonacci zones from swing points.
The main extra value is control. You choose which pattern lengths to show, which filters must agree, and how alerts are sent. Signals are calculated only on closed bars so arrows do not jump on the live candle.
This tool does not open or close trades. It is a visual and alert assistant. Always test on a demo account and use your own risk rules.
════════════════
WHY THIS INDICATOR STANDS OUT
════════════════
1. Three pattern lengths in one tool
4C is faster. 5C needs a longer run. 6C is the strictest. You can use one, two, or all three.
2. Built-in body quality check
The original body filters reject weak pullbacks and weak confirmation candles. The pullback body should be smaller than the previous body. The confirmation body should be larger than the pullback body.
3. Senkou Span B direction lock
When enabled, price above Senkou Span B allows Buy arrows only. Price below allows Sell arrows only. The line uses the standard forward shift so the filter follows the Ichimoku cloud idea.
4. Modular filter stack
Every extra filter starts OFF except the original body filters. Add only what you need. Too many filters at once can hide almost all arrows.
5. No-repaint drawing
The loop stops before the current forming bar. That bar is forced empty. An alert fires once when a new closed bar actually has a signal.
6. Six separate arrow plots
BUY 4C, SELL 4C, BUY 5C, SELL 5C, BUY 6C, and SELL 6C use different colors so you can see which pattern triggered.
7. Alert pack
Terminal popup, sound file, mobile push (MetaQuotes ID), and Experts log comment. Anti-spam logic blocks repeat alerts on the same bar time.
════════════════
HOW THE PATTERNS WORK
════════════════
BUY 4C
Candle 1 bullish, candle 2 bullish, candle 3 bearish pullback, candle 4 bullish confirmation.
SELL 4C
Candle 1 bearish, candle 2 bearish, candle 3 bullish pullback, candle 4 bearish confirmation.
BUY 5C
Three bullish candles, one bearish pullback, one bullish confirmation.
SELL 5C
Three bearish candles, one bullish pullback, one bearish confirmation.
BUY 6C
Four bullish candles, one bearish pullback, one bullish confirmation.
SELL 6C
Four bearish candles, one bullish pullback, one bearish confirmation.
In all cases the last closed candle is the confirmation candle. The arrow is drawn on that closed bar.
Body filter meaning
UseFilter1 : pullback body must be smaller than the previous candle body.
UseFilter2 : confirmation body must be larger than the pullback body.
Both ON is the stricter original setup. Turn one or both OFF if you want more signals.
════════════════
WHAT EACH FILTER DOES
════════════════
RSI Cross Filter
Buy only if RSI crosses up through the oversold level. Sell only if RSI crosses down through the overbought level. This is a timing filter, not a simple RSI above 50 filter.
ADX Filter
Both sides need ADX at or above your minimum. Weak trend conditions are blocked.
Single MA Filter
Buy if close is above the MA. Sell if close is below the MA.
Senkou Span B Filter
Compares close with Senkou Span B after the forward shift. Above = Buy only. Below = Sell only. Equal or invalid values block both sides.
RSI 75 Filter
Uses a longer RSI. Buy if RSI is above 50. Sell if RSI is below 50.
Double MA Filter
Buy if fast MA is above slow MA. Sell if fast MA is below slow MA.
Awesome Oscillator Filter
Optional strength, color, and zero-line rules:
- Volume style: AO must be at least AO_Buy_Min for Buy, or at most AO_Sell_Max for Sell.
- Color style: AO must rise for Buy and fall for Sell.
- Zero style: Buy needs rising AO above zero. Sell needs falling AO below zero.
Parabolic SAR Filter
Buy if close is above SAR. Sell if close is below SAR.
Heiken Ashi Filter
Internal Heiken Ashi candles. Buy if HA close is above HA open. Sell if HA close is below HA open.
CCI Trend Filter
Buy if CCI is above 0. Sell if CCI is below 0.
CCI Overbought Oversold Filter
Buy if CCI is above the overbought level. Sell if CCI is below the oversold level. This is a momentum-extreme filter, not a mean-reversion exit tool.
RVI Trend Filter
Buy if RVI is above 0. Sell if RVI is below 0.
RVI Signal Filter
Buy if RVI main is above RVI signal. Sell if RVI main is below RVI signal.
MACD Signal Filter
Uses MACD histogram (main minus signal). Buy if histogram is above 0. Sell if histogram is below 0.
MACD Zero Filter
Buy if MACD main is above 0. Sell if MACD main is below 0.
Support and Resistance Filter
Looks back SR_Period bars for recent high and low. Buy needs a touch or pierce of support plus a point zone. Sell needs a touch or pierce of resistance plus a point zone.
Fibonacci Filter
Finds recent swing high and swing low with ZigZag-style depth, deviation, and backstep. Builds a zone between Fib_Level_1 and Fib_Level_2. Both Buy and Sell also need price to touch that zone. If no valid swings are found, both sides are blocked.
All enabled filters must agree. One failed filter removes that side for that bar.
════════════════
FULL INPUT GUIDE
════════════════
>>> Arrow Settings
ArrowOffset
Distance of the arrow from the candle high or low, in points. 100 means 100 points. On 5-digit Forex that is usually 10 pips. Raise it if arrows cover wicks. Lower it if arrows sit too far from price.
>>> Enable Signals
UseSinyal1
true = show 4-candle arrows. false = hide them.
UseSinyal2
true = show 5-candle arrows. false = hide them.
UseSinyal3
true = show 6-candle arrows. false = hide them.
Tip: start with all three ON. If the chart is crowded, keep 5C and 6C only.
>>> Signal Colors
BuyColor1 / SellColor1
Colors for 4-candle arrows. Default aqua and red.
BuyColor2 / SellColor2
Colors for 5-candle arrows. Default dodger blue and dark orange.
BuyColor3 / SellColor3
Colors for 6-candle arrows. Default gold and magenta.
>>> Body Length Filter
UseFilter1
true = reject a pullback that is as large as, or larger than, the previous body.
UseFilter2
true = reject a confirmation candle that is not larger than the pullback body.
>>> RSI Cross Filter
Use_RSI_Cross_Filter
false by default. Set true to require the RSI cross.
RSI_Length
RSI period for the cross filter. Default 14.
RSI_Price_Source
Price used by RSI. Default Close.
Oversold
Buy cross level. Default 30.
Overbought
Sell cross level. Default 70.
>>> ADX Filter
Use_ADX_Filter
false by default.
ADX_Period
ADX calculation period. Default 10.
ADX_Min_Level
Minimum ADX value. Default 20. Higher values keep only stronger trends.
>>> Single MA Filter
Use_MA_Filter
false by default.
MA_Period
Moving average length. Default 50.
MA_Method
SMA, EMA, SMMA, or LWMA. Default SMA.
MA_Shift
Forward or backward shift of the MA. Default 0.
>>> Senkou Span B Filter
Use_SenkouB_Filter
false by default. This is the Ichimoku cloud-base filter.
SenkouB_Period
Period used for Senkou Span B. Default 52.
SenkouB_Shift
Forward shift. Default 26, the common Ichimoku displacement.
Read this carefully: the value compared with the current close is the Senkou Span B value calculated SenkouB_Shift bars earlier. That matches the line you see under the current candle on a standard Ichimoku chart.
>>> RSI 75 Filter
Use_RSI75_Filter
false by default.
RSI_Filter_Period
Long RSI period. Default 75. Buy above 50, Sell below 50.
>>> Double MA Filter
Use_DoubleMA_Filter
false by default.
MA_A_Period / MA_A_Method / MA_A_Applied / MA_A_Shift
Fast average. Default 30 EMA on Close, shift 0.
MA_B_Period / MA_B_Method / MA_B_Applied / MA_B_Shift
Slow average. Default 140 EMA on Close, shift 0.
>>> Awesome Oscillator Filter
Use_AO_Filter
Master switch. false by default.
Use_AO_Volume_Filter
Require AO strength using AO_Buy_Min and AO_Sell_Max.
AO_Buy_Min
Minimum AO value for Buy. Default 4.0. Adjust per symbol because AO is price-unit based.
AO_Sell_Max
Maximum AO value for Sell. Default -4.0.
Use_AO_Color_Filter
Require AO rising for Buy and falling for Sell.
Use_AO_Zero_Filter
Require rising AO above zero for Buy and falling AO below zero for Sell.
>>> Parabolic SAR Filter
Use_SAR_Filter
false by default.
SAR_Step
Acceleration step. Default 0.02.
SAR_Maximum
Maximum acceleration. Default 0.2.
>>> Heiken Ashi Filter
Use_HeikenAshi_Filter
false by default. Uses internally built HA open and close. No extra chart objects are required.
>>> CCI Trend Filter
Use_CCI_Filter
false by default.
CCI_Period
Default 50.
CCI_Applied
Applied price. Default Close.
>>> CCI OB and OS Filter
Use_CCI_OBOS_Filter
false by default.
CCI_OBOS_Period
Default 14.
CCI_OBOS_Applied
Applied price. Default Close.
CCI_Overbought
Buy threshold. Default 100.
CCI_Oversold
Sell threshold. Default -100.
>>> RVI Trend Filter
Use_RVI_Filter
false by default.
RVI_Period
Default 75.
>>> RVI Signal Filter
Use_RVI_Signal_Filter
false by default.
RVI_Signal_Period
RVI period used for main and signal lines. Default 20.
>>> MACD Filters
Use_MACD_Filter
Histogram above zero for Buy, below zero for Sell. false by default.
Use_MACD_Zero_Filter
MACD main line above zero for Buy, below zero for Sell. false by default.
MACD_FastEMA
Default 12.
MACD_SlowEMA
Default 26.
MACD_SignalSMA
Default 9.
MACD_Applied
Applied price. Default Close.
>>> Support and Resistance Filter
Use_SR_Filter
false by default.
SR_Period
Lookback bars for recent high and low. Default 50.
SR_Zone_Points
Touch zone in points. Default 80. Increase on Gold or volatile indices. Decrease on tight Forex pairs if too many touches appear.
>>> Fibonacci Filter
Use_Fib_Filter
false by default.
Fib_Level_1
First retracement. Default 0.382.
Fib_Level_2
Second retracement. Default 0.618.
ZigZag_Depth
How many bars on each side to confirm a swing. Default 12.
ZigZag_Deviation
Minimum swing size in points. Default 5.
ZigZag_Backstep
Minimum bars between accepted swings. Default 3.
>>> Alerts and Notifications
EnableAlert
Terminal popup. Default true.
EnableSound
Play a sound. Default true.
EnablePush
Send a push to the MetaTrader mobile app. Default false. Set your MetaQuotes ID in Tools > Options > Notifications first.
EnableComment
Write the signal text to the Experts log. Default true.
SoundFile
Sound name from the terminal Sounds folder. Default alert.wav.
Alert text includes signal type, symbol, timeframe, and bar time. Only the bar that just closed can trigger an alert, and the same bar time is not alerted twice.
════════════════
RECOMMENDED FIRST SETUP
════════════════
1. Attach the indicator to one chart.
2. Keep UseSinyal1, UseSinyal2, and UseSinyal3 = true.
3. Keep UseFilter1 and UseFilter2 = true.
4. Leave every extra filter = false.
5. Watch a few days of history and live closed bars.
6. Add one filter only, for example Single MA 50 or Senkou Span B.
7. If arrows become too rare, turn that filter off or loosen its level.
8. Turn on alerts after you like the visual result.
Suggested study combinations
- Clean price action: patterns + body filters only.
- Trend follow: patterns + Single MA or Double MA + ADX.
- Cloud bias: patterns + Senkou Span B.
- Momentum confirm: patterns + MACD histogram or RVI signal.
- Level confirm: patterns + Support Resistance or Fibonacci.
Do not enable all filters together on the first day. The stack is AND logic. Every extra true filter reduces the number of arrows.
════════════════
HOW TO READ THE CHART
════════════════
Aqua up arrow : BUY 4C
Red down arrow : SELL 4C
DodgerBlue up : BUY 5C
DarkOrange down : SELL 5C
Gold up arrow : BUY 6C
Magenta down : SELL 6C
More than one arrow can appear on the same closed bar if more than one pattern is valid. Treat that as a stronger pattern cluster, not as three separate entries unless your plan says so.
The current forming candle never shows an arrow. Wait for the close.
════════════════
PRACTICAL USE NOTES
════════════════
Works on any symbol that has enough bars. The code needs about 150 bars before it starts. Senkou Span B needs extra history because of the 26-bar shift.
Point values differ by symbol. ArrowOffset, SR_Zone_Points, AO levels, and ZigZag_Deviation are point-based. Recheck them on Gold, Crypto, and JPY pairs.
This is not an Expert Advisor. No orders are sent. You decide entry, stop, target, and size.
No method wins on every market condition. Range markets can produce more fake pullbacks. Strong one-way trends can skip pullbacks and print fewer patterns.
Do not use this description as a promise of profit. Past arrows on history are closed-bar calculations, not a guarantee of future results.
════════════════
INSTALL AND SUPPORT
════════════════
Buy or rent from the official MQL5 Market page, then install from the Market tab inside MetaTrader 5. Restart the terminal if the product does not appear at once.
After purchase, questions and update notes should stay in the product comments or MQL5 private messages so other users can follow the same answers.
════════════════
DISCLAIMER
════════════════
Trading involves risk. You can lose money. Use demo first. The author is not responsible for trading losses from the use of this indicator.
════════════════
THANK YOU
════════════════
Thank you for reading and for considering this product. If the indicator helps your chart reading, a review on the product page is appreciated.