TrendCue Core
- Indicatori
- Versione: 1.1
- Aggiornato: 7 settembre 2026
- Attivazioni: 20

Trade with a clearer chart and a defined exit plan.
TrendCue Core gives clear BUY and SELL signals after the candle closes, helping you read the chart and manage each setup more easily.
SPECIAL BONUS: After purchasing TrendCue Core, leave a comment on the product page or send me a private message to receive the TrendCue Scanner bonus.
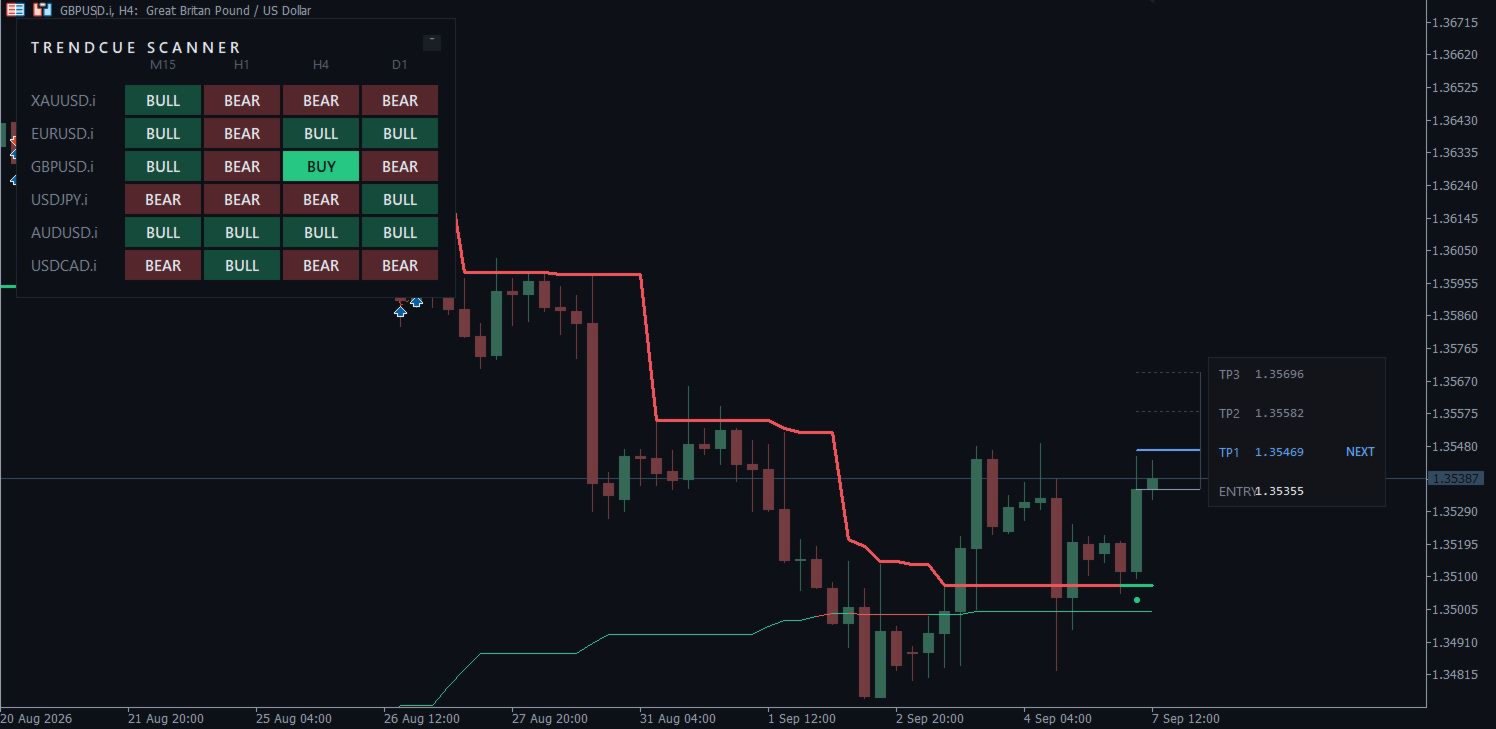
When a setup qualifies, Core shows a fixed Entry and three targets: TP1, TP2 and TP3.
The exit plan is simple: price can reach the predefined targets, or the setup can end earlier when an opposite signal appears.
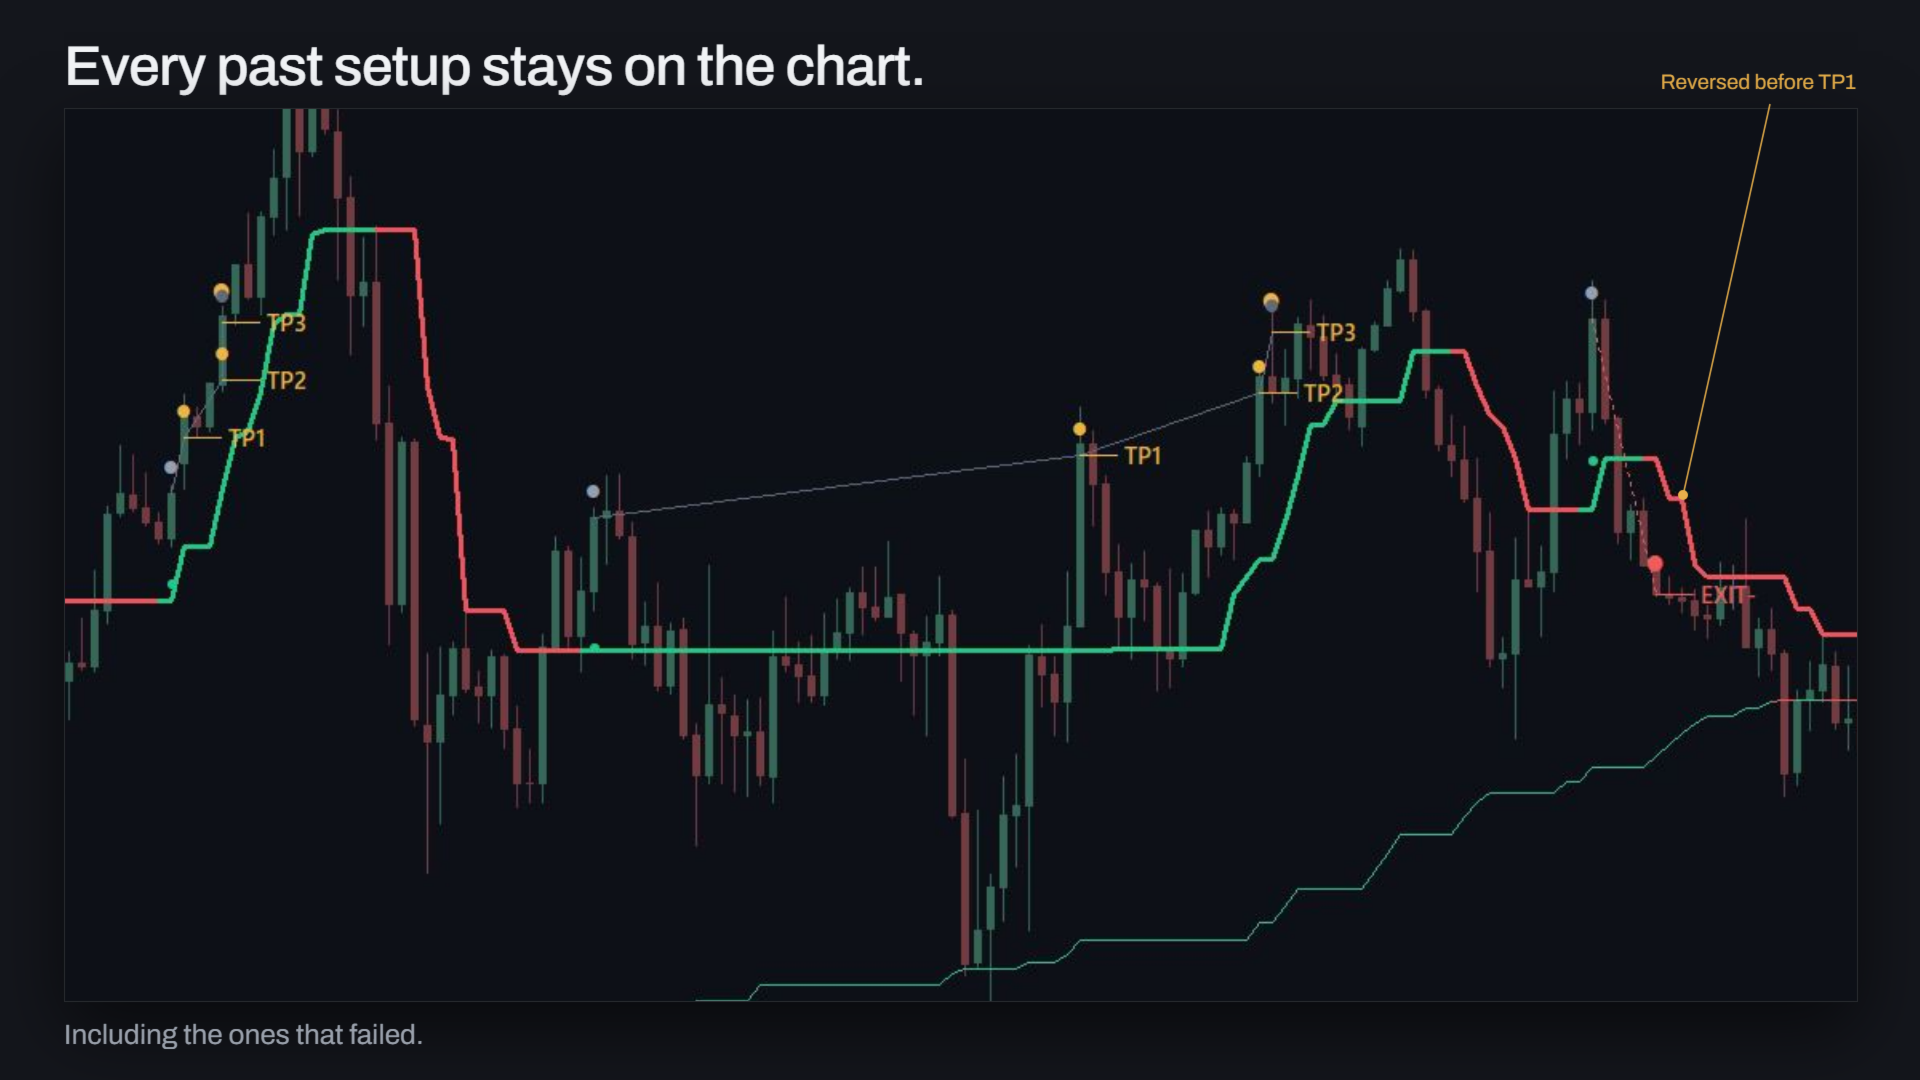
Past setups remain visible on the chart, so you can see where signals appeared, which targets were reached, where exits happened, and how previous setups ended.
Instead of giving you only an arrow, TrendCue Core gives you the signal, the targets, the exit plan and the history behind it.
Example — September 7, XAUUSD M15: a real TrendCue Core walkthrough from signal to targets and exit management.
I regularly publish fresh market analyses and real setup walkthroughs with my TrendCue tools on my MQL5 profile.
HOW IT WORKS
1. Find — spot a signal on the chart or with TrendCue Scanner.
2. Inspect — see whether the setup qualified, together with Entry and TP1/TP2/TP3.
3. Exit — close at the predefined targets, or earlier on an opposite signal.
4. Decide — apply your own stop loss, position size and execution.
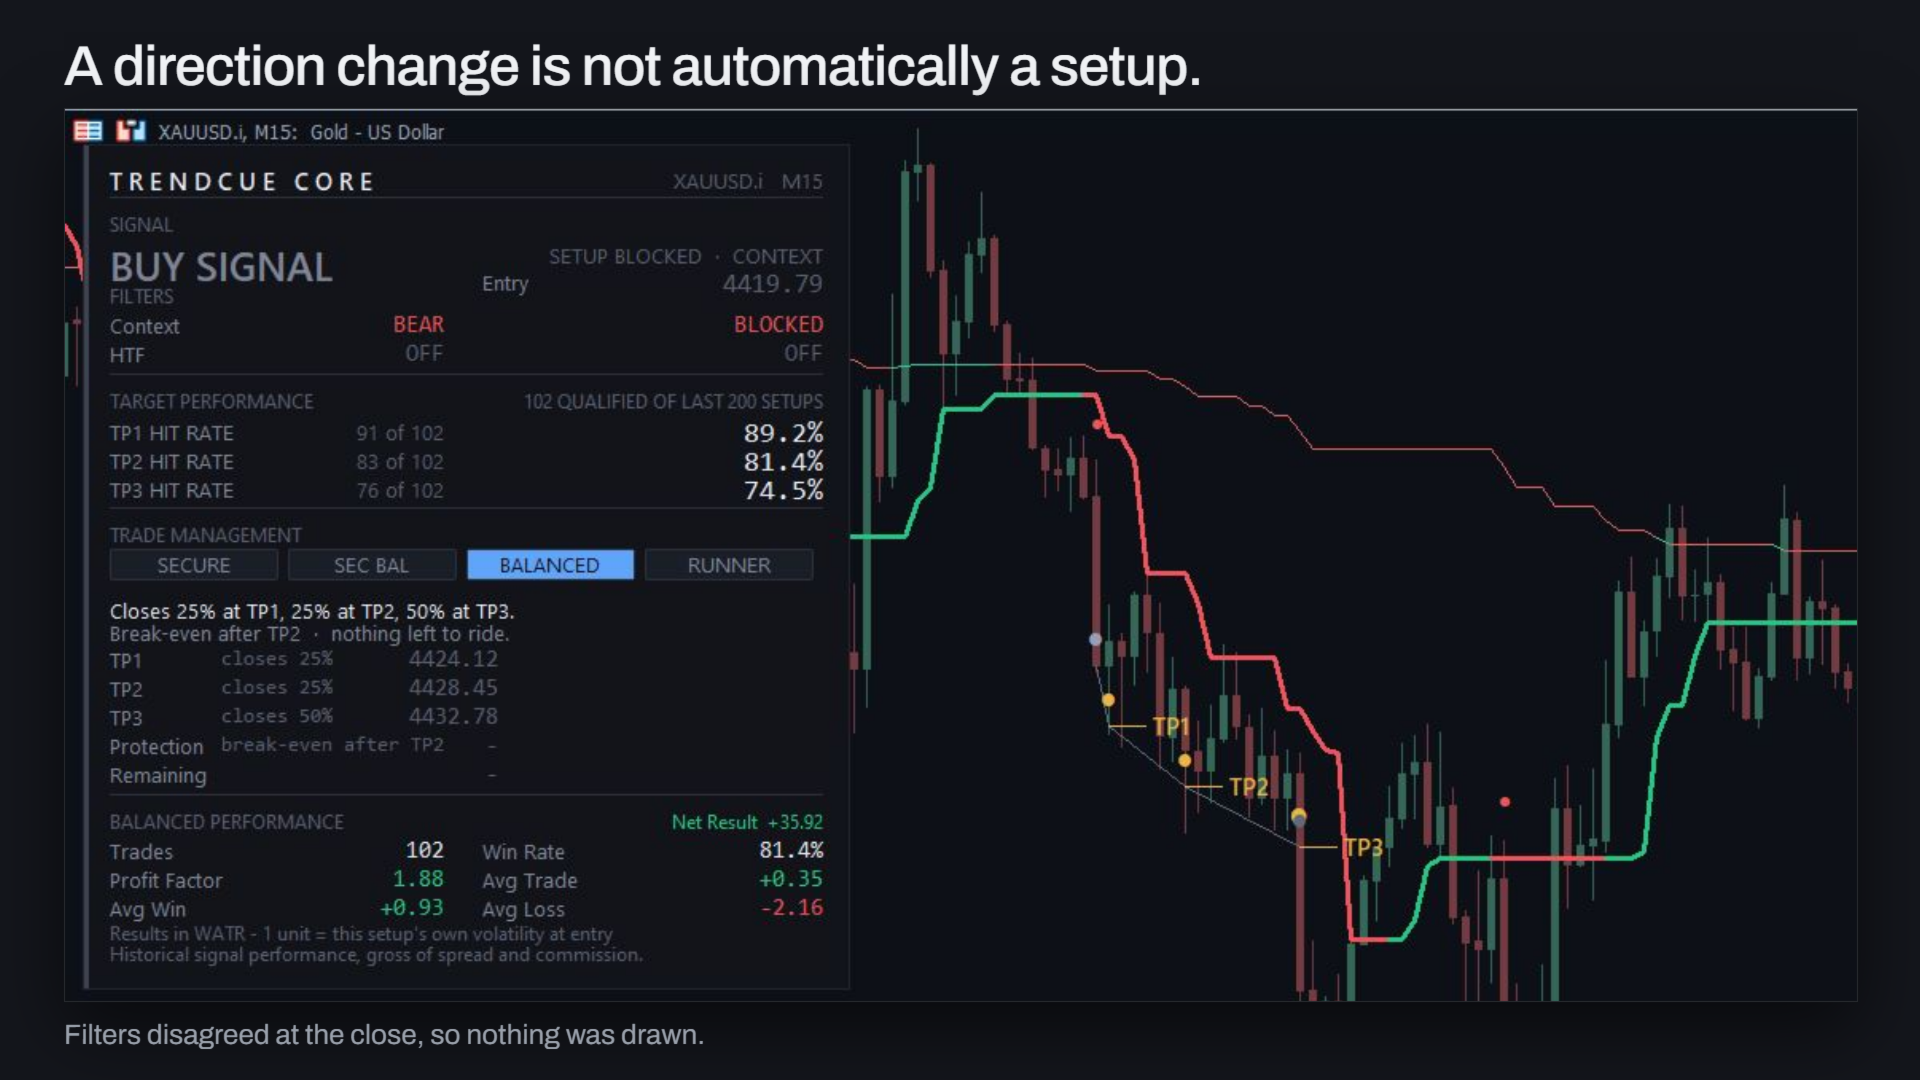
A SIGNAL IS NOT ALWAYS A SETUP
Context filtering is enabled by default, with an optional Higher Timeframe filter.
A setup is accepted only when the enabled filters agree at candle close.
If they do not, the panel clearly shows:
SETUP BLOCKED · CONTEXT
and no target ladder is created.
THREE FIXED TARGETS
For every qualified setup, TrendCue Core freezes:
• Entry
• TP1
• TP2
• TP3
These prices stay fixed for the life of the setup.
The active setup card shows which targets have been reached and which target comes next.
SEE THE HISTORY
Completed setups stay visible on the chart.
You can scroll back and inspect:
• Entry
• TP1 / TP2 / TP3 hits
• setups that ended before completing the target sequence
The panel also shows TP hit rates together with the qualified sample size, for example:
102 QUALIFIED OF LAST 200 SETUPS
So you can see the data behind the percentages instead of a percentage alone.
FOUR MANAGEMENT STYLES
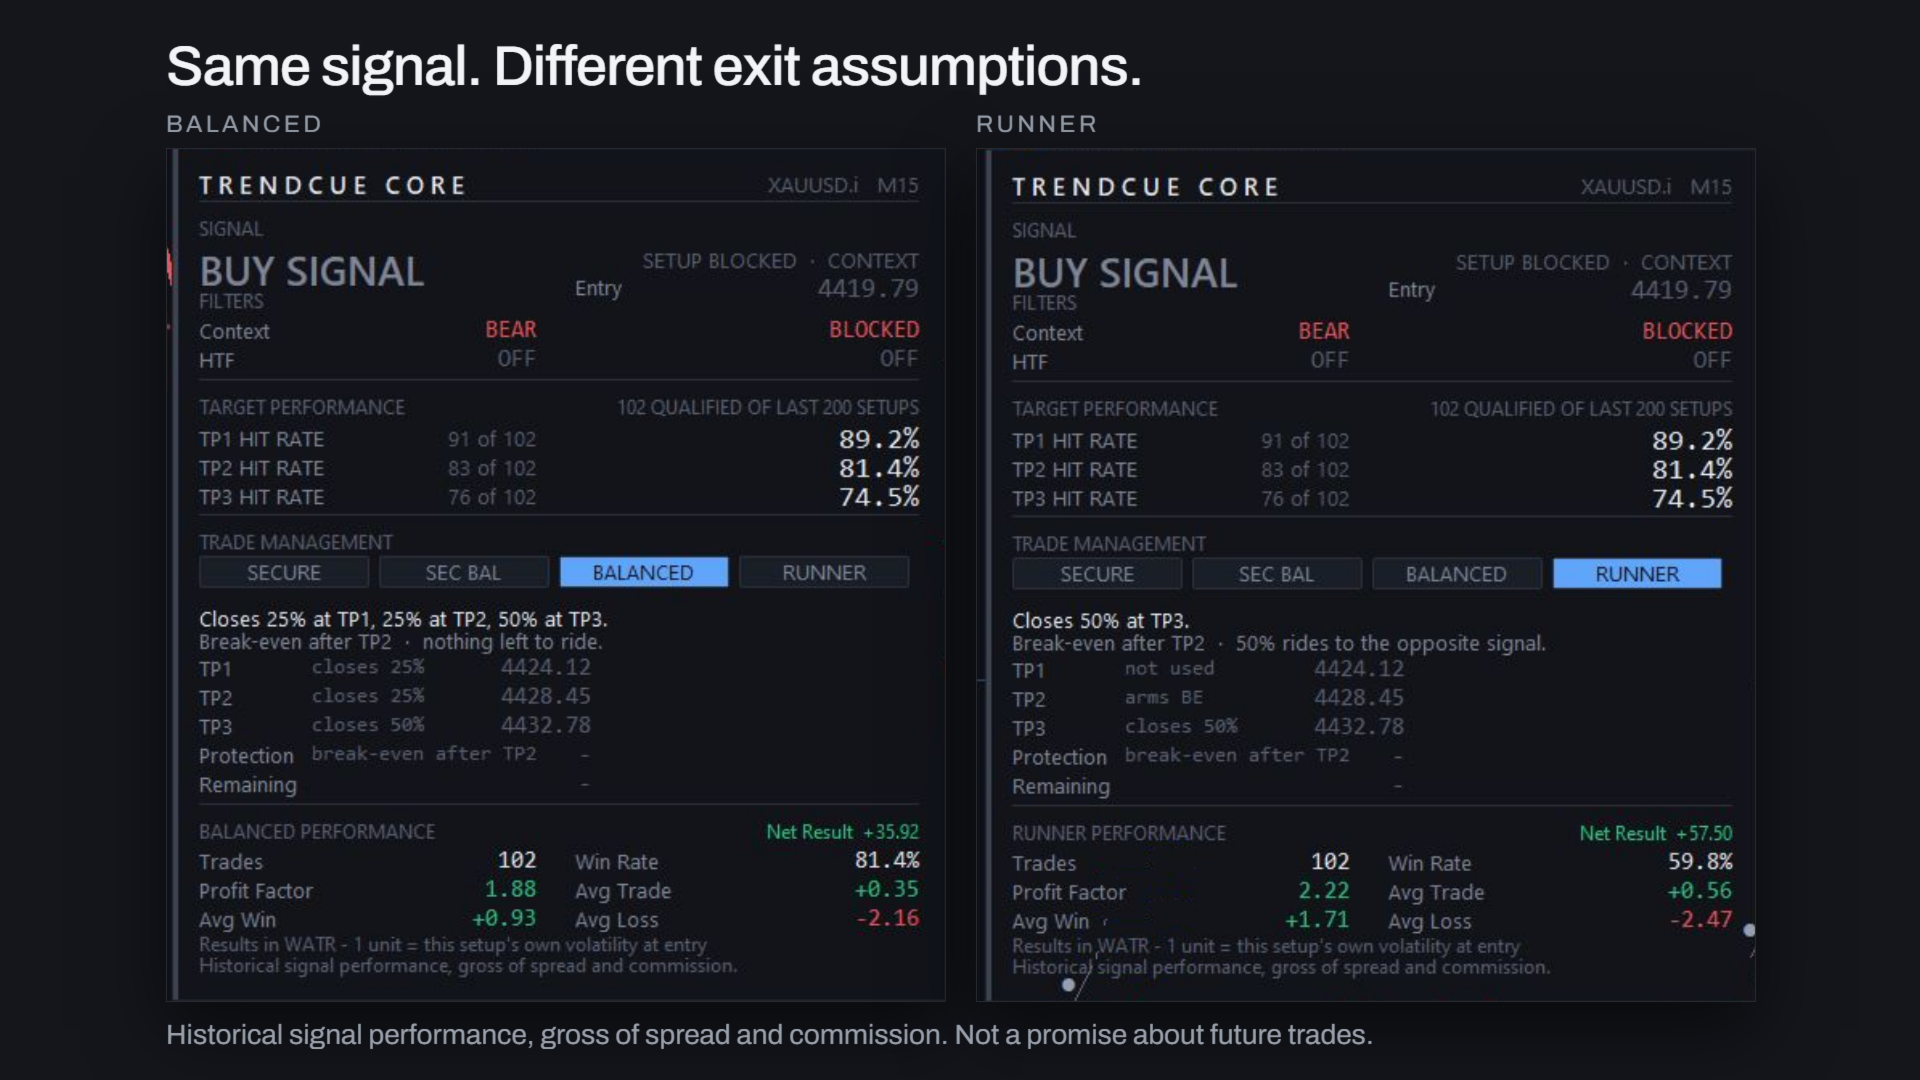
TrendCue Core lets you review the same signal history under four exit approaches:
SECURE — 100% at TP1
SEC BAL — 25% at TP1, 25% at TP2, 50% at TP3, break-even after TP1
BALANCED — 25% at TP1, 25% at TP2, 50% at TP3, break-even after TP2
RUNNER — 50% at TP3, break-even after TP2, remaining portion follows the trend until an opposite signal
The panel shows historical metrics such as Win Rate, Profit Factor, Average Trade and Net Result for the selected management style.
TRENDCUE SCANNER
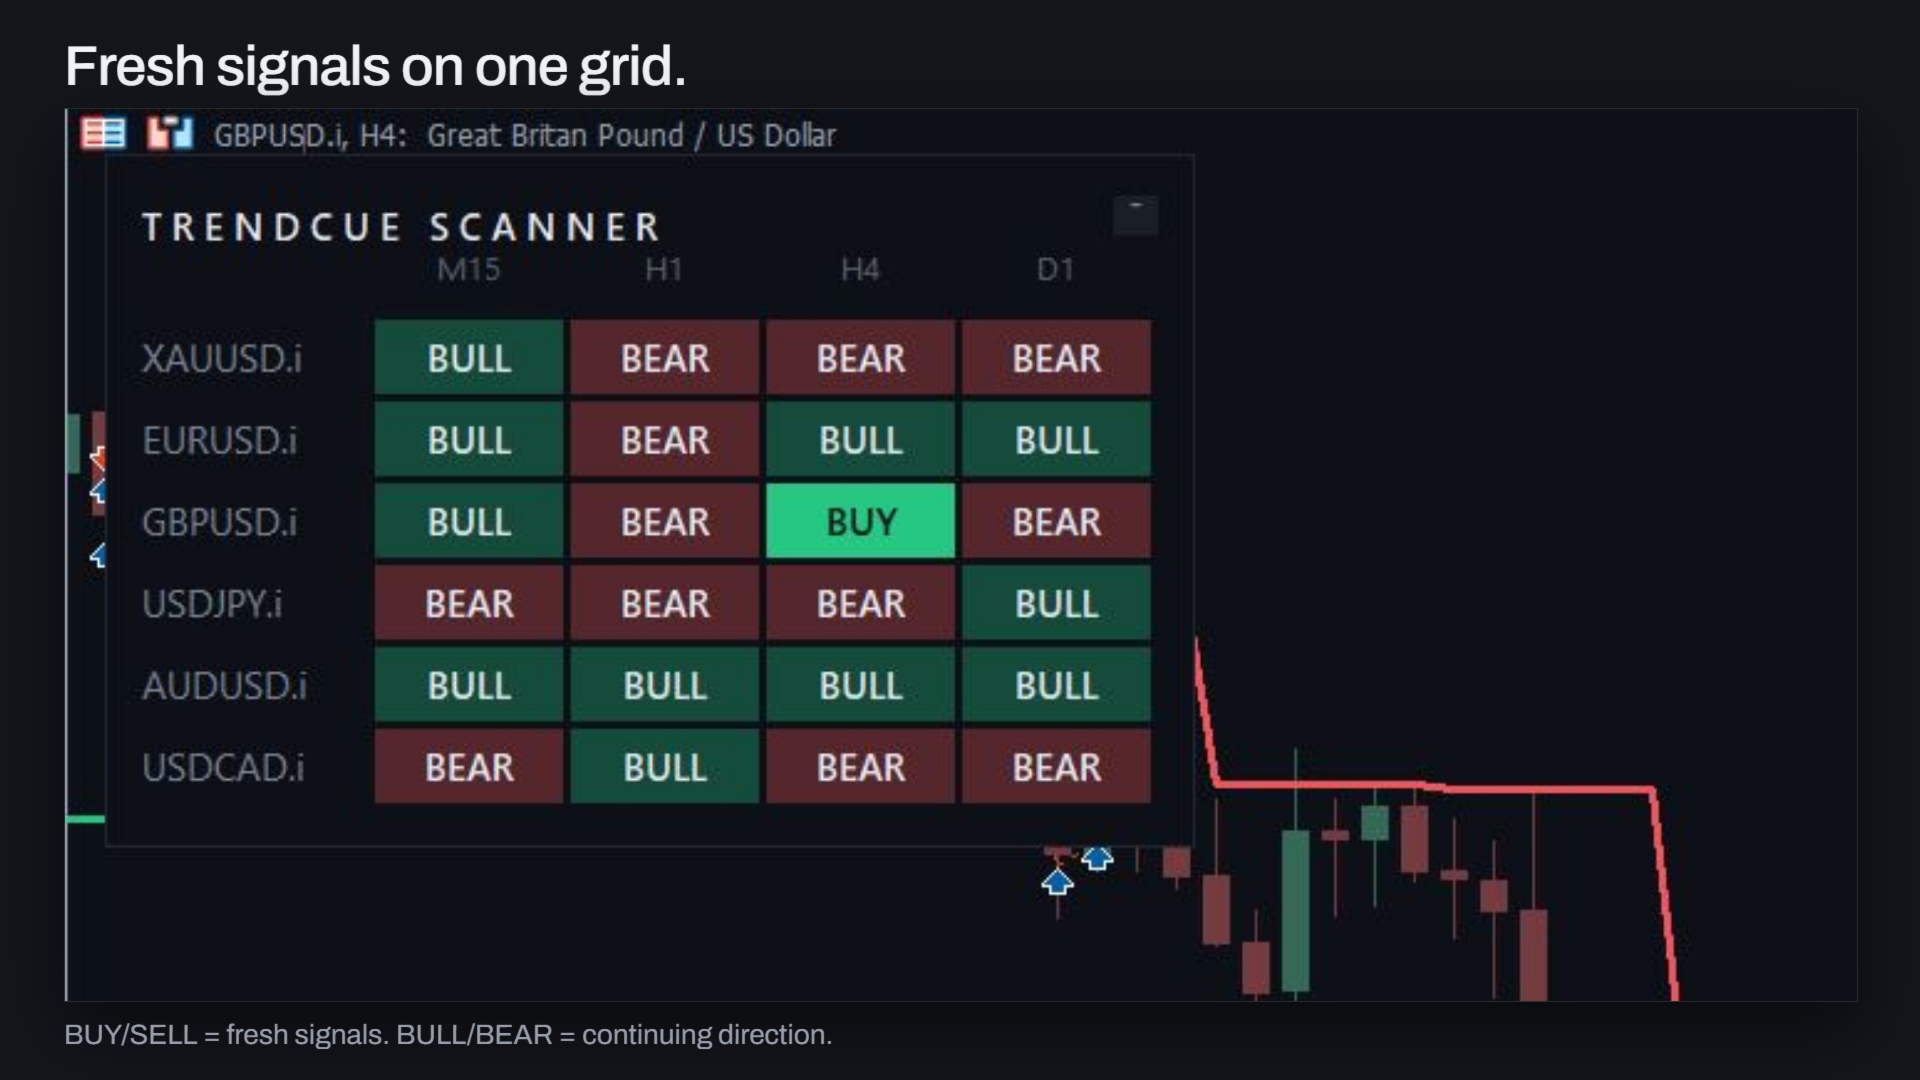
TrendCue Scanner is the companion discovery tool.
BUY / SELL = a fresh accepted signal on the last closed candle
BULL / BEAR = the current direction is continuing
Click a cell to open the corresponding symbol and timeframe and inspect the setup in Core.
IMPORTANT
TrendCue Core and Scanner are analysis tools.
They do not place trades, set stop losses, calculate position size or manage your trading account.
Historical setups, target hit rates and modelled management results do not guarantee future performance.
RECOMMENDED START
Amplitude: 4
Context: ON
HTF Filter: OFF
Management: BALANCED
Start with XAUUSD or highly liquid major currency pairs.
Compare the panel results across timeframes and choose the one with the stronger historical profile. As a general guideline, prefer a timeframe where historical Profit Factor is above 1.00.
Then review both successful and failed setups directly on the chart.