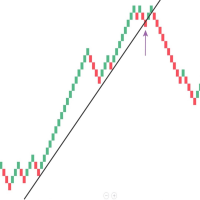
Ghost face change
- Indicatori
- Versione: 2.0
- Attivazioni: 5

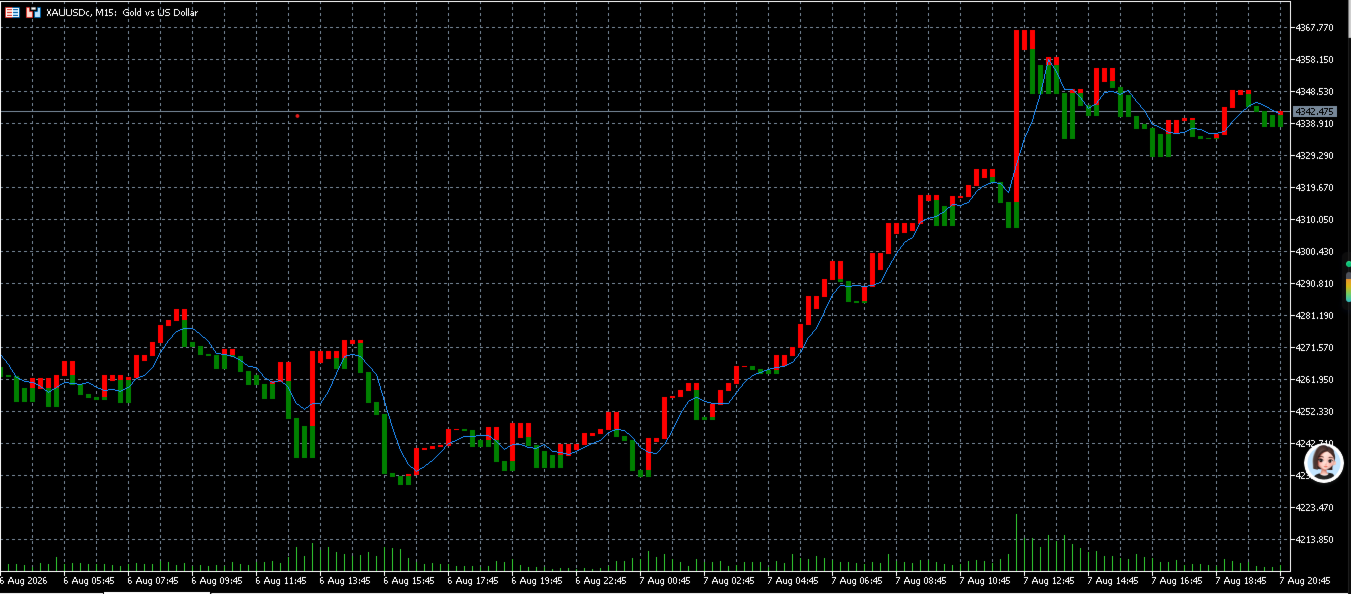
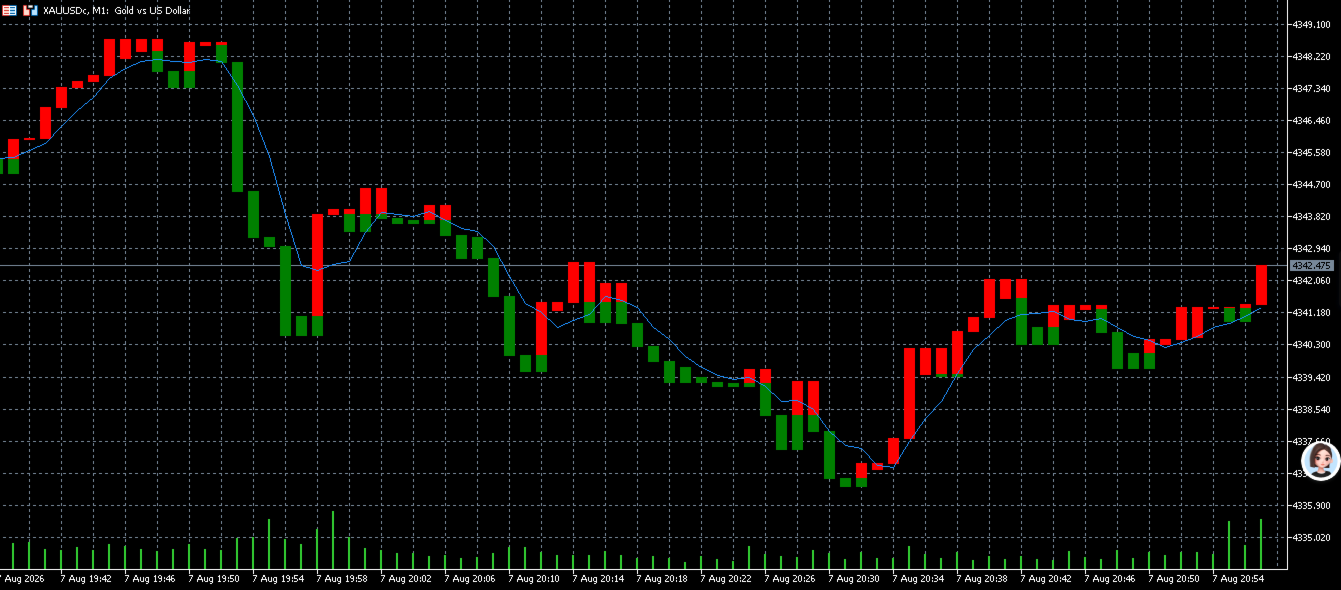
The Ghost Face Indicator is a trend-following technical indicator that combines the filtering principles of Tower (TOWER) lines and Heikin-Ashi. By dynamically changing bar colors ("changing face") based on price breakouts relative to recent key highs and lows, it effectively filters out intraday noise, helping traders capture major uptrends and downtrends.
Core Logic & Mechanism
- Dynamic Color Switching: Instead of relying on a single candle's open and close prices, it compares price extremes across the recent N bars (typically 3 bars). The bar turns from green (or blue) to red when the close breaks above the previous high boundary, and shifts from red to green when the close breaks below the previous low boundary.
- Trend Lock-In: As long as key support or resistance remains intact, the bars retain their current color, preventing traders from being shaken out prematurely by minor intraday pullbacks.
Four Core Patterns & Trading Signals
| Pattern Type | Chart Features | Trading Signal / Meaning |
| Green/Black to Red | First red bar following a series of green bars; close breaks above prior high | Buy / Long: Bullish trend confirmed and initiated |
| Red to Green/Black | First green bar following a series of red bars; close breaks below prior low | Sell / Short / Exit: Bearish trend confirmed and established |
| Three Flat Bottoms to Red | Three consecutive bar bottoms align horizontally without making new lows, then turn red | Strong Buy Signal: Solid bottoming structure with a high-probability reversal |
| Three Flat Tops to Green | Three consecutive bar tops align horizontally without making new highs, then turn green | Strong Sell Signal: Stagnation at the top with a high-probability peak reversal |
Practical Trading Techniques
- Trend Filtering (Using Moving Averages): Add a medium-to-long-term moving average (e.g., 20 MA or 60 MA). When price is above the MA, take only "Green to Red" buy signals and ignore sell signals. When price is below the MA, execute only "Red to Green" sell/short signals.
- Stop-Loss Placement:
- Long Stop-Loss: Place 1–2 ticks below the low of the bar that triggered the shift to red.
- Short Stop-Loss: Place 1–2 ticks above the high of the bar that triggered the shift to green.
- Bollinger Band Confluence: On lower timeframes (e.g., 1-minute or 5-minute charts), a "Three Flat Bottoms to Red" pattern near the lower Bollinger Band marks an optimal dip-buying point; a "Three Flat Tops to Green" pattern near the upper band signals an excellent profit-taking or shorting point.
Key Considerations
- Avoid Range-Bound Markets: In tight consolidation zones, the indicator may frequently cross trigger levels and flip colors rapidly, leading to whipsaws and unnecessary trading costs. Stand aside or combine with ATR and volume indicators during sideways chop.
- Bar Close Confirmation: Always wait for the current bar to close completely and lock in its color before placing orders. Never trade prematurely on intra-bar temporary color shifts.