MACD 2Line Divergence MT5
- Indicatori
- Versione: 1.1
- Aggiornato: 2 gennaio 2025
- Attivazioni: 20

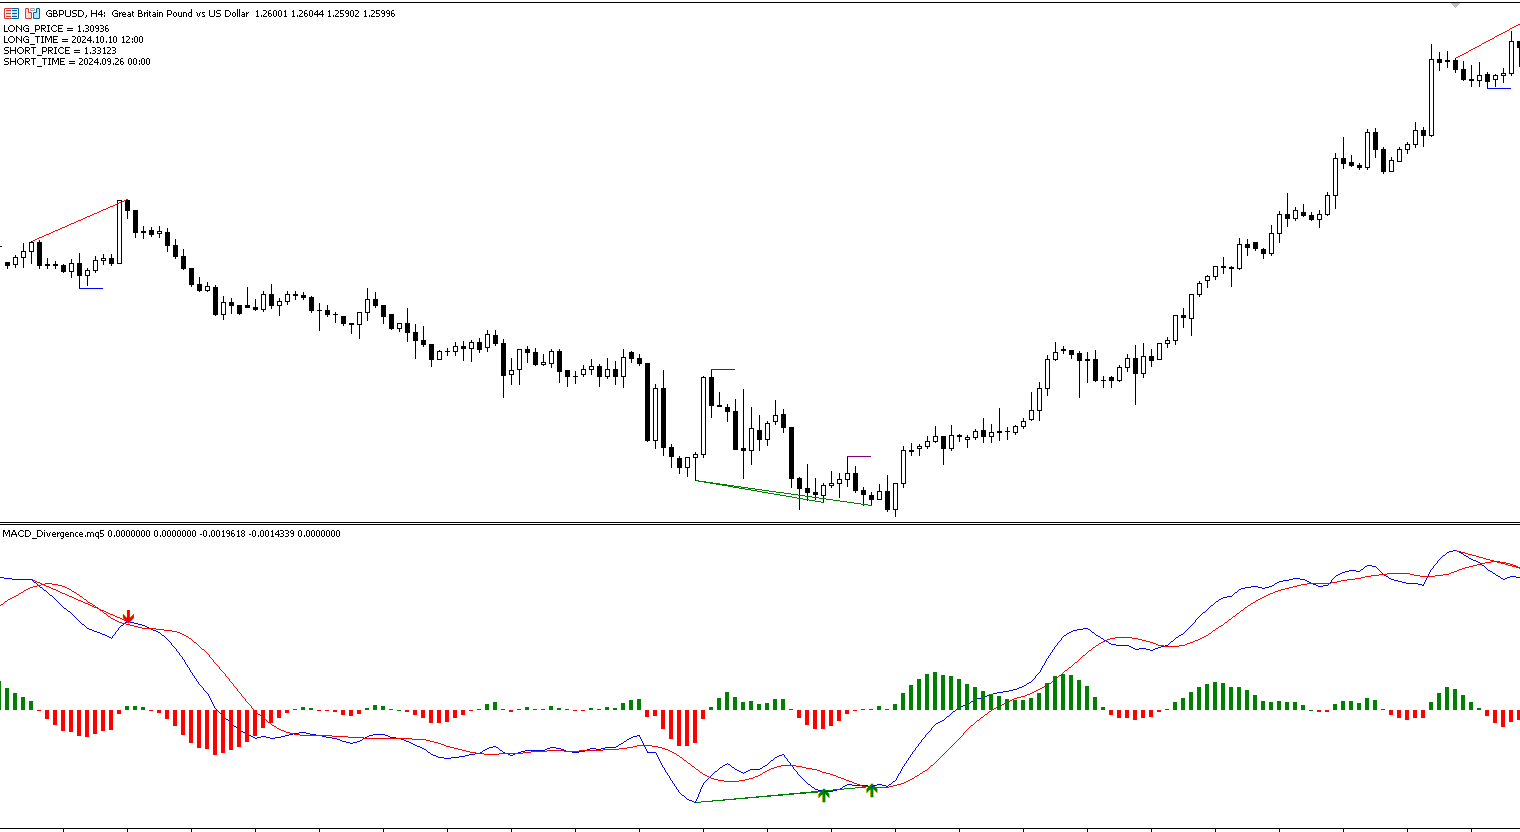
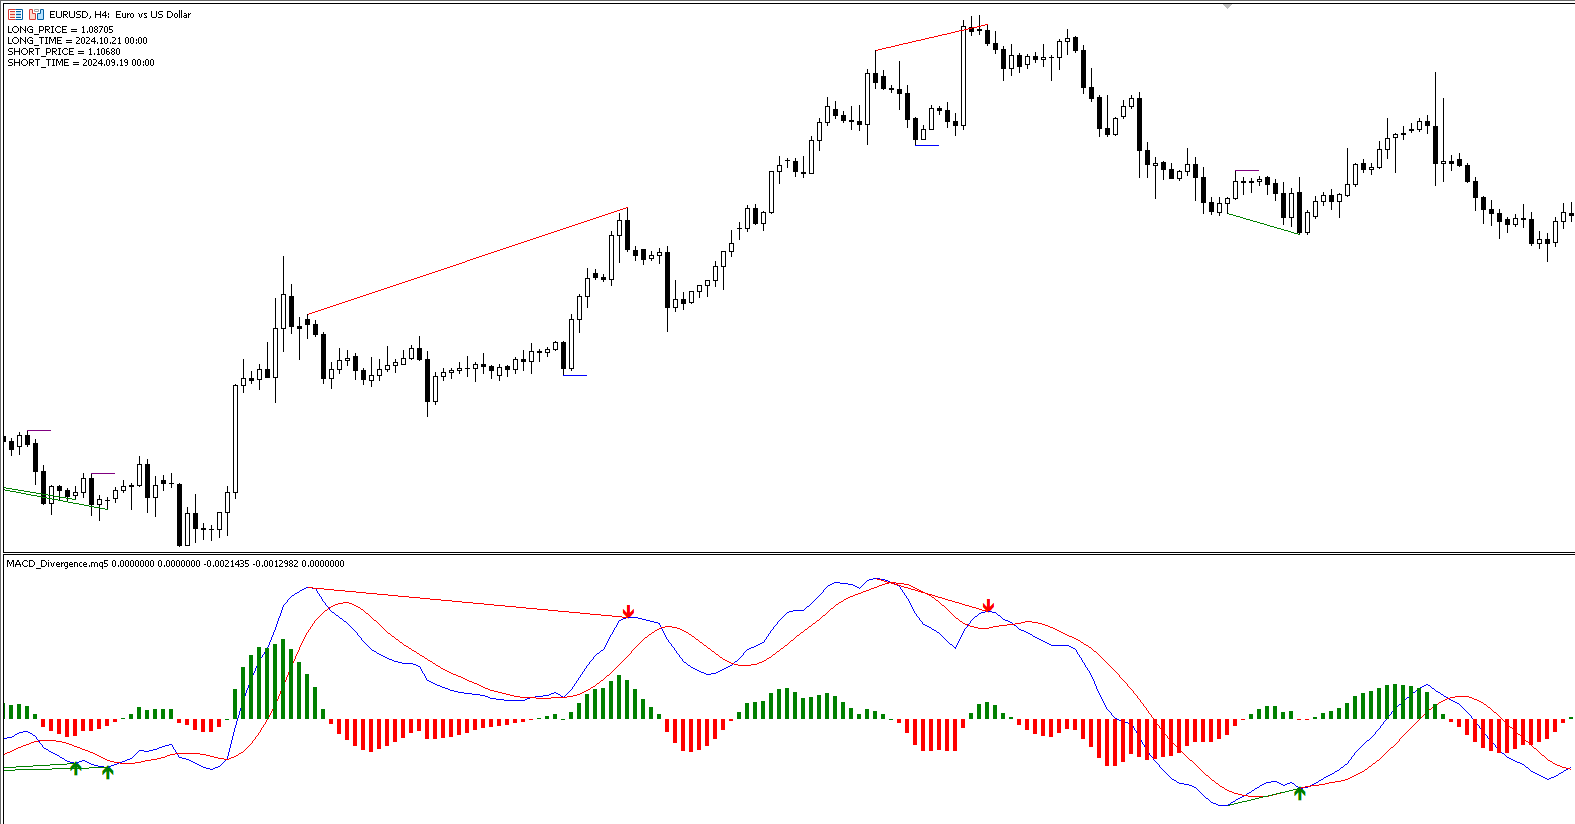
The MACD Divergence Indicator is a powerful tool designed to identify Classical (Normal) Divergences on the MACD, which can signal potential market reversals or continuation trends. Divergences occur when the price and the indicator move in opposing directions, highlighting potential shifts in momentum.
What is a Classical (Normal) Divergence?
Classical Divergences are categorized into two main types:
-
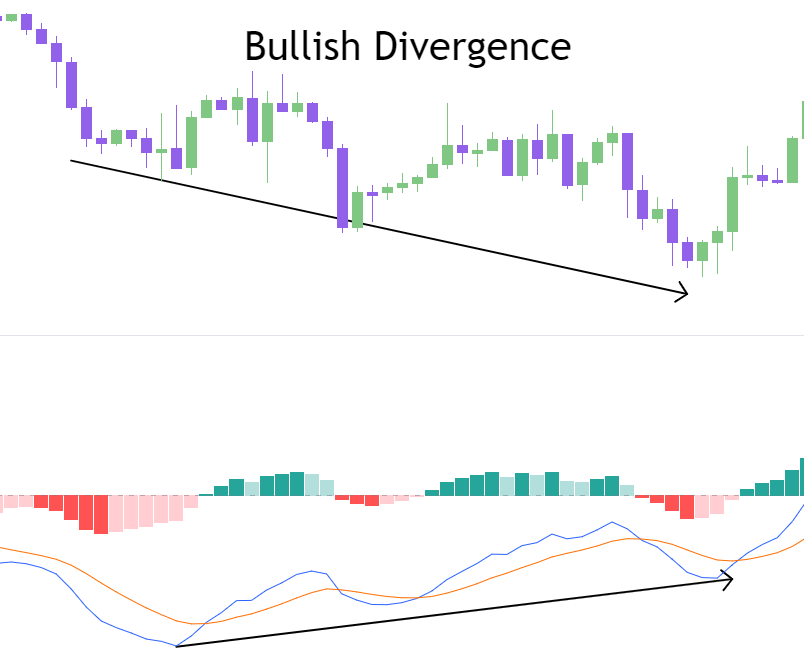
Bullish Divergence:
- Occurs when the price forms lower lows, but the MACD forms higher lows.
- This suggests weakening downward momentum and the potential for a bullish reversal.
-
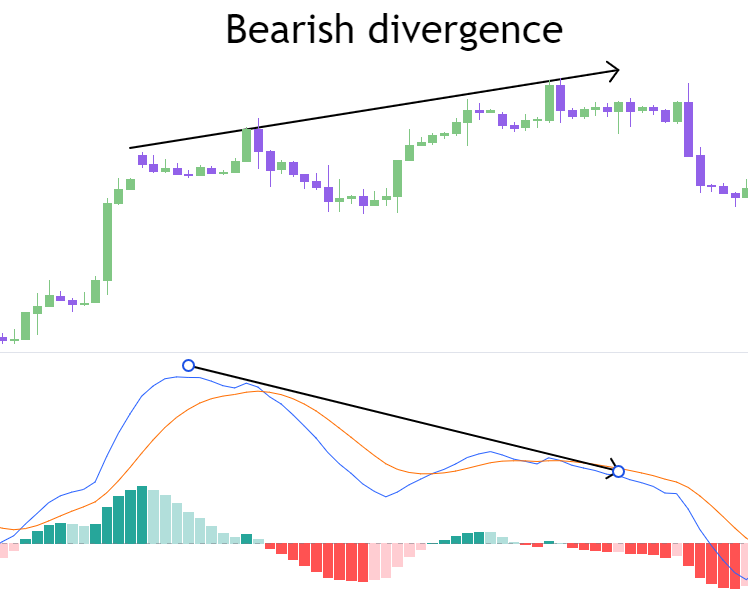
Bearish Divergence:
- Occurs when the price forms higher highs, but the MACD forms lower highs.
- This indicates weakening upward momentum and the potential for a bearish reversal.
Divergences are particularly useful for spotting market turning points, helping traders to enter trades at optimal moments.
Key Features
-
Trend Line Visualization:
The indicator automatically draws trend lines on both the price chart and the MACD to highlight divergences. -
Entry Signals:
Entry lines are plotted to provide guidance on potential trading opportunities based on divergence patterns. -
Customizable Alerts:
Notifications and alerts can be enabled to inform the trader of divergence setups in real time. -
Divergence Validation/Invalidation:
The indicator uses specific thresholds to ensure that only valid divergences are identified, reducing noise and false signals.
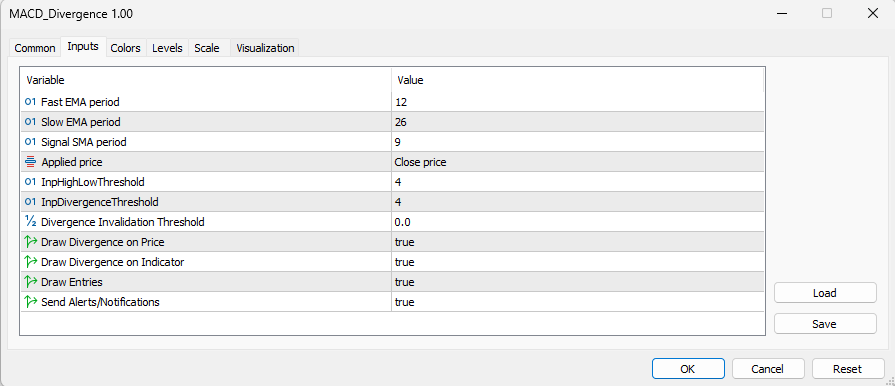
Input Parameters
MACD Calculation Parameters:
-
FastEMA :
- The period for the fast EMA.
- Default value: 12 .
- A lower value makes the MACD more responsive to price changes.
-
SlowEMA :
- The period for the slow EMA.
- Default value: 26 .
- A higher value smoothens the MACD, making it less sensitive to short-term fluctuations.
-
SignalEMA :
- The period for the signal EMA (moving average of the MACD line).
- Default value: 9 .
- This is used to identify crossovers for buy/sell signals.
-
AppliedPrice :
- The price type to calculate the MACD on (e.g., close price, open price, etc.).
- Default value: PRICE_CLOSE .
Divergence Detection Parameters:
-
HighLowThreshold :
- Defines how far a high/low on the price chart must be to be considered a significant peak or trough.
- Default value: 4 (4 candles to the left and right of the peak).
- A higher value ensures fewer, more significant peaks/troughs are detected.
- Note: If no high or low matches the threshold rules, but the divergence is valid based on the MACD indicator, the search threshold is reduced by 1 each time it fails to find one that meets the original threshold.
-
DivergenceThreshold :
- Similar to HighLowThreshold , but applies to the MACD line and signal line.
- Default value: 4 (4 candles to the left and right of the peak on the MACD).
- Ensures the divergence is meaningful and not caused by small fluctuations.
-
Note: The threshold only applies to the previous high or low on the MACD. The high or low that is currently forming is less strict, allowing the detection of divergence while it is still forming:
- BullishExtremum: A bottom on the MACD (lower than the 2 previous and 1 next).
- BearishExtremum: A top on the MACD (higher than the 2 previous and 1 next).
-
DivergenceInvalidationThreshold :
- If the signal line or MACD line value on the histogram is too close to 0 (± this threshold), the divergence is invalidated.
- Default value: 0 .
- Prevents false signals when the MACD is near neutral (no significant momentum).
Visualization Parameters:
-
DrawPriceTrendLines :
- Enables or disables the drawing of trend lines on the price chart to highlight divergences.
- Default value: true .
-
DrawIndicatorTrendLines :
- Enables or disables the drawing of trend lines on the MACD to highlight divergences.
- Default value: true .
-
DrawIndicatorEntryLines :
- Enables or disables the drawing of entry signals based on divergences.
- Default value: true .
Alerts and Notifications:
- DisplayAlert :
- Enables or disables notifications and alerts for detected divergences.
- Default value: true .
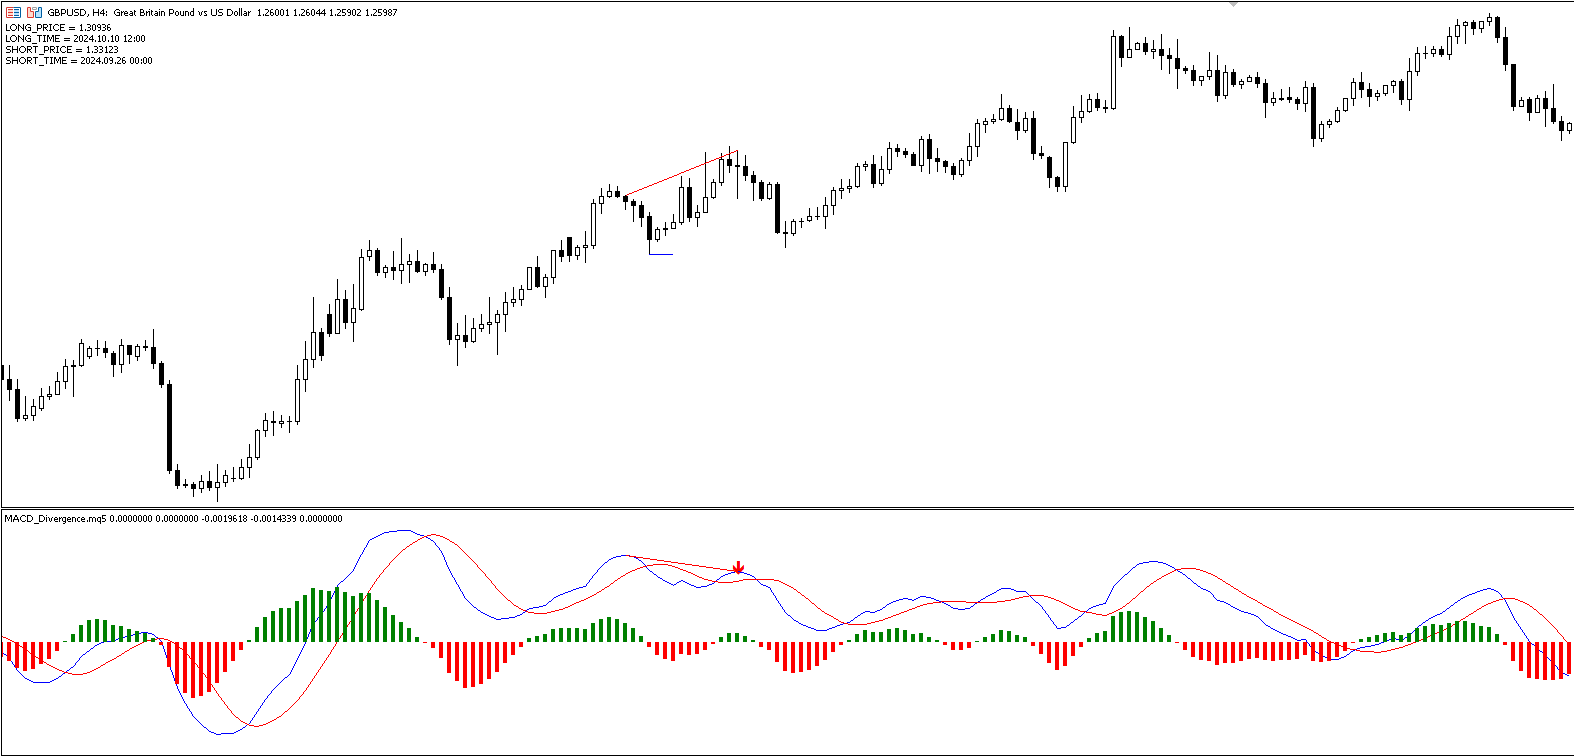
How It Works
- The indicator calculates the MACD based on the FastEMA , SlowEMA , and SignalEMA parameters, applied to the selected AppliedPrice .
- It scans for divergences between the price chart and the MACD line, considering significant highs/lows using the HighLowThreshold and DivergenceThreshold parameters.
- Divergences are validated using the DivergenceInvalidationThreshold to ensure reliability.
- Once a valid divergence is detected:
- Trend lines are drawn on both the price chart and the MACD to visualize the divergence.
- Entry lines are plotted based on the divergence setup.
- If DisplayAlert is enabled, a notification/alert is sent.
Use Cases
- Identifying reversal points in trending markets.
- Spotting entry opportunities in range-bound markets.
- Validating signals from other trading tools or strategies.
This MACD Divergence Indicator is ideal for traders looking for a systematic approach to identify and act on divergence setups with precision and efficiency.