Pair Log Ratio Divergence

Pair Log Ratio Divergence is a professional indicator designed for Pairs Trading.

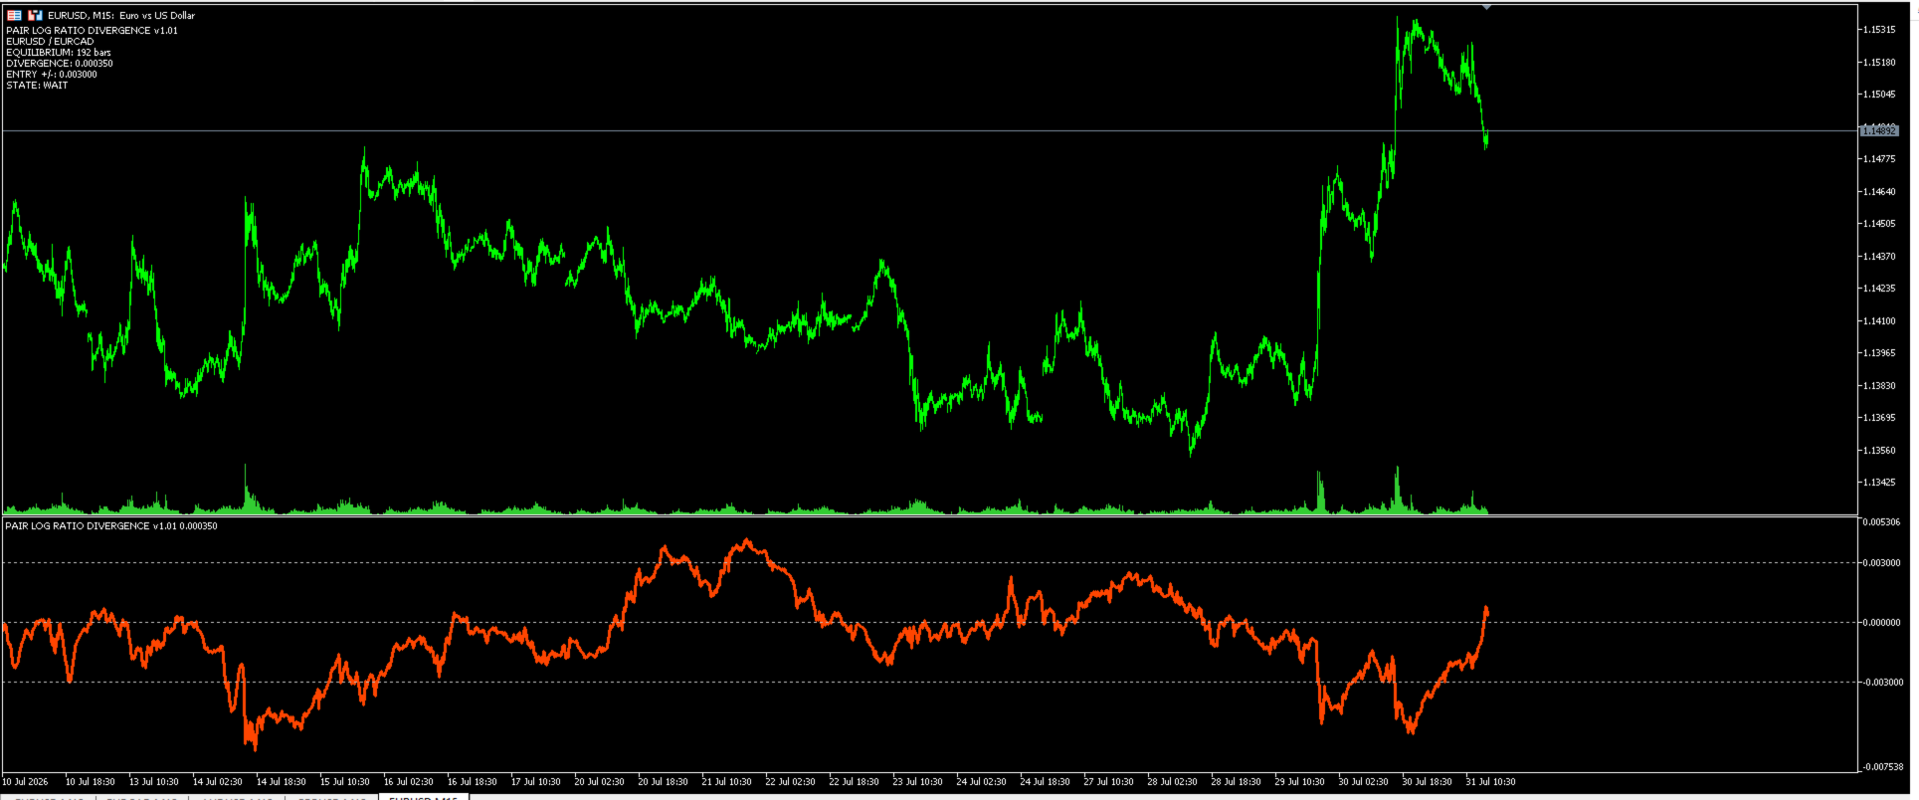
It measures the divergence between two financial instruments using the logarithmic price ratio instead of simple price differences.

The logarithmic approach allows accurate comparison of instruments with different price scales while providing a stable equilibrium model.

The indicator calculates:

  • logarithmic price ratio
  • dynamic equilibrium line
  • current deviation from equilibrium

This makes it possible to identify statistically significant divergence between correlated instruments.

How it works

The indicator calculates:

Divergence = Log(Symbol2 / Symbol1) − Average(Log Ratio)

The equilibrium is calculated over the selected EquilibriumBars period.

Values close to zero indicate that both instruments are trading near their historical equilibrium.

Large positive or negative deviations may indicate potential mean-reversion opportunities.

Trading Signals

Positive Divergence

SELL Symbol2

BUY Symbol1

Negative Divergence

BUY Symbol2

SELL Symbol1

Features

✔ Professional Pairs Trading indicator

✔ Log Ratio Analysis

✔ Dynamic Equilibrium Calculation

✔ Adjustable Entry Threshold

✔ Information Panel

✔ Alert Notifications

✔ Supports Any Symbol Combination

✔ Optimized Calculation Engine

Inputs

Symbol1

First instrument.

Symbol2

Second instrument.

EquilibriumBars

Number of bars used for equilibrium calculation.

EntryThreshold

Signal threshold.

ShowPanel

Show information panel.

ShowSignals

Enable alerts.

Recommended Timeframes

M15

M30

H1

H4

Recommended Symbol Pairs

EURUSD / EURCAD

EURUSD / GBPUSD

AUDUSD / NZDUSD

EURJPY / GBPJPY

USDCHF / EURUSD

or any highly correlated instruments.

Disclaimer

This indicator is an analytical tool designed to measure statistical divergence between two instruments.

It should be used together with proper money management and additional market analysis before making trading decisions.

Altri dall’autore
Finding Divergence RSI
Mykhailo Zakervashevych
4 (1)
Finding Divergence RSI  is a professional MetaTrader 5 indicator designed for automatic detection and visualization of classic and hidden divergences using the RSI indicator. The indicator works directly on the price chart, displaying arrows at divergence points and optionally drawing trend lines on both price and RSI charts. Divergence Types 1. Classic Divergences Classic Bullish : Price forms Lower Low (LL), RSI forms Higher Low (HL) Signal: Trend reversal to upside Classic Bearish : Price fo
FREE
Didta
Mykhailo Zakervashevych
5 (1)
Indicator Description: DISH X Imbalance (DIDTA/DIDFA) 1. Overview The   DISH X Imbalance   indicator is a sophisticated volume-based technical analysis tool for MetaTrader 4 that analyzes market order flow imbalance to identify potential trend reversals and fair value deviations. The indicator calculates two core values:   DIDTA (Daily Imbalance Delta)   and   DIDFA (Daily Imbalance Delta Fair Value) , providing traders with insights into buying/selling pressure and market valuation. 2. Core Com
FREE
CandleCountdown
Mykhailo Zakervashevych
General Description Candle Countdown   is a visual indicator for MetaTrader 5 that displays the time remaining until the current candle closes in real-time. The indicator presents information panels attached to Bid and Ask lines, showing countdown timers, current candle type, and other useful information. Key Features 1.   Candle Time Display Countdown Timer : Time until candle close in MM:SS format Elapsed Time : Time since candle opening Percentage Completion : Real-time percentage of candle c
FREE
Expert Grid rsi Pro
Mykhailo Zakervashevych
General Description Grid RSI Pro v3.1 is an advanced trading Expert Advisor for MetaTrader 4 that uses a grid strategy with RSI indicator filtering. The EA automatically opens orders at specified levels, creating a grid of orders to capture market fluctuations. Version 3.1 includes enhanced risk management features and improved signal filtering systems. Key Features 1. Trading Strategies RSI Strategy : Position opening when RSI reaches overbought (80) or oversold (20) levels Fixed Points : Posit
Engulfing RSI
Mykhailo Zakervashevych
Engulfing RSI Indicator Category:   Multi-Timeframe, Candlestick Pattern Confirmation Overview: The Engulfing RSI is a powerful confluence tool that combines the classic candlestick reversal pattern (Bullish or Bearish Engulfing) with the momentum readings of the Relative Strength Index (RSI). It doesn't just show the pattern; it validates it with overbought/oversold context, filtering out weak signals and highlighting higher-probability trade setups. Core Logic: The indicator scans for Engulf
Filtro:
Nessuna recensione
Rispondi alla recensione