Smart Entry System
- Indicatori
- Versione: 6.40
- Aggiornato: 25 luglio 2026
- Attivazioni: 10

!!!BEFORE YOU PASS BY, CAREFULLY READ THE DESCRIPTION AND SCREENSHOTS!!!
SPECIAL OFFER!!! Purchase the trading system and receive the Trend and Currency dashboard as a free gift! Message me after your purchase, and I’ll send you your gift!
The universal trading system is designed for quick market analysis, indicating potential entry points.
One indicator on the chart is a well-thought-out trading system!
The timeframe used is any.
The account type is any.
The traded instruments are Forex, XAUUSD(all metals), cryptocurrencies, stocks, oil, etc.
The trading style is scalping, intraday, swing, and long-term investing.
The trading system includes:
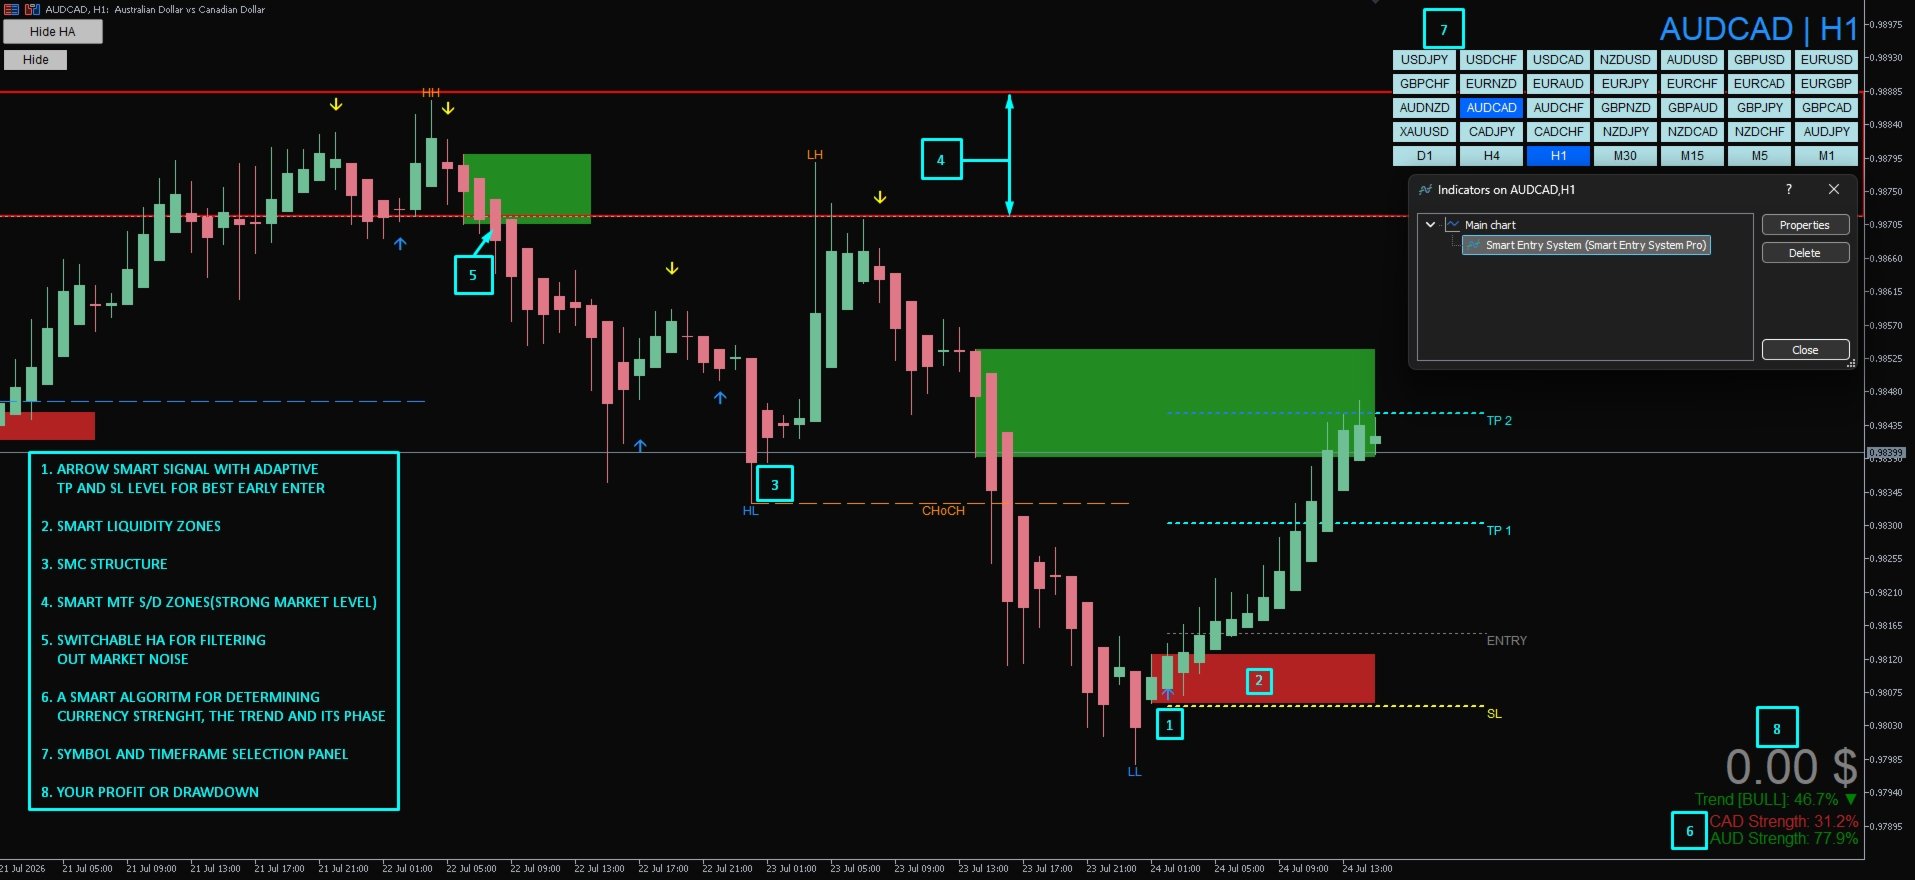
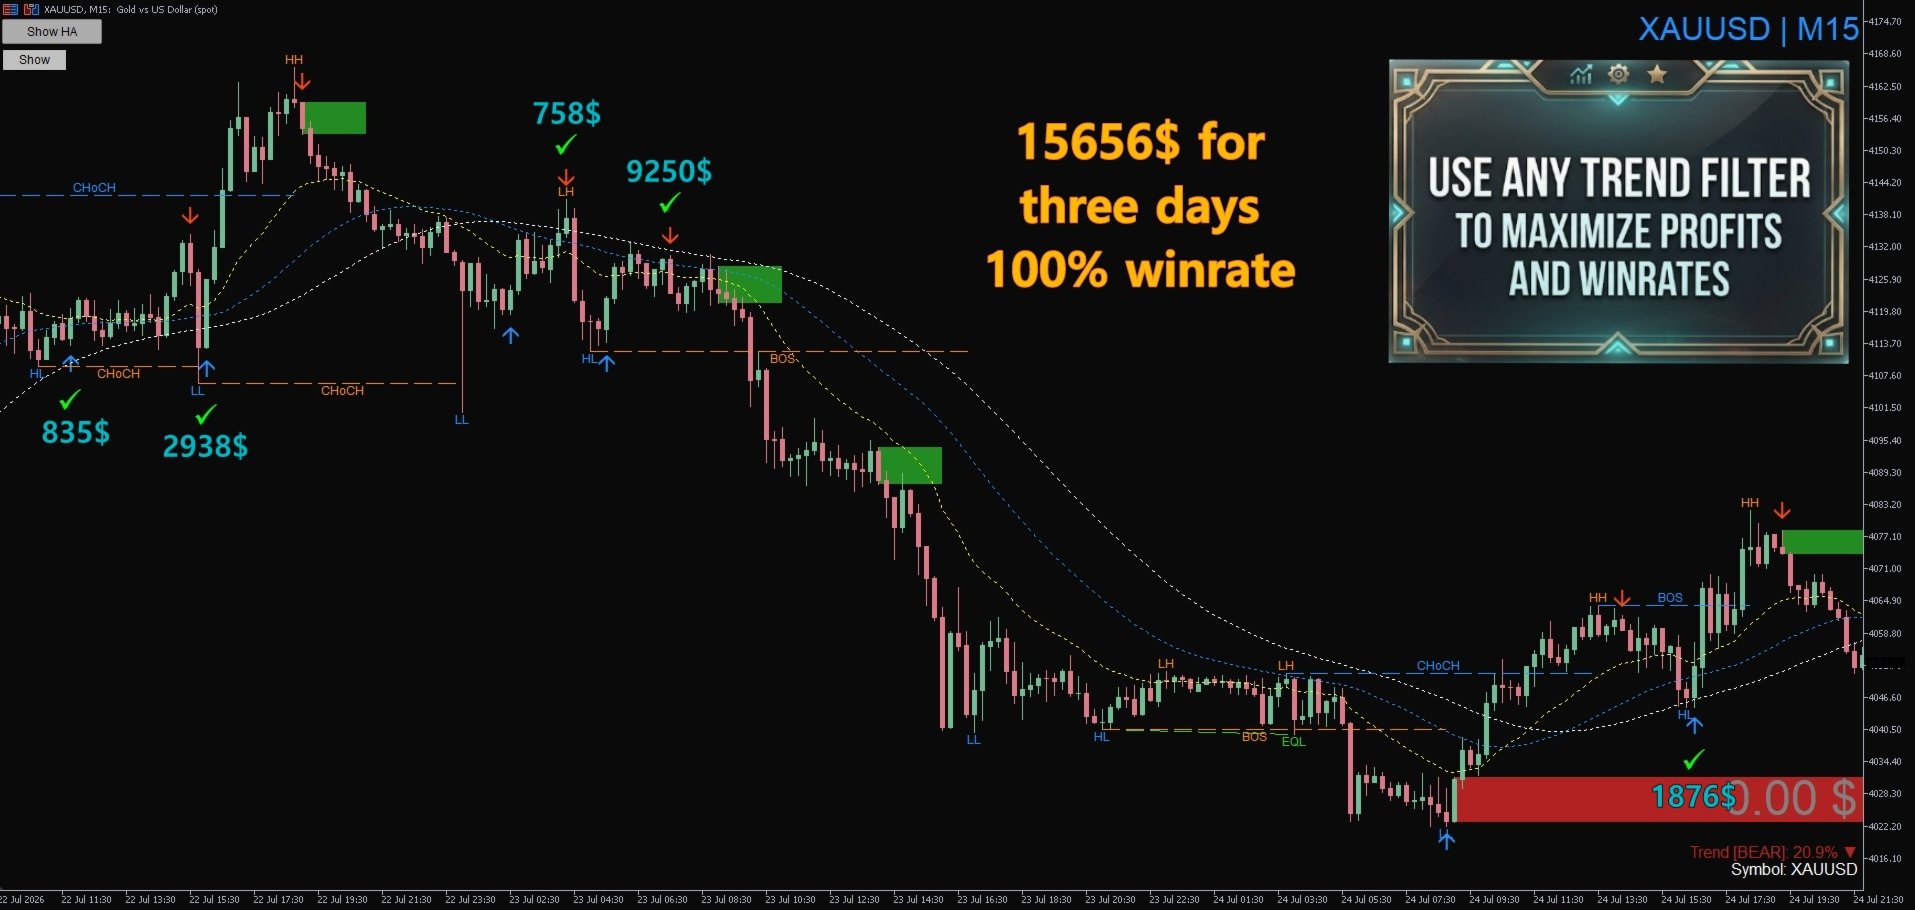
- Smart arrow indicator without redrawing with adaptive SL and TP;
- SMC market structure; - Smart liquidity zones;
- Heiken Ashi with a hide/show button;
- Smart S/D zones;
- Trend Filter;
- Currency and trend strength;
- Symbol and timeframe switcher panel;
- Profit/loss display.
System features:
- Clean visual appearance;
- Ease of market analysis;
- Early entry signals for trend reversals or pullbacks;
- A set of essential utilities;
- Flexible signal sensitivity settings for cleaner trades.
Contact me and I will answer all your questions and provide support after you purchase the trading system.
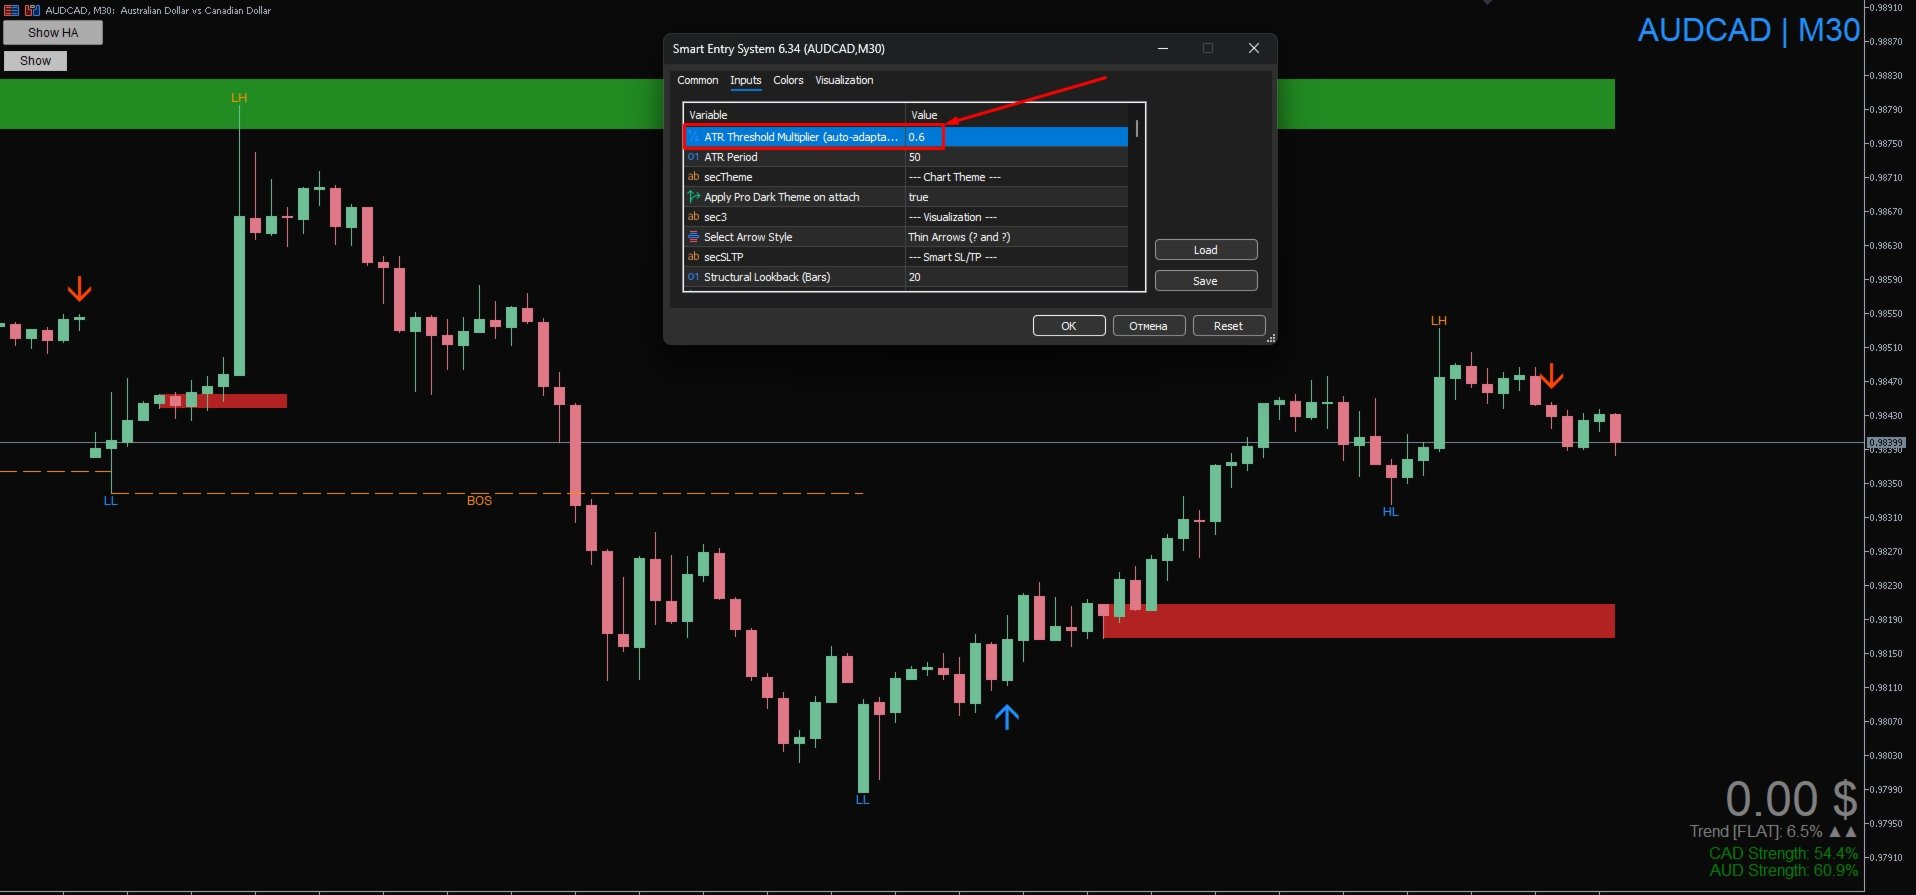
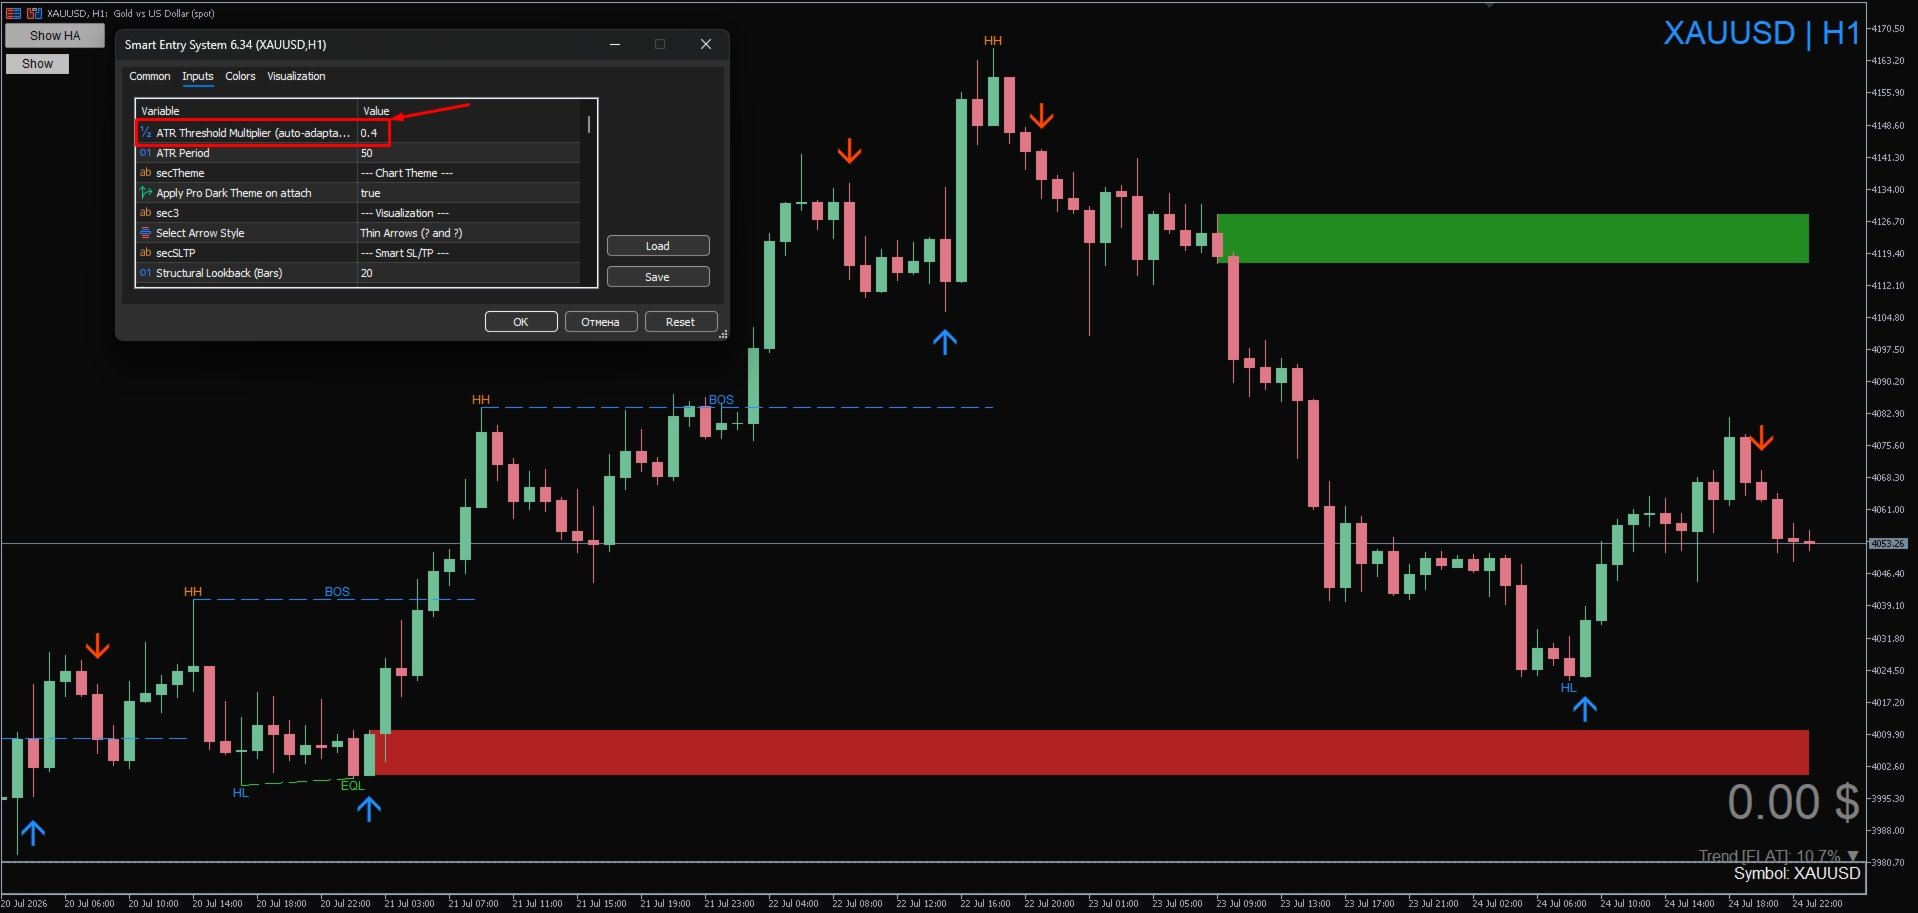
TO OBTAIN THE BEST TRADE SIGNALS, AS WELL AS WHEN TESTING THE DEMO VERSION OF THE SYSTEM, SET THE ATR TRESHOLD MULTIPILER PARAMETER TO 0.3 TO 0.7. BY DEFAULT, THE VALUE IS 0.3 FOR MAXIMUM SIGNAL SENSITIVITY. SELECT THE OPTIMAL PARAMETER VALUE FOR YOU, DEPENDING ON THE TIMEFRAME AND PAIR YOU ARE USING. FOR LATER TIMEFRAMES, THE PARAMETER VALUE SHOULD BE LOWER, AND FOR YOUNGER TIMEFRAMES, IT SHOULD BE HIGHER.
RECOMMENDED ATR TRESHOLD MULTIPILER VALUES:
The value of the auto-adaptation algorithm depends on the trading instrument, its volatility, and your trading style.
D1-MN - 0.1-0.3; H1-H4 - 0.3-0.4; M30 - 0.4 - 0.6; M15 - 0.4 -0.7; M1-M5 - 0.5 - 1
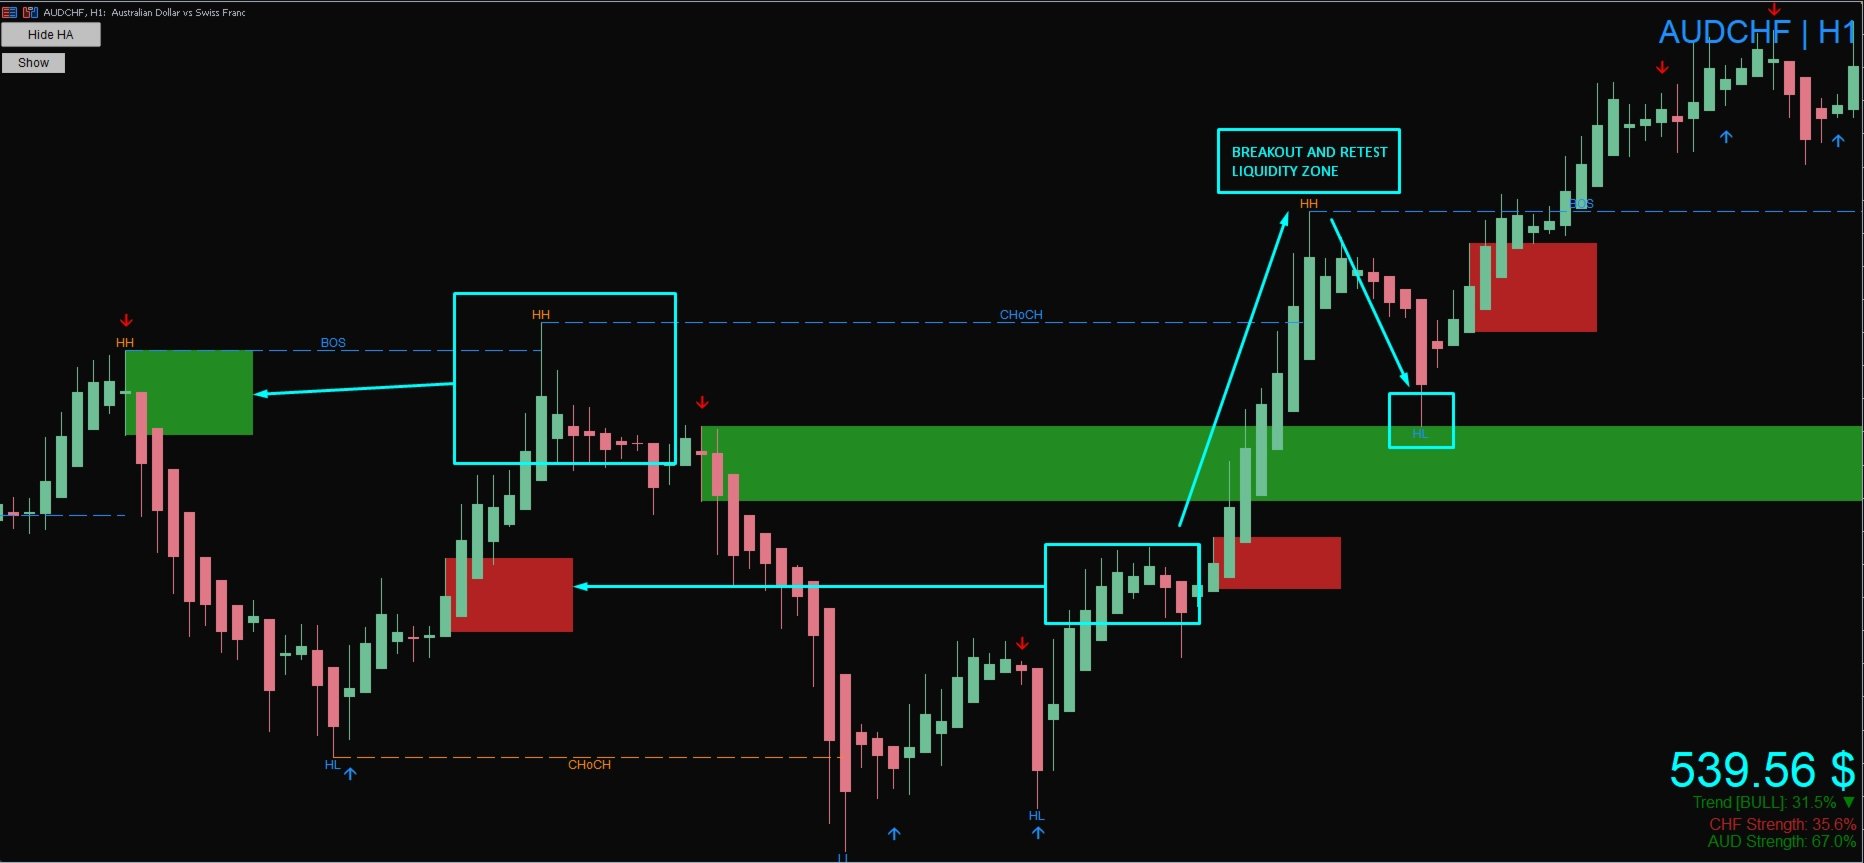
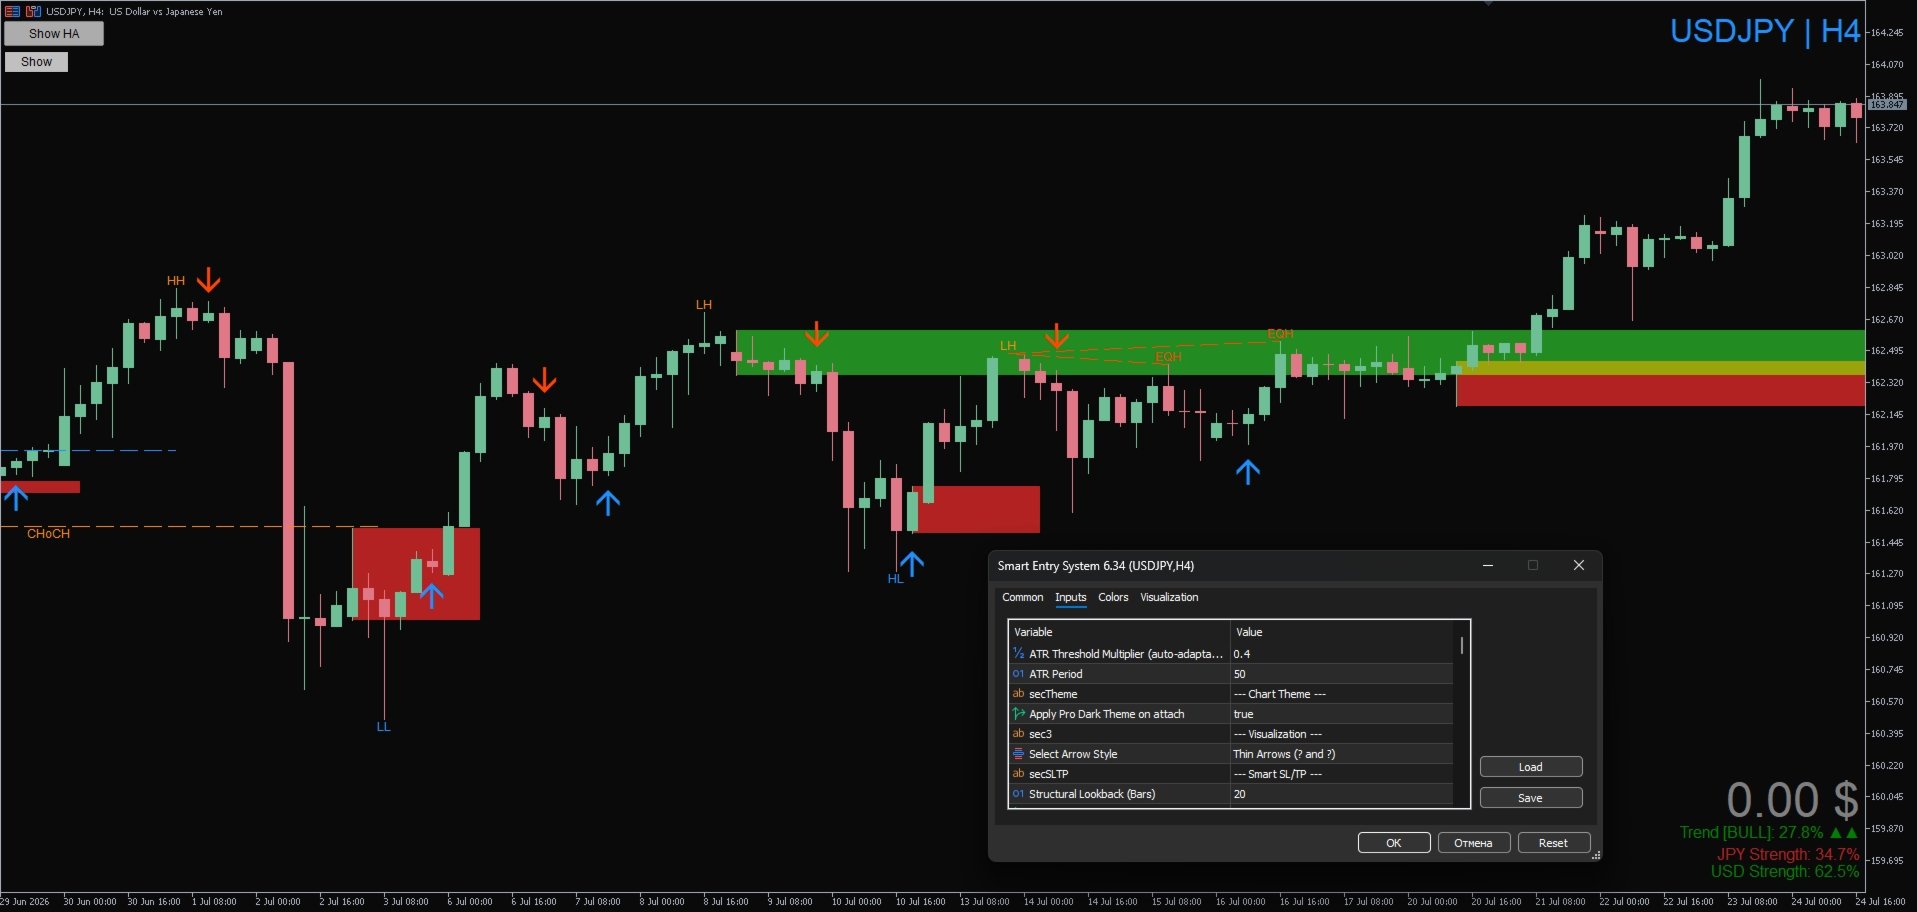
The SMART ENTRY trading system combines time-tested solutions. The SMC market structure, combined with smart liquidity zones, indicates the footprint left by major market participants. These zones act as magnets for price movements, as well as strong support and resistance levels. Once the liquidity zones are processed, they are trimmed to ensure that the chart remains clean and up-to-date. These processed zones often serve as strong support and resistance levels. They are calculated using a unique algorithm and do not appear on the chart immediately. The algorithm requires confirmation before they are displayed.
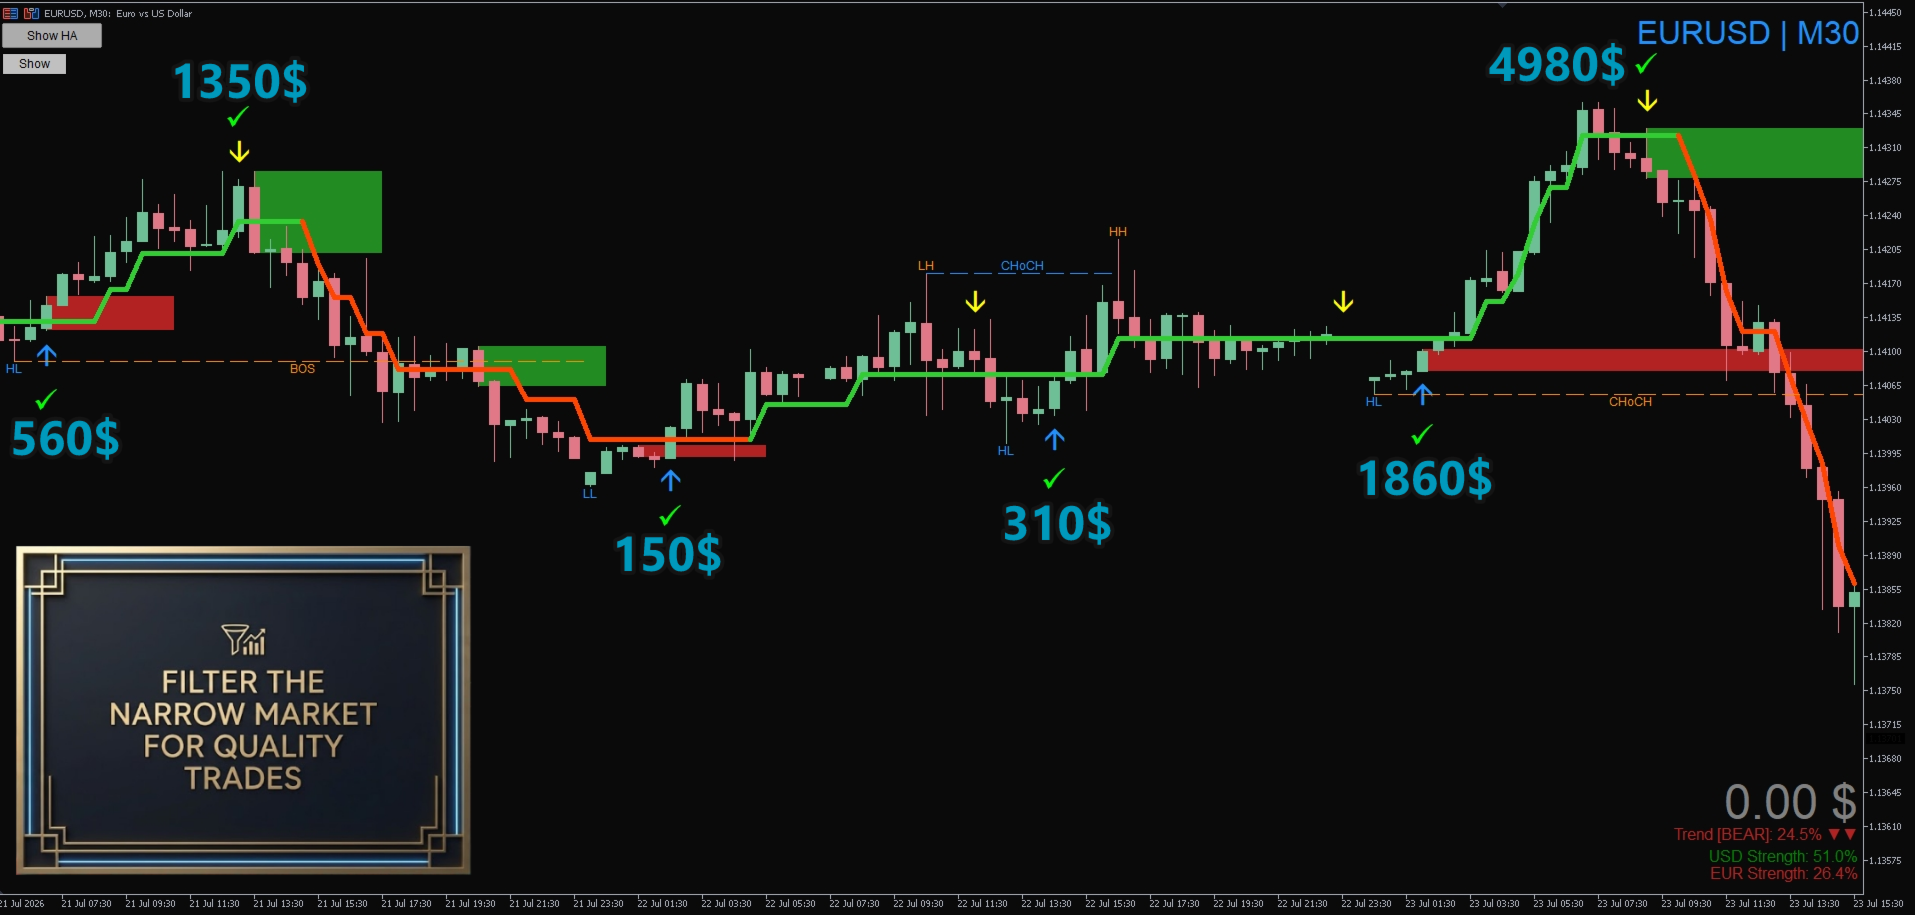
The arrow indicator is 100% non-redrawing and combines several algorithms. It provides signals for entry points. It is perfect for traders of all levels and trading styles. The arrow indicator has two alert levels. The first one-time alert occurs when a signal begins to form, indicating an early unconfirmed entry. At this point, the indicator arrow may flash. Wait for the signal to be confirmed by the second alert or the closing of the candle. The second alert will display the entry point, SL levels, and TP levels. The TP and SL levels are adaptive and adjust to market conditions. They are calculated according to a complex algorithm. If you disable the adaptive levels, they will be calculated based on ATR. You can also adjust the sensitivity of the signals by changing the auto-adaptation coefficient and the ATR period.
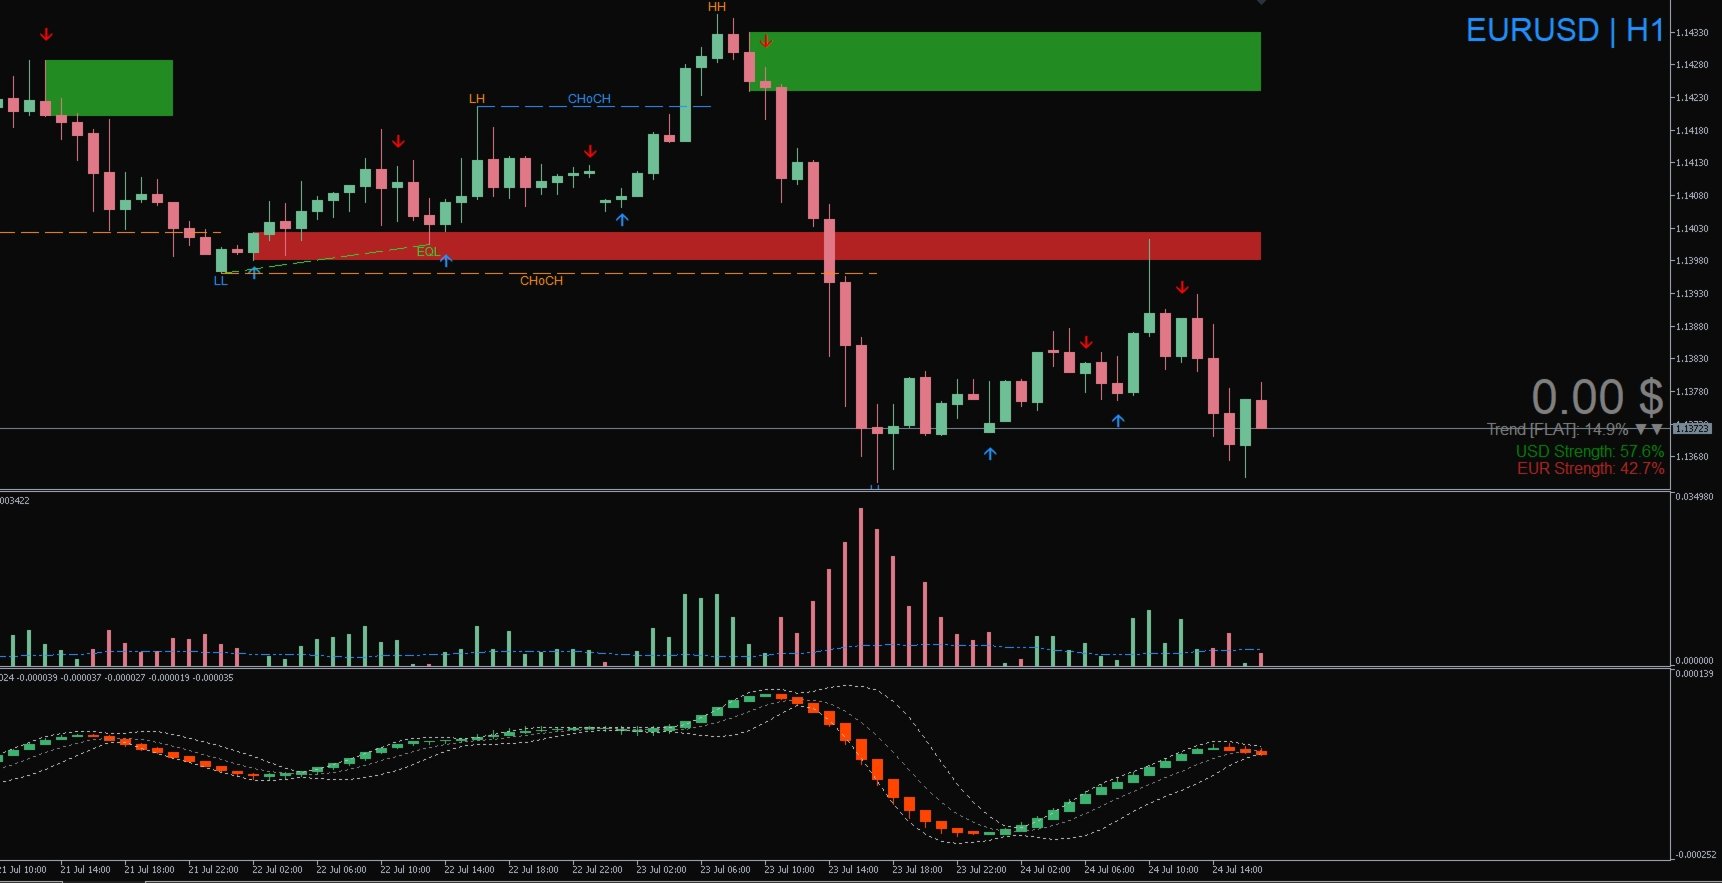
The smart currency strength indicator indicates the superiority or parity of one currency over another. It also provides complete information about the strength of the trend and its phase. If the market is flat, you will see a corresponding notification in the indicator's information area. One or two arrows indicate the strength of the trend. If you see two arrows, it indicates a strong trend. When the indicator indicates a trend, but you see an arrow in the opposite direction of the current trend, it means that the opposite side has taken the initiative and the trend has slowed down or is experiencing a reversal. If you see EXTR, it means that the "rubber band" is very stretched and the trend is at its peak - be prepared for the market to slow down and for the trend to roll back or reverse. During a flat, it is better not to enter into a trade, even if you see a signal from the arrow indicator and an impulse movement in the market - manipulation is taking place. Enter into a trade only when the indicator says that a trend has been formed.
The best trades with very high accuracy are made from liquidity zones and SMC structures. Use the trend filter to further eliminate potentially losing trades in a thin market during consolidation or a strong trend. Using HEIKIN ASHI candles helps to further filter out market noise. You can disable them by clicking the Hide HA button if you prefer Japanese candles or bars.
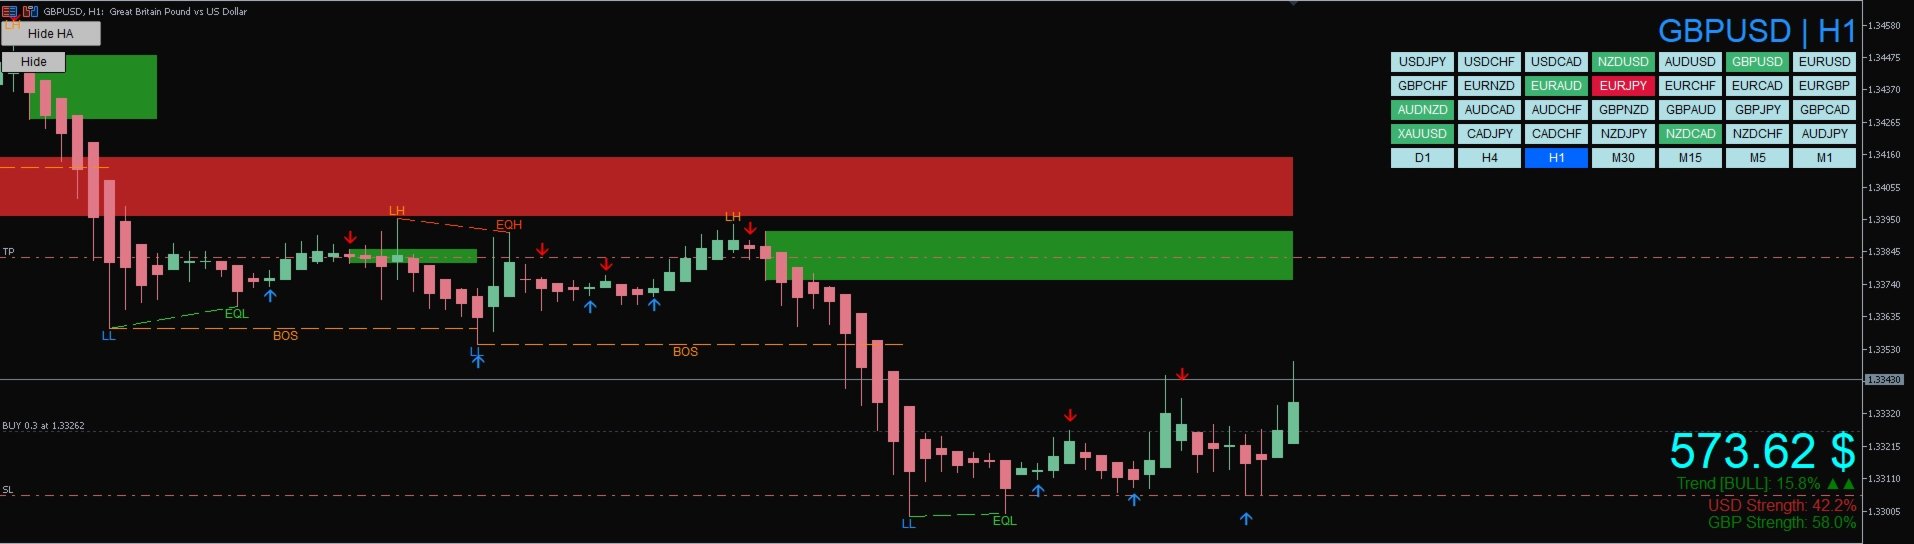
The system also has a convenient utility called the Symbol changer panel. With this panel, you can quickly switch between pairs and timeframes to analyze and make decisions about opening trades. Once you make a trade, each pair on the panel will inform you about its status, whether it's a profit or a loss, using the corresponding color of the pair's icon (red or green). By default, the system is set to automatically display the available pairs from your broker. However, you can switch to manual mode in the system settings and enter the comma-separated list of pairs you want to display. If your broker uses a prefix for symbols, such as XAUUSD.m or GBPAUD.h, you must enter the symbol with your broker's prefix in the input field, as shown in the Market Watch window. You can also hide it from the chart using the Hide button.
Above the currency strength and trend information window, your profit or loss on open positions is displayed. In the settings, you can choose to display the profit/loss only for the pair you are on, or the total value for all open trades on all pairs. The profit/loss numbers are displayed in the corresponding color.
You can customize the layout and color scheme of the system elements to your liking. By default, the indicator uses the color theme shown in the screenshots.
There are also MTF zones in the system. These are strong market levels that the price has formed. They are powerful support and resistance zones that the price cannot pass through for a long time. The higher the timeframe of the displayed zone on the chart, the stronger it is. It is recommended to use zones that are one or two timeframes older than the current trading timeframe.
YOU CAN USE IT ON ANY TF WITH THE RIGHT SYSTEM APPROACH AND KNOWLEDGE LEVEL. USING ADDITIONAL FILTERS IS RECOMMENDED TO USE THE SYSTEM ON YOUNGER TF.
TRADING IN FINANCIAL MARKETS IS HIGH-RISK! NO INDICATOR OR SYSTEM IS A "MONEY" BUTTON OR A PRINTING MACHINE! WITH THE RIGHT SYSTEM APPROACH, THE SYSTEM GIVES A HIGH STABLE RESULT.