HiveMind Portfolio
- Experts
-
Lucas Johannes Martinus Vercoulen
 My name is Luc, 25 years old and living in The Netherlands.
 - Versione: 1.10
- Aggiornato: 24 settembre 2026
- Attivazioni: 5
HiveMind Portfolio — four strategies, sixteen setups, one EA.
Four separate strategies are hardcoded into the program: no set files to import, no external configuration, nothing to maintain. They trade independently of one another across eight markets, and the entire portfolio runs from a single chart, operated through an interactive dashboard.
What this portfolio is trying to do is spread its returns rather than maximise them. A range breakout needs volatility. A weekly index position needs time. A volatility trigger needs neither a session nor a trend. A support/resistance breakout needs a level to hold and then give way. Because they ask for different conditions, they rarely go quiet at the same moment, and no single market condition decides how the account develops.
- No martingale, no grid, no averaging down
- Every position carries a stop loss from the moment it exists
- Risk is defined per setup, and every setup can be switched off
- One chart, one instance — the EA trades the entire portfolio from there
- Every entry, every refusal and every reason reported in the journal
Curious about live, verified results? Check out my MQL5 signal page.
The four strategies
Modular Range Breakout
Measures a range and trades the break of it. The most broadly applicable of the four, so it carries the most weight here. Available separately.
ATR Pulse Engine
A volatility trigger instead of a clock. It waits for a candle genuinely larger than current volatility, which puts it to work at moments the time-based setups are not looking at. Available separately.
Turn Around Tuesday
An alternative approach to the Turn Around Tuesday concept: a weekly position on the indices, opened and closed on fixed weekdays and held through the middle of the week. A different holding period spreads the portfolio across time as well as across markets.
SR Breakout System
Trades the break of a longer-term support or resistance level rather than an intraday range, holding a position for as long as the level stays valid instead of closing it the same day. A different definition of "level" and a longer horizon give it its own rhythm, adding a fourth, structurally different source of trades to the portfolio.
The strategies that offer more than one usable configuration are split into smaller setups instead of run as one, each with its own timing and character. None of them is large enough on its own to dominate the account line. The Turn Around Tuesday setups are long only, following the upward drift of those markets; the large majority of the portfolio trades long and short without preference.
Sixteen setups would be unworkable as a flat list of inputs, so the dashboard is how you actually operate this EA. Setups go on and off while it runs, risk is adjusted per setup, the portfolio can be filtered by strategy or by symbol, and the charts of an entire strategy open or close in a single click. Nothing needs a restart.
Finding your way around the menu
The setup list
The heart of it. Every setup appears with a switch: turn one off and it stops trading, turn it back on and it resumes. Open a setup and you can set its magic number, its risk and its risk mode on the spot — or, for a Turn Around Tuesday setup, its exposure and its stop loss. No inputs, no restart.
Two filter rows
One for strategy and one for symbol, sitting above the list. They work on separate axes and your selection is the intersection of the two. Pick Modular Range Breakout and XAUUSD and you have exactly the gold breakout setups — not everything on gold, and not every breakout setup. Each row has its own "All" to clear or fill that axis in one click.
Open Selected and Close All Charts
Open Selected opens a chart for every setup in your current selection, and Close All Charts clears them again. Together they let you page through your setups quickly: open a strategy, look at each chart, close them. Every opened chart carries the key information for that setup on it, so you can see what it is doing without going back to the menu.
Performance
Reports realised results per period, scoped to whatever you have selected — one setup, one strategy, one symbol, or the whole portfolio.
Account Protection
Everything that applies to the account rather than to a single setup: a maximum total drawdown that blocks new entries, a daily drawdown limit that closes what is open, a profit target that closes everything once it is genuinely reached (spread and commission included), the news filter, and prop firm mode. Each can be measured against a fixed starting balance or a trailing equity high, and each can be left switched off. Your choices survive a timeframe switch, a recompile and a terminal restart.
Getting started
Deliberately simple. Attach the EA to one chart and that is all. Every other chart on your terminal may be closed — the chart the menu sits on is only a host, and has nothing to do with what the EA trades or when. It does not matter which symbol or timeframe you choose, though EURUSD is recommended simply because it is the most consistently quoted symbol at almost every broker, which keeps the menu responsive at all hours.
What runs where, and at what risk
Every setup is listed below with its magic number and the risk it carries, so you can see what a single setup can do to your account before you switch it on.
| Symbol | Magic | Strategy | Risk per trade | Risk per trade in backtest reports | Frequency |
|---|---|---|---|---|---|
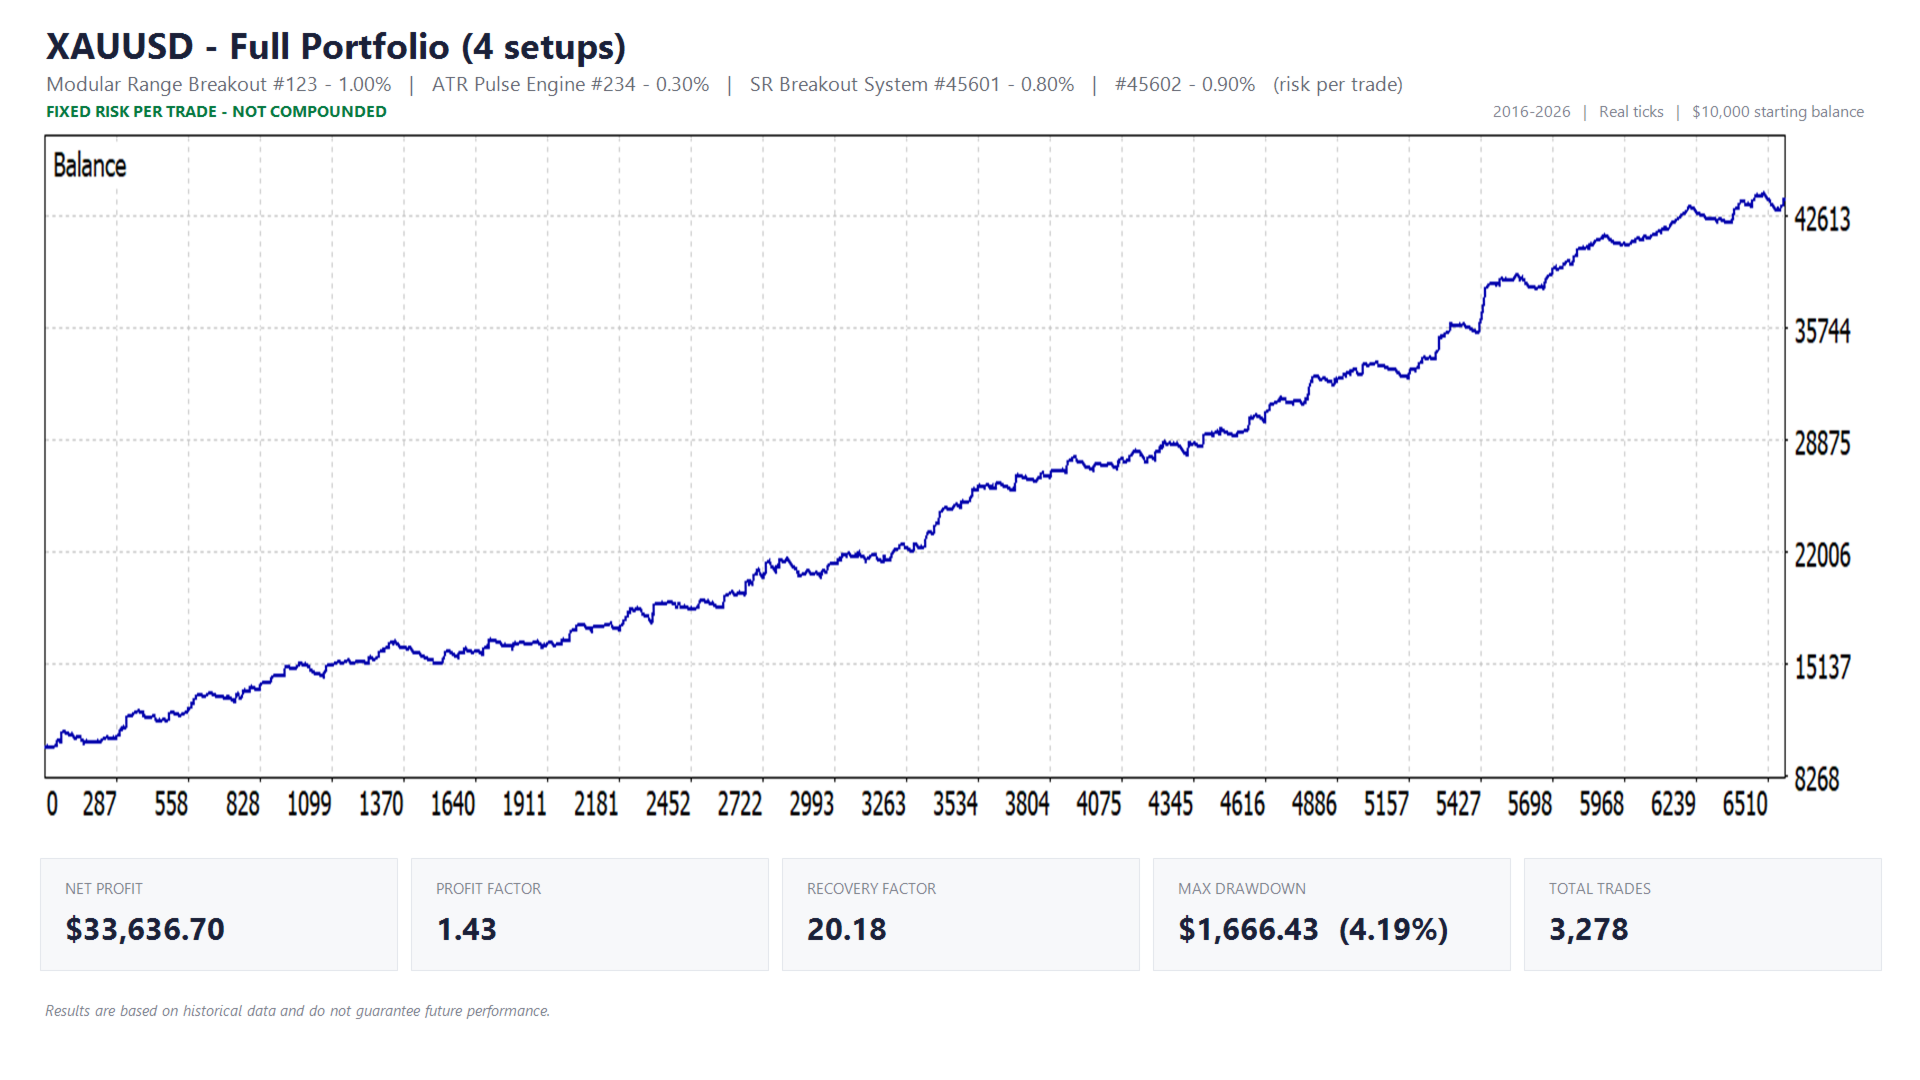
| XAUUSD | 123 | Modular Range Breakout | 1.00% of equity | $100 fixed | max. 1 per setup per day |
| XAUUSD | 234 | ATR Pulse Engine | 0.30% of equity | $30 fixed | signal driven |
| XAUUSD | 45601 | SR Breakout System | 0.80% of equity | $80 fixed | one position at a time |
| XAUUSD | 45602 | SR Breakout System | 0.90% of equity | $90 fixed | one position at a time |
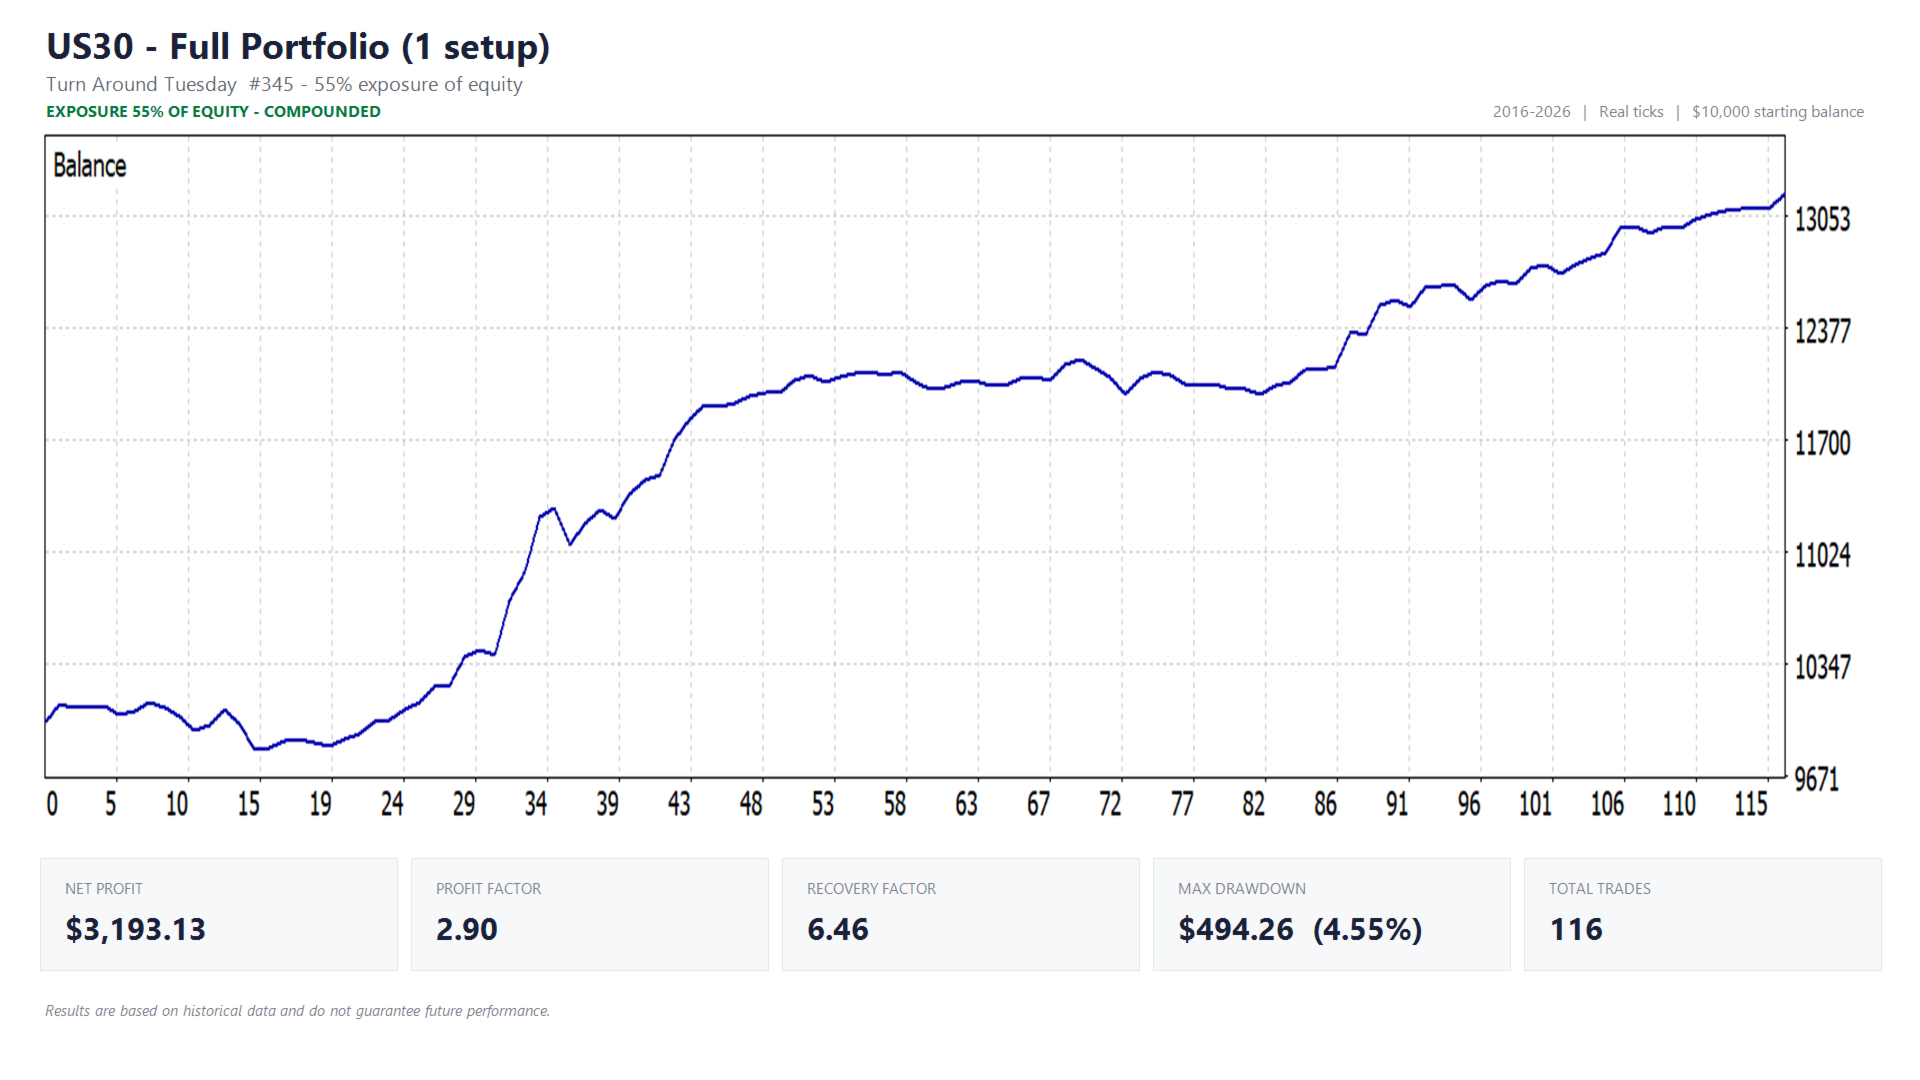
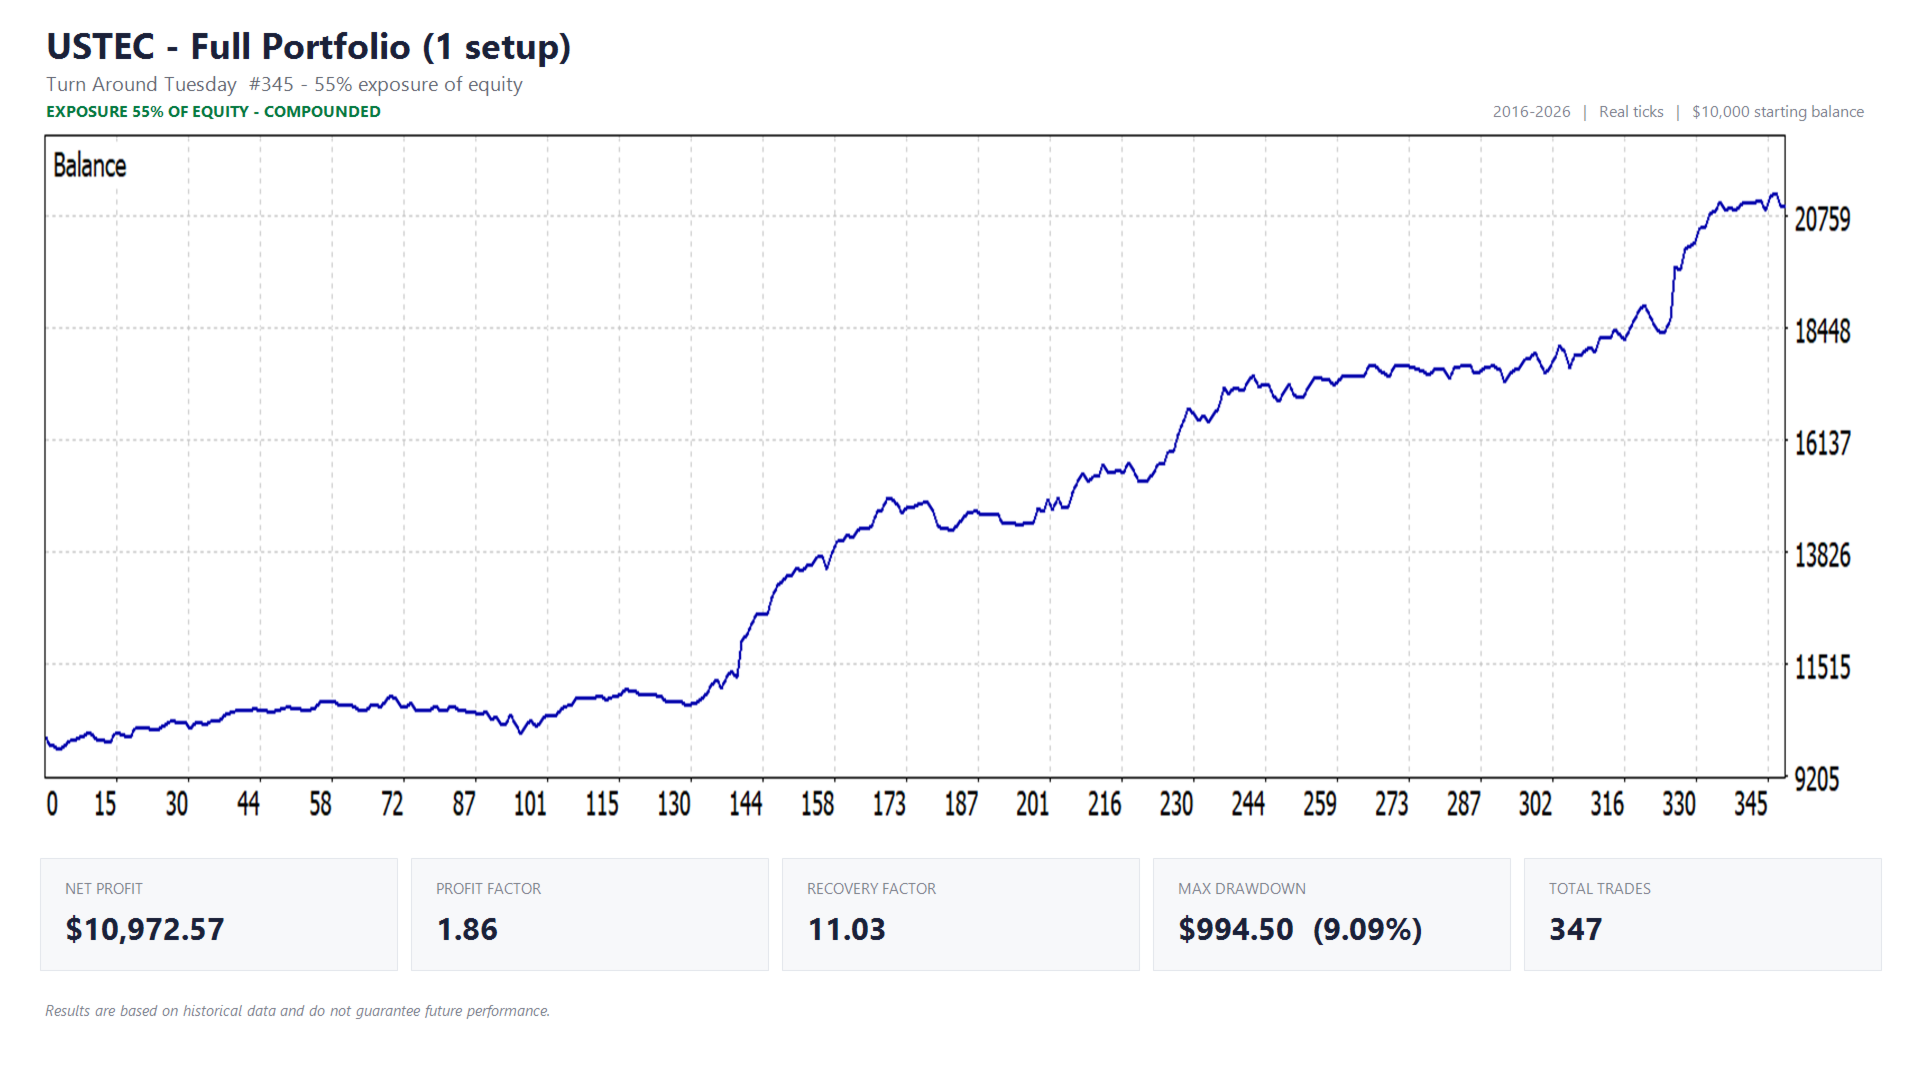
| US30 | 345 | Turn Around Tuesday | 55% exposure, stop loss 6% of entry price | 55% exposure | 1 position per week |
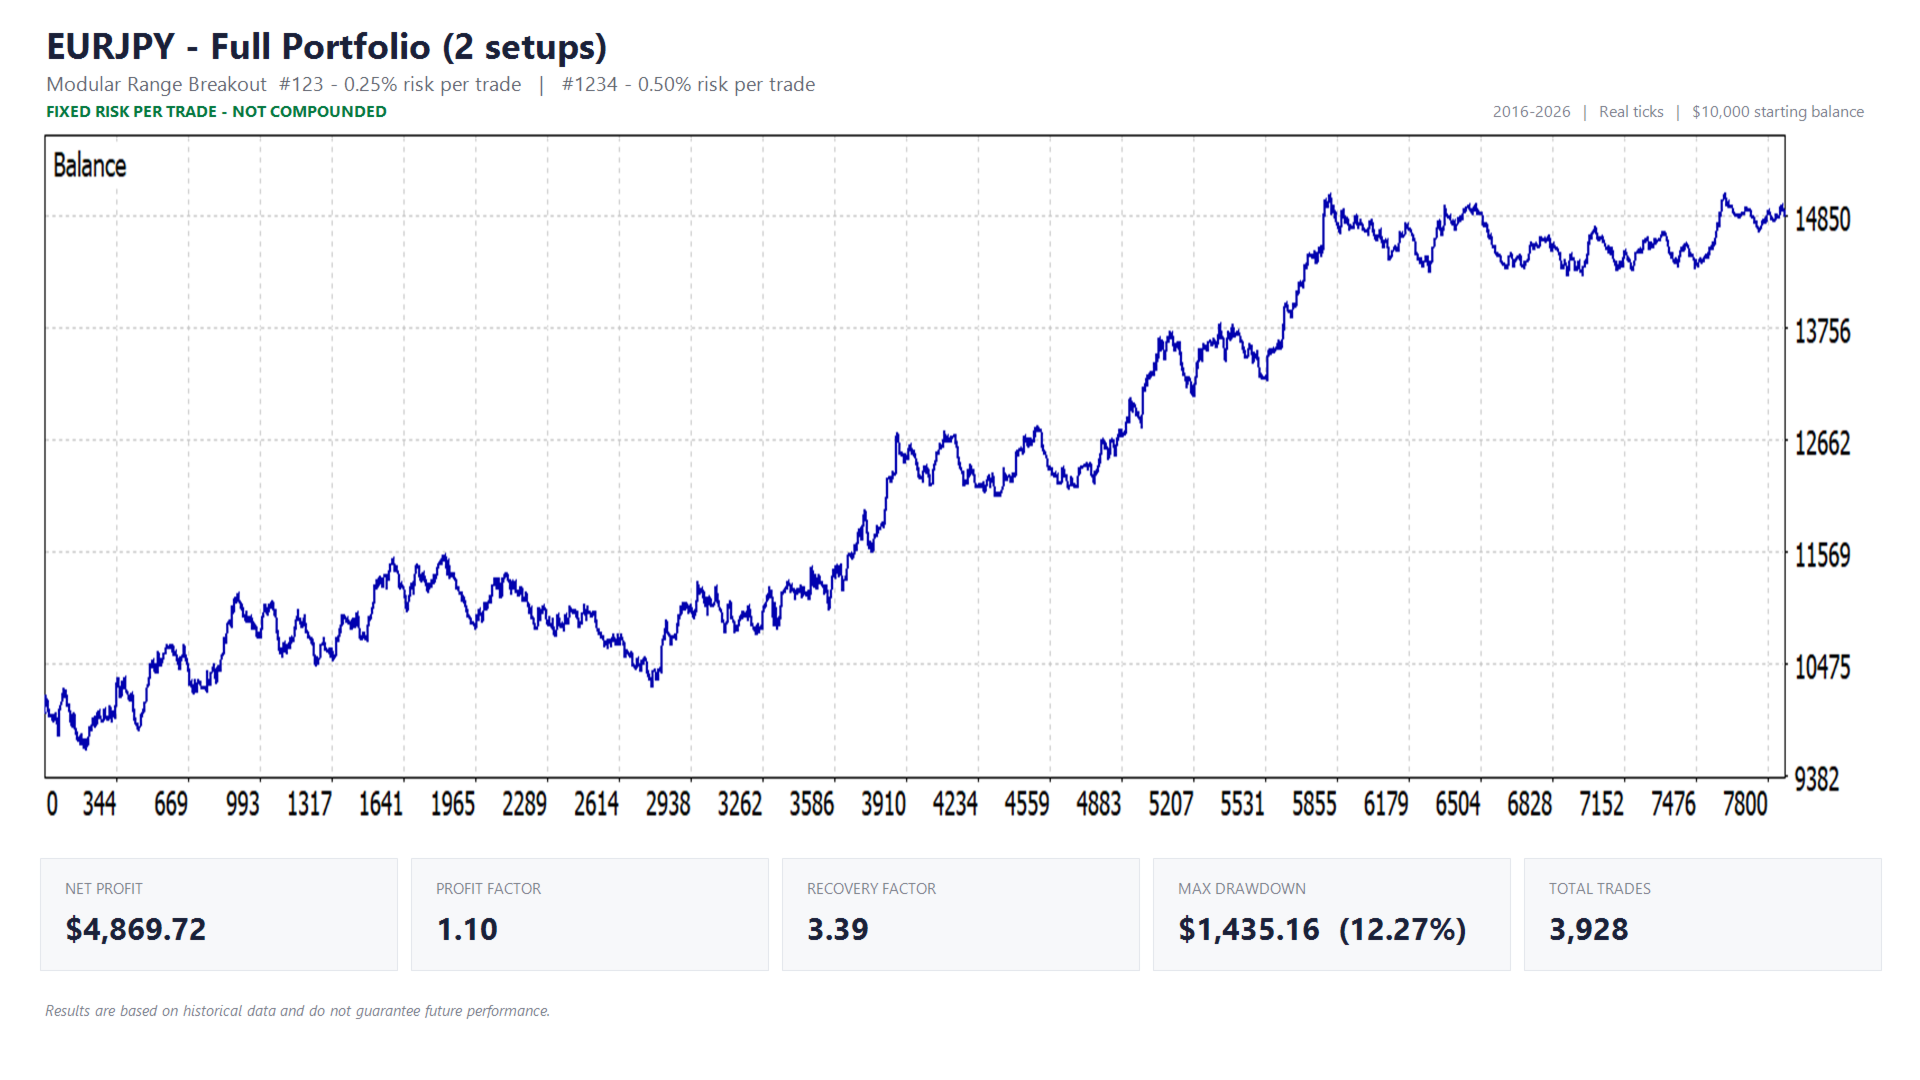
| EURJPY | 123 | Modular Range Breakout | 0.25% of equity | $25 fixed | max. 1 per setup per day |
| EURJPY | 1234 | Modular Range Breakout | 0.50% of equity | $50 fixed | max. 1 per setup per day |
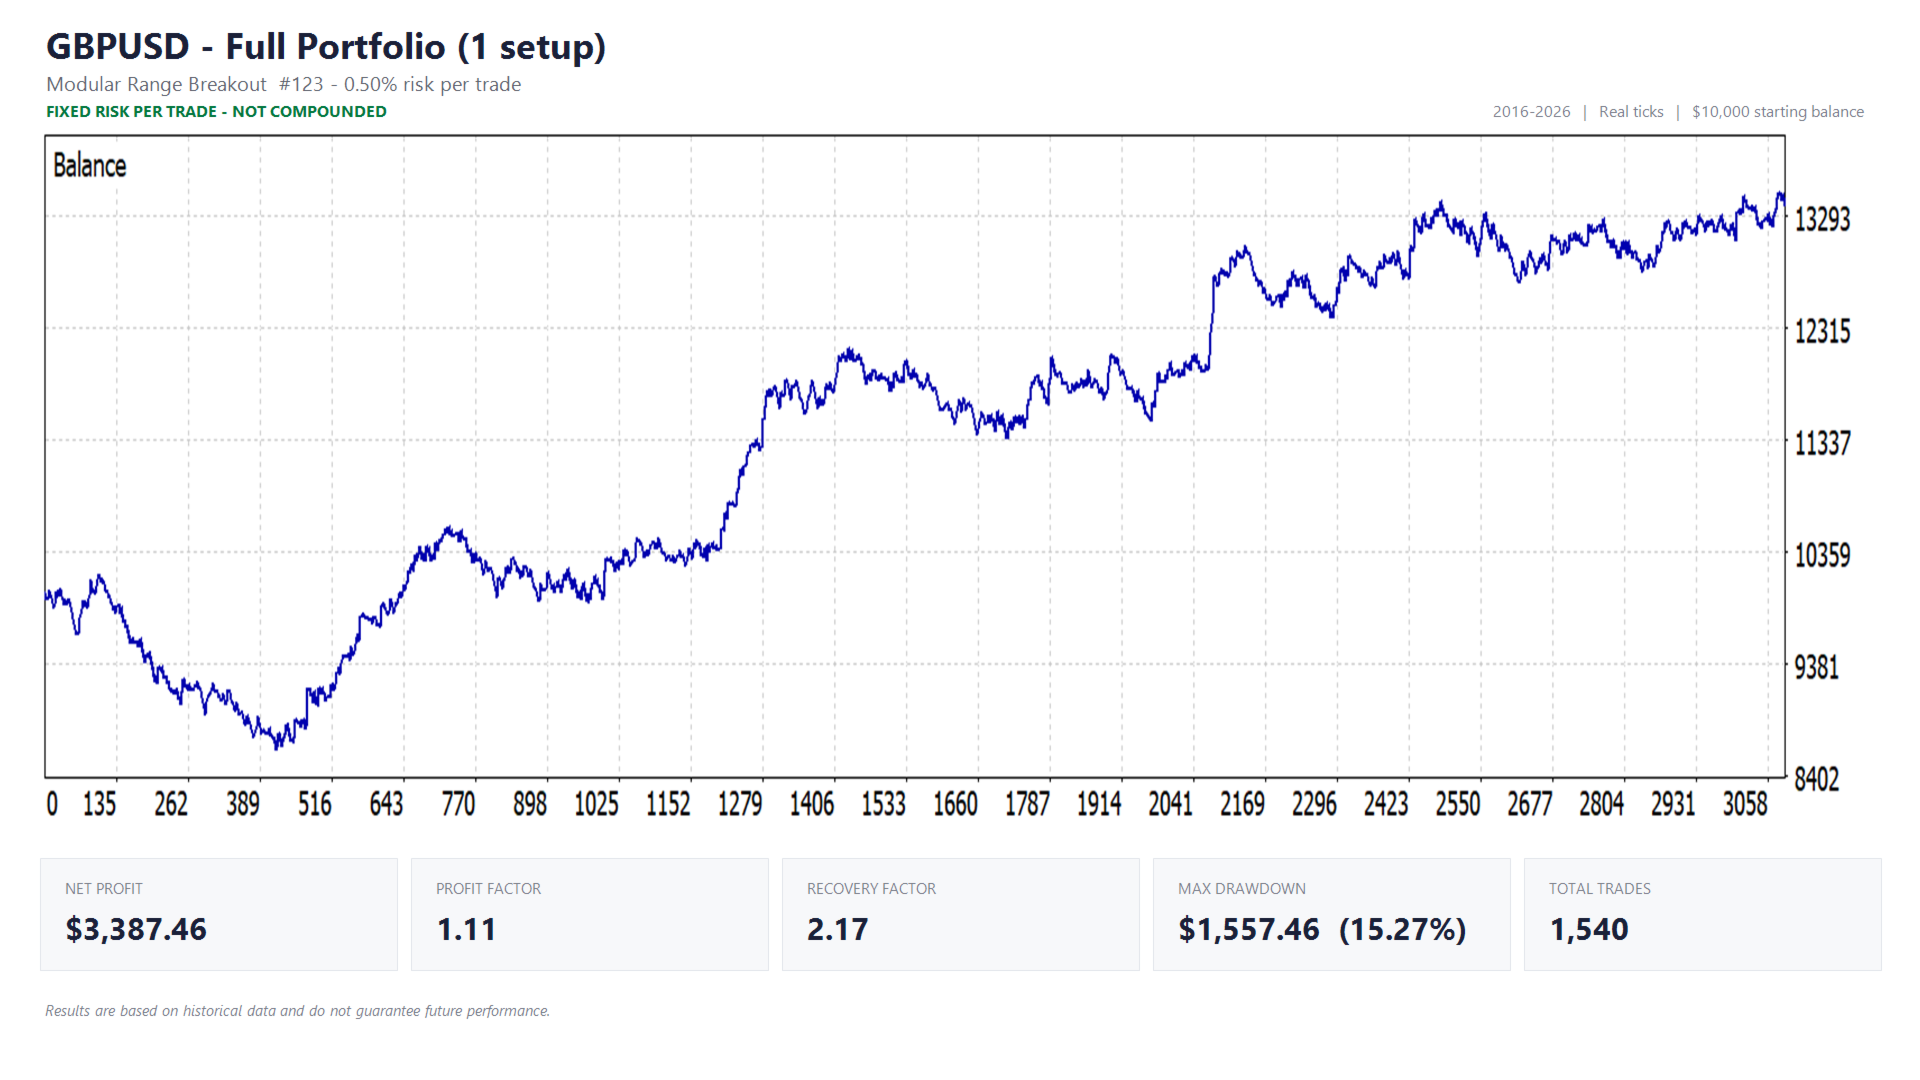
| GBPUSD | 123 | Modular Range Breakout | 0.50% of equity | $50 fixed | max. 1 per setup per day |
| USDJPY | 123 | Modular Range Breakout | 0.50% of equity | $50 fixed | max. 1 per setup per day |
| USDJPY | 1234 | Modular Range Breakout | 0.40% of equity | $40 fixed | max. 1 per setup per day |
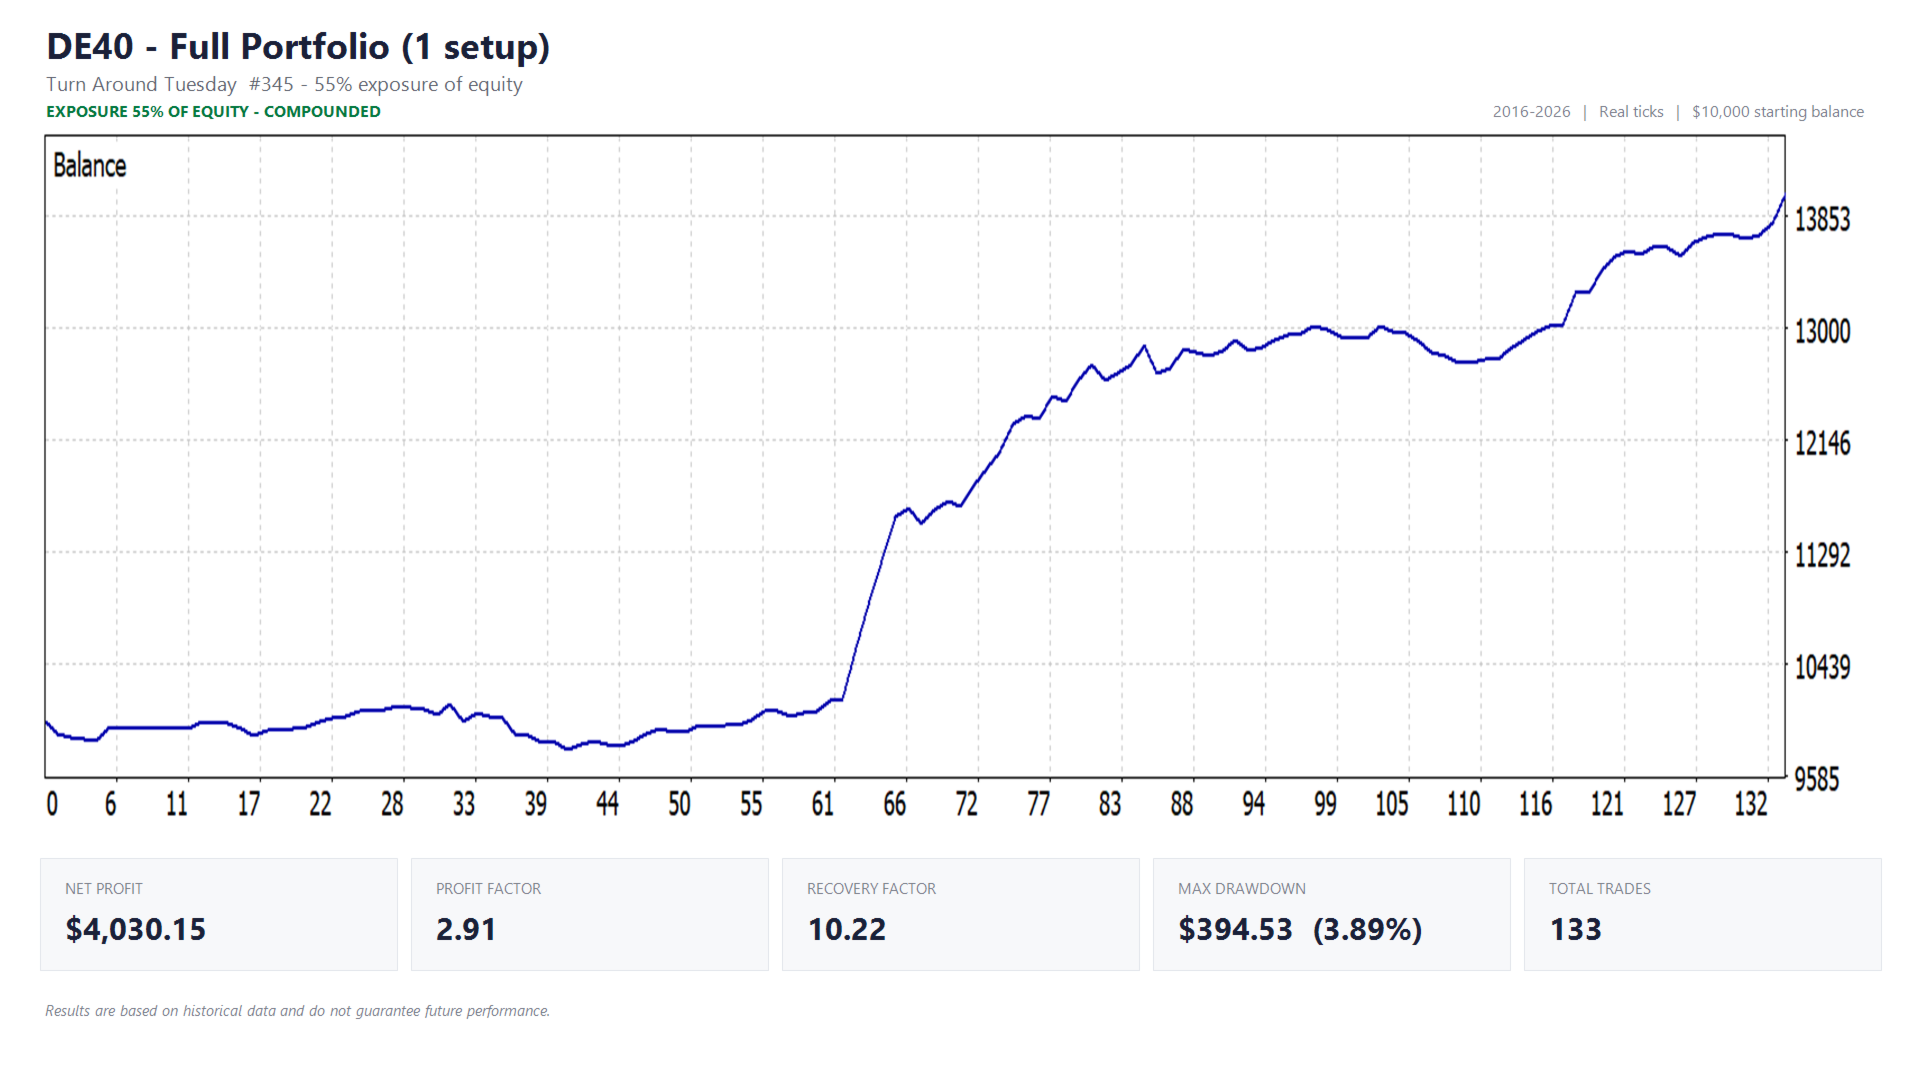
| DE40 | 345 | Turn Around Tuesday | 55% exposure, stop loss 6% of entry price | 55% exposure | 1 position per week |
| USTEC | 345 | Turn Around Tuesday | 55% exposure, stop loss 8% of entry price | 55% exposure | 1 position per week |
| BTCUSD | 123 | Modular Range Breakout | 0.40% of equity | $40 fixed | max. 1 per setup per day |
| BTCUSD | 1234 | Modular Range Breakout | 0.40% of equity | $40 fixed | max. 1 per setup per day |
| BTCUSD | 12345 | Modular Range Breakout | 0.25% of equity | $25 fixed | max. 1 per setup per day |
| BTCUSD | 234 | ATR Pulse Engine | 0.50% of equity | $50 fixed | signal driven |
The Modular Range Breakout, ATR Pulse Engine and SR Breakout System setups size their position from a percentage of equity, so the risk figure above is what a losing trade costs you. Each of these setups holds one position at a time, which means your total exposure is capped by the number of setups you have switched on.
How exposure sizing works, and why Turn Around Tuesday uses it
The three Turn Around Tuesday setups are sized differently, and it is worth understanding that before you switch them on. They do not work from a risk percentage but from an exposure percentage: at 55% exposure the setup buys a position worth 55% of your equity. On a $10,000 account that is $5,500 of the index — which is the size of the position, not the amount at risk.
What you can actually lose is bounded by the stop loss. A stop 6% below the entry price on a position worth 55% of the account costs roughly 3.3% of that account if it is hit. The stop sits that far away by design: a weekly position has to sit through several days of noise, and a stop tight enough to define the risk to the decimal would be taken out by that noise long before the week is over. The distances differ per index because the indices themselves differ in how much they move in a week.
Two practical consequences. Because the position is a share of your equity, these setups scale with the account automatically and therefore compound, where the percentage-risk setups in the backtest reports do not — which is why the Turn Around Tuesday curves on this page are labelled separately. And because they hold a position from Monday into midweek, all three indices are in the market at the same time; the exposure figure is per setup, so running all three means holding index positions worth more than your equity over a weekday night. Both the exposure and the stop loss are adjustable per setup from the dashboard.
Live trading uses the figures in the third column. The backtest reports on this page use the fixed dollar amounts in the fourth column instead — each setup's percentage applied once to the $10,000 starting balance, rather than recalculated every trade as equity grows. Over a multi-year compounded test, percentage-based sizing runs into minimum and maximum lot-size limits and quietly distorts the later part of the curve; a fixed amount does not. The Turn Around Tuesday setups are the exception, because exposure sizing has no fixed-amount equivalent: those reports run at the same 55% they trade at live. Every figure is an input and can be changed live from the dashboard.
What you can see, and what you cannot
What is published about each setup is a deliberate choice rather than simply everything there is. For every setup you can see which market it trades, roughly when to expect a position, the risk it takes, and — where the strategy works that way — how many positions it can open in a day. That is what you need in order to know when a setup will be active and what it can do to your account.
The full configuration is not published. Filters and mechanisms sit behind each setup and decide whether it acts at all on a given day, and those are not listed here.
What is reported in full is what actually happens. Every setup announces itself at startup, and every entry and every refusal reaches the journal with its reason, so you can always verify what the portfolio did and why — even where you cannot see how it decided.
Backtest results
Test conditions:
- Historical tick data: Dukascopy
- Test period: 01-01-2016 to 01-01-2026 (BTCUSD: 2018–2026, limited by available data)
- Starting balance: $10,000
- Risk per trade exactly as listed in the "Risk per trade in backtest reports" column above, for setups, strategy combinations and symbol/portfolio totals alike
- Commissions and spread set to standard broker rates within the test environment
Results are based on historical data and do not guarantee future performance. Individual setups will go through extended flat or losing stretches — that is expected, and it is exactly why there are sixteen of them rather than one.
Enabling the news filter (required setup)
The news filter retrieves the live economic calendar, so WebRequest access has to be enabled or it stays inactive:
- Go to Tools → Options
- Open the Expert Advisors tab
- Enable "Allow WebRequest for listed URL"
- Add: https://nfs.faireconomy.media
WebRequest does not work inside the Strategy Tester, so the news filter is disabled automatically during backtests.
A hedging account is recommended
On a hedging account each setup holds its own position, which is how the portfolio is designed to work. A netting account keeps only one position per symbol, so setups sharing a symbol would interfere with each other. The EA detects this at startup and, on a netting account, keeps only the first setup per symbol active and reports which ones it disabled. It runs safely either way, but a hedging account is needed to use the full portfolio.
Broker symbol names
Brokers name the same instrument differently — US30, US30.cash, DJ30. The EA resolves each setup to the matching symbol at your broker automatically, preferring whatever is in your Market Watch. If a symbol genuinely does not exist there, that setup is disabled with a clear message instead of failing silently.
Magic numbers
Every setup has its own magic number so its trades are never confused with another's. They are listed in the table above, shown in the setup list and in every journal line, and can be changed per setup if they clash with another EA on the same account.
Resetting the equity-trailing-high reference
Using a trailing equity high as your protection reference? That value is stored in a terminal Global Variable so it survives a restart, which means it can go stale after a withdrawal. To reset: press F3, find the equity-high variable for this EA, and delete it. It reinitialises from your current equity.
Nothing fails silently
Every setup reports itself in the Experts tab when the EA starts: which ones are active, at what risk, and why any of them is not. When a trade is blocked, the reason is logged. You will never be left wondering why nothing is happening.
Execution and VPS
The Modular Range Breakout and SR Breakout System setups place stop orders, so the broker watches the levels rather than the EA. The other strategies enter at market. Either way, stable execution matters across a portfolio of this size: a VPS and a broker with low costs and fast execution are strongly recommended.