Volume Pattern Intelligence
- Indicatori
- Versione: 1.0
- Attivazioni: 5

Signature Edition · DskyzInvestments · v1.00
OVERVIEW
Volume Pattern Intelligence [DAFE] is a professional volume analysis indicator for MetaTrader 5, built around institutional order flow concepts including Volume Spread Analysis, tick delta decomposition, adaptive pattern learning, and dynamic volatility scaling.
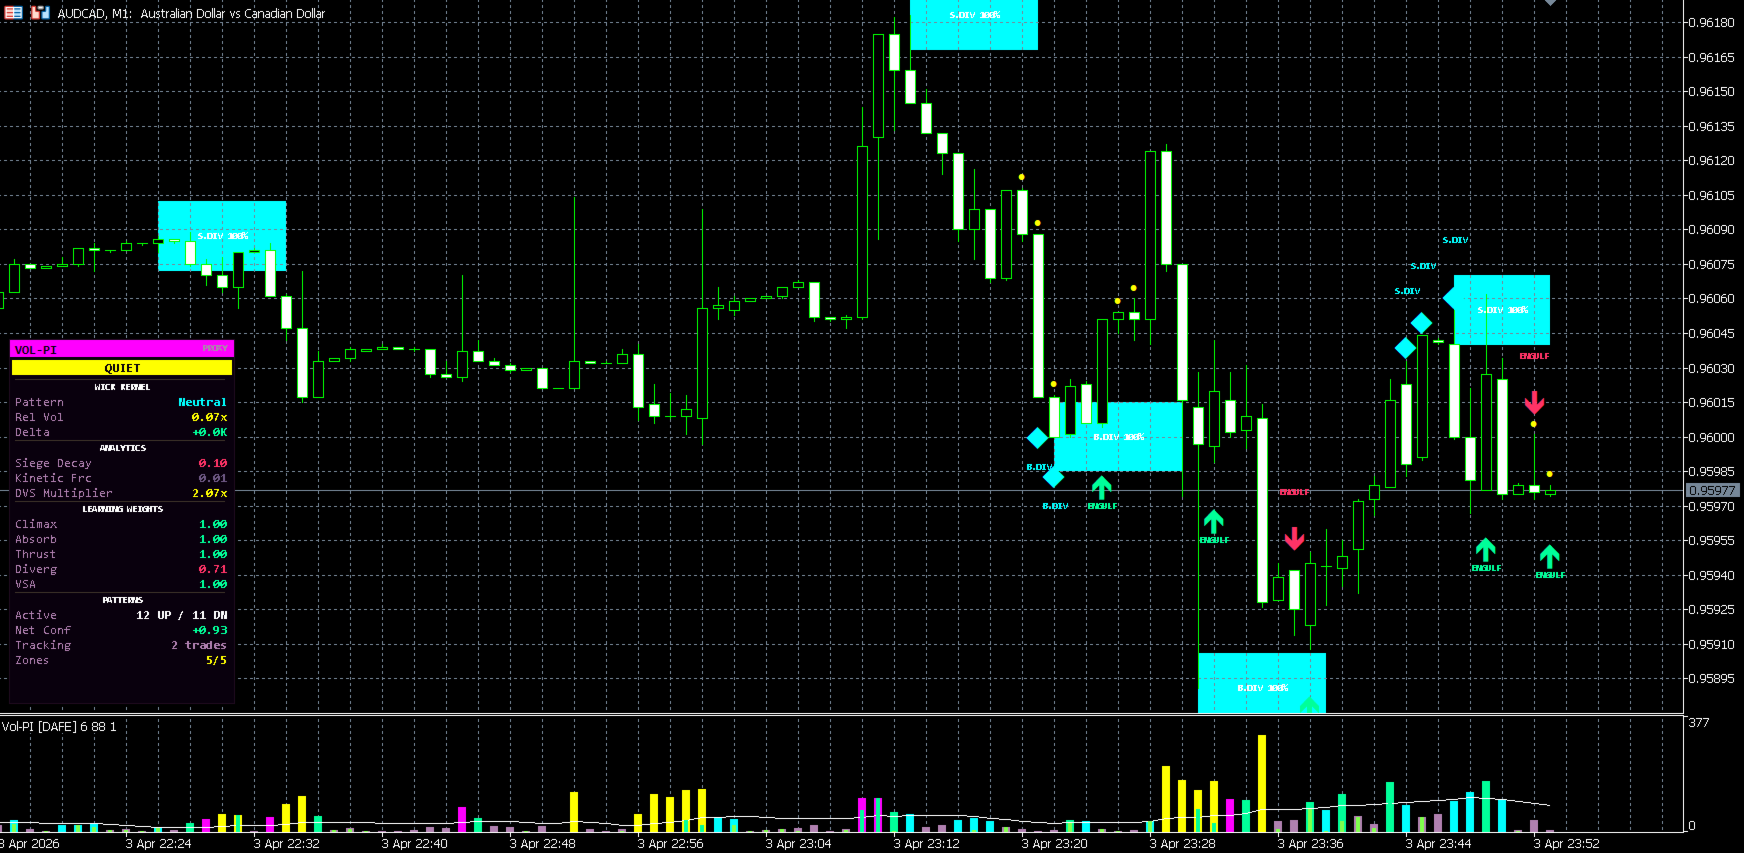
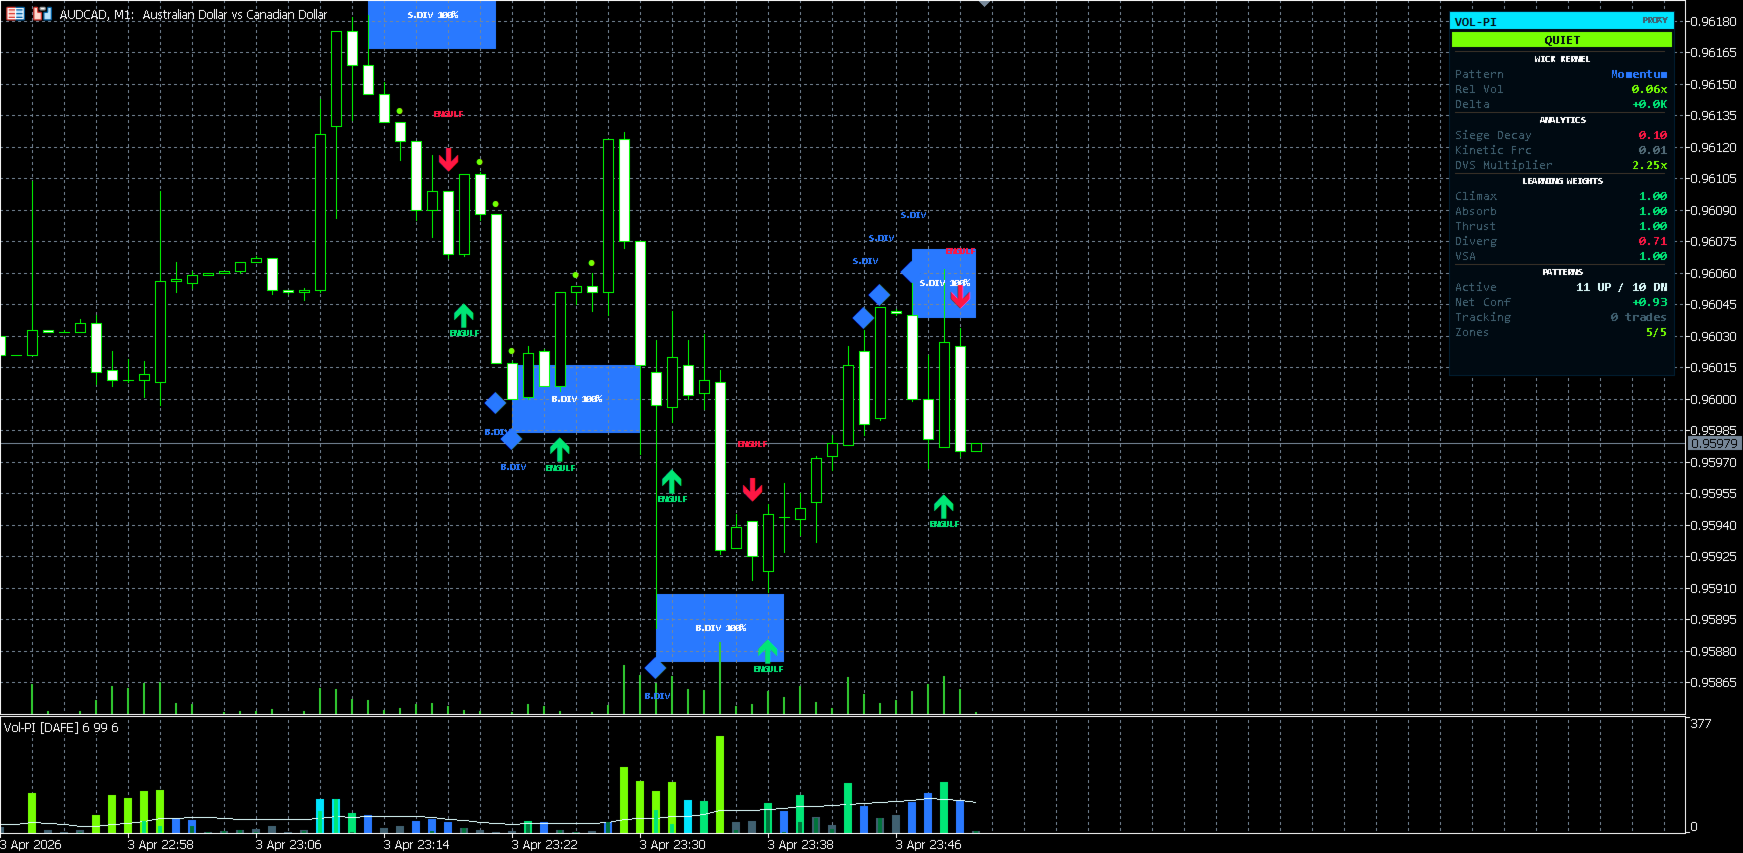
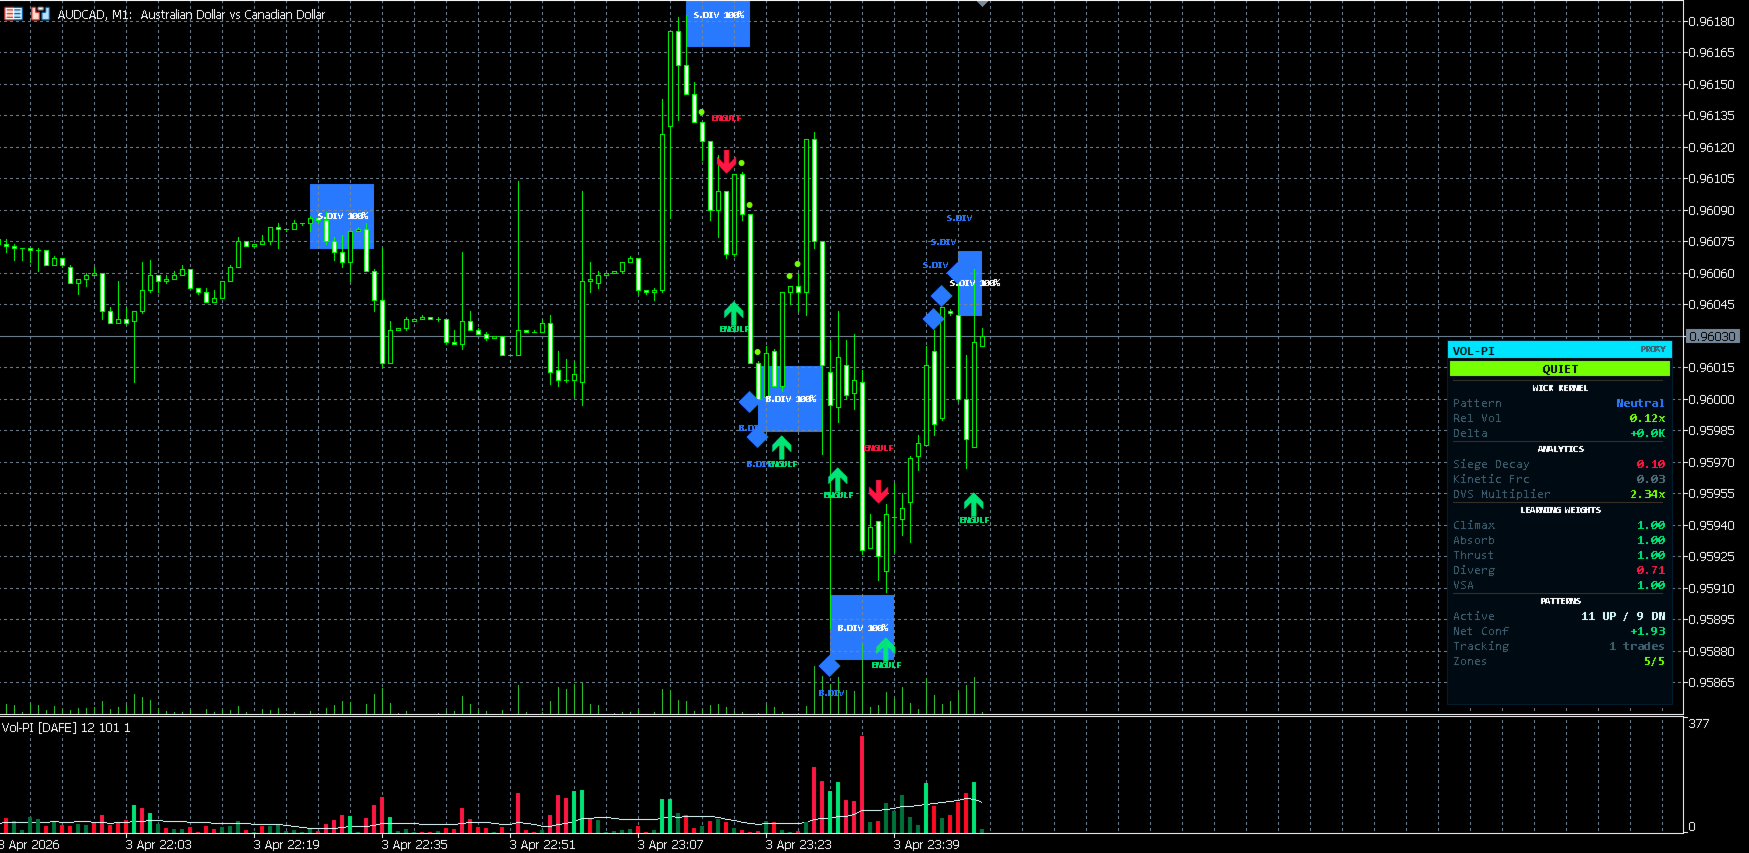
Running in a dedicated subwindow, VPI renders a color-coded volume histogram, a tick delta histogram, and a volume moving average — while simultaneously detecting thirteen distinct volume patterns on the main price chart and projecting high-confidence pattern zones.
The learning system observes which pattern types precede favorable price movement and adjusts internal confidence weights accordingly. Patterns that consistently lead to profitable outcomes gain influence. Patterns that underperform are gently suppressed — without ever being permanently disabled.
PATTERN LIBRARY
VPI detects thirteen volume and price-structure patterns:
| Pattern | Signal | Description |
|---|---|---|
| CLX UP | Bullish | Climax buying — high volume, dominant lower wick, anomalous spread |
| CLX DN | Bearish | Climax selling — high volume, dominant upper wick, anomalous spread |
| DRYUP | Neutral | Two consecutive low-volume bars — liquidity withdrawal |
| ABSORB | Directional | High volume, small body, extended wicks — institutional absorption |
| THRUST | Directional | High volume surge from quiet background — breakout initiation |
| B.DIV | Bullish | Bullish volume divergence — price at lows, volume declining |
| S.DIV | Bearish | Bearish volume divergence — price at highs, volume declining |
| VSA STOP | Reversal | High volume, narrow spread — classic VSA stopping volume |
| ASC V | Bullish | Ascending volume structure |
| DSC V | Bearish | Descending volume structure |
| HIDDEN | Bullish | Hidden strength — bullish volume on down close |
| ENGULF | Directional | Volume-confirmed candlestick engulfing pattern |
| DRYUP | Neutral | Liquidity contraction signal |
CORE SYSTEMS
Adaptive Learning Weights
Six pattern categories maintain independent confidence weights (Climax, Absorption, Thrust, Divergence, VSA, Structure). After each tracked signal, outcomes are evaluated: wins boost the relevant weight, losses apply a 50% penalty, and expired signals (inconclusive) apply a 25% penalty. A floor of 0.65 prevents any pattern category from being permanently suppressed. Weights are displayed live in the dashboard.
Dynamic Volatility Scalar (DVS)
A rolling volatility normalization layer compares current price movement magnitude against a 100-bar historical average. DVS scales pattern thresholds dynamically — meaning the same indicator works correctly in quiet consolidation and high-volatility expansion without manual recalibration.
Tick Delta System
When real tick data is available, VPI decomposes each bar into buy-initiated and sell-initiated volume using bid/ask flags and last-price sequencing. When tick data is insufficient, a price-position proxy is used. The dashboard indicates whether real ticks or proxy delta is active.
Wick Pattern Kernel (WPK)
Each bar's wick geometry is evaluated for statistical anomaly. Upper and lower wicks are compared against a 50-bar rolling mean and standard deviation, producing an anomaly score that influences Climax, Absorption, and VSA detection thresholds. Named patterns displayed: Gravestone, Hammer, Doji, Momentum, Trapped, Neutral.
Siege Decay
Measures how many times the current price level has been tested historically. Levels tested multiple times receive a decaying score — reflecting the institutional concept that repeated level tests consume available orders, reducing the level's future holding power.
Kinetic Force
A composite momentum score combining relative volume and bar range normalized to ATR. High kinetic force readings on pattern bars indicate institutional participation behind the move.
VISUAL SYSTEM
Subwindow Histograms
- Volume histogram with eight color states driven by your selected color logic mode
- Volume moving average line
- Tick delta histogram with five color states
Six Color Logic Modes
- Kernel — Delta direction × relative volume intensity
- Siege — Wick anomaly score priority
- Flux — Delta ratio gradient
- Nebula — Anomaly-weighted delta
- Thermal — Pure relative volume heat mapping
- Delta — Binary buy/sell direction
Seven Color Themes
Neon · Cyber · Matrix · Gold · Ice · Blood · Classic
Main Chart Overlays
- Arrow markers at pattern bars with label
- Divergence patterns use diamond markers with dashed reference lines connecting the two pivot points
- Pattern zones: scored, proximity-filtered, sorted by confidence × decay × recency. Capped at your configured maximum. Zone width scales to ATR.
LIVE DASHBOARD
Positioned at any chart corner. Displays:
- Volume regime (QUIET / NORMAL / ACTIVE / HIGH / EXTREME)
- Real tick vs proxy delta indicator
- Wick pattern name, relative volume, delta value
- Siege Decay score, Kinetic Force, DVS multiplier
- All six learning weights with color-coded status
- Active bull/bear pattern count, net confidence score
- Open trade tracking count
- Active zone count vs maximum
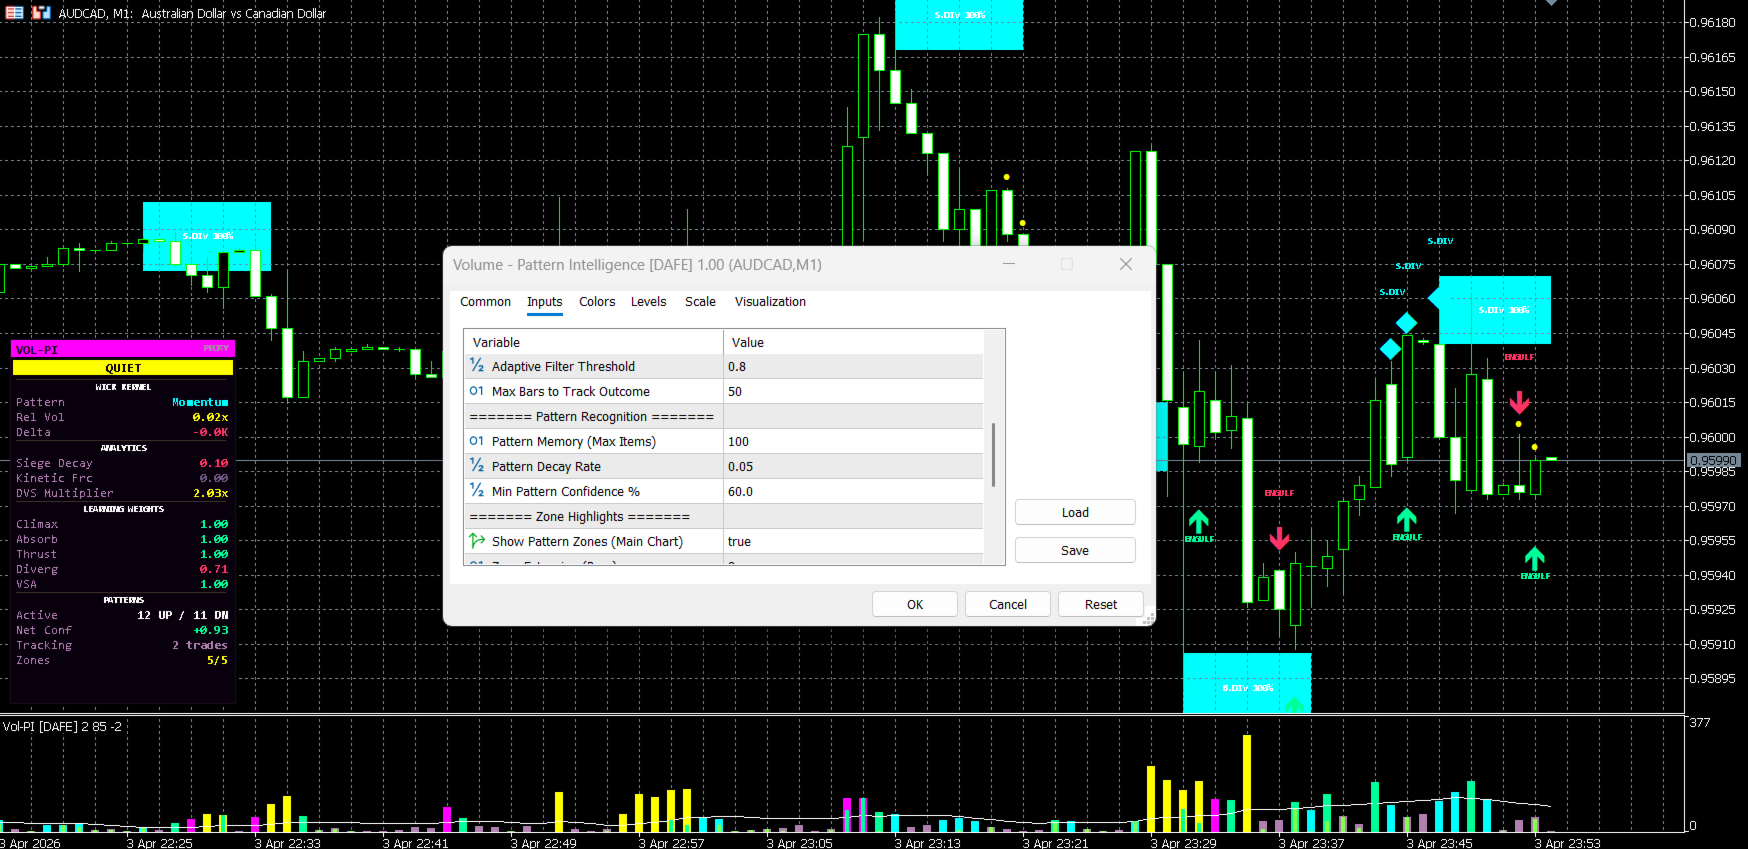
KEY INPUTS
Core Engine: Volume MA length · Climax Z-score threshold · Dry-up ratio · Absorption and Thrust volume multipliers · Real tick data toggle
Adaptive Learning: Plasticity rate · Filter threshold · Trade memory window (bars)
Pattern Recognition: Pattern memory size · Decay rate · Minimum confidence filter
Zone Highlights: Enable/disable · Zone extension bars · Maximum visible zones
Dashboard and Theme: Color logic mode · Dashboard position · Color theme
INSTALLATION
- Place the .ex5 file in: [MT5 Data Folder] → MQL5 → Indicators
- Find your data folder: File → Open Data Folder in MetaTrader 5
- Restart MT5 or right-click Indicators in Navigator and select Refresh
- Drag onto any chart — indicator opens in a subwindow automatically
Recommended starting configuration:
- Theme: Cyber or Gold
- Color Mode: Kernel (default) or Thermal for volume-only focus
- Real Ticks: Enabled (requires broker tick data)
- Filter Threshold: 0.80 — lower to see more patterns, raise to see only high-conviction signals
- Min Confidence: 60% default — raise to 70–75% on noisy instruments
- Allow 50+ bars for learning weights to begin differentiating
REQUIREMENTS
- MetaTrader 5 (all builds)
- Minimum 130 bars of history
- All symbols and timeframes supported
- Real tick delta requires broker tick data availability
- Indicator only — does not place orders
FAQ
Does this repaint?
Pattern signals are placed at the bar where the pattern is detected. On the current open bar, signals may update as new ticks arrive. After bar close, signals are fixed. This is standard behavior for any volume-based indicator that reads live tick data.
Why are learning weights all at 1.0 on first load?
All weights initialize at neutral (1.0). The system requires trade tracking cycles to accumulate feedback. On lower timeframes, differentiation typically begins within one session.
What does Siege Decay mean?
It measures how many times the current price level has been tested in the last 50 bars. A score near 1.0 means the level is fresh. A score near 0.1 means it has been tested four or more times and may have depleted available orders at that level.
Real ticks vs proxy — which is better?
Real tick decomposition is more accurate on instruments where your broker provides full tick history with buy/sell flags. The proxy method is reliable for directional bias but less precise for exact delta magnitude. The dashboard shows which is active.
Volume Pattern Intelligence [DAFE] is an analytical indicator. All trading decisions remain the sole responsibility of the user. Past pattern performance does not guarantee future results. Apply appropriate risk management at all times.
DskyzInvestments · DAFETradingSystems.com