Statistic Day
- Indicatori
- Versione: 1.0
- Attivazioni: 5

Daily Candlestick Statistics Indicator
Are you concerned about how to interpret market data and make informed decisions? Our 365-day daily candlestick statistics indicator offers you a powerful tool for analysis and forecasting!
What it does:
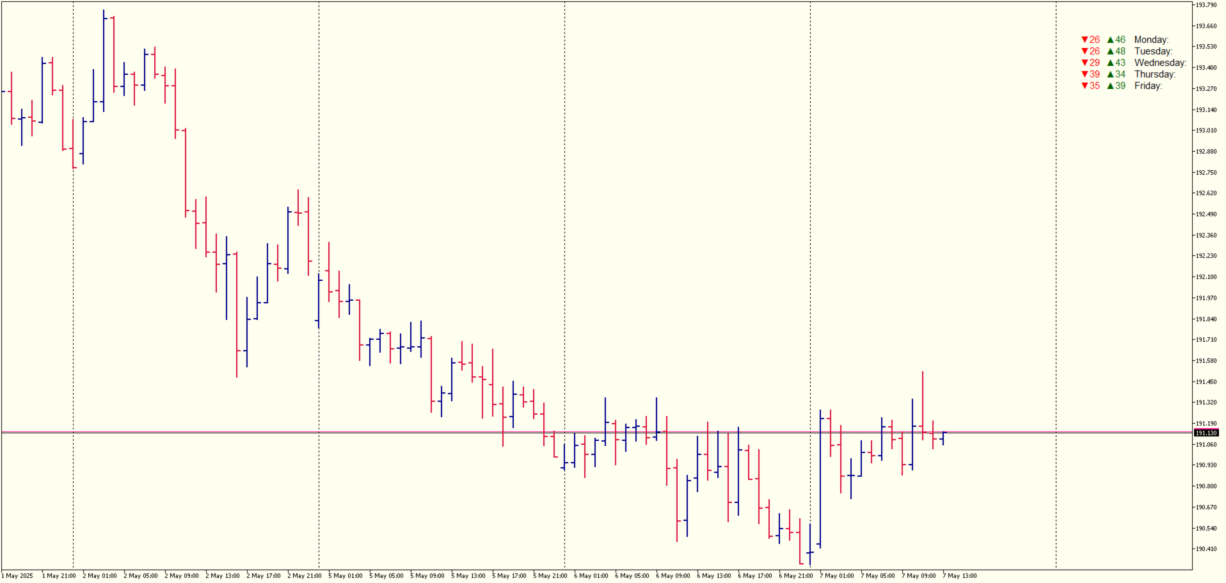
- Daily candlestick count: The indicator analyzes all candles for the past year, providing extensive statistics for each day of the week.
- Day of the week statistics: Get visual data on how the markets closed on different days. For example, you will see that 39 Mondays closed in profit, and 29 in loss.
Why it is useful:
- Confident decisions: Knowing how the market behaved on different days of the week, you will be able to make more accurate forecasts and adapt your strategies.
- Trend forecasting: Using historical data, you will be able to predict which days are most profitable and use this knowledge to your advantage.
- Ease of use: Our indicator is easily integrated into your trading system and provides information in a convenient and understandable format.
Advantages:
- Reliable data: Collecting information over a long period guarantees high accuracy.
- Ease of analysis: The intuitive interface will help you quickly get used to and start using the indicator without unnecessary effort.