Rastreador BIVIT
- Indicatori
- Versione: 1.14
- Attivazioni: 5

The "Setup Bivit" Indicator
The "Setup Bivit" is an advanced technical indicator designed for MetaTrader 5, developed to provide a clear and comprehensive visual analysis of the financial market. Inspired by customized strategies, this indicator combines intuitive visual elements and decision-support tools, making it a powerful ally for traders looking to identify trends, support and resistance zones, and price patterns across different timeframes.
With a rich and interactive graphical interface, it is ideal for both beginners and experienced traders who seek a detailed view of market behavior.
Key Features
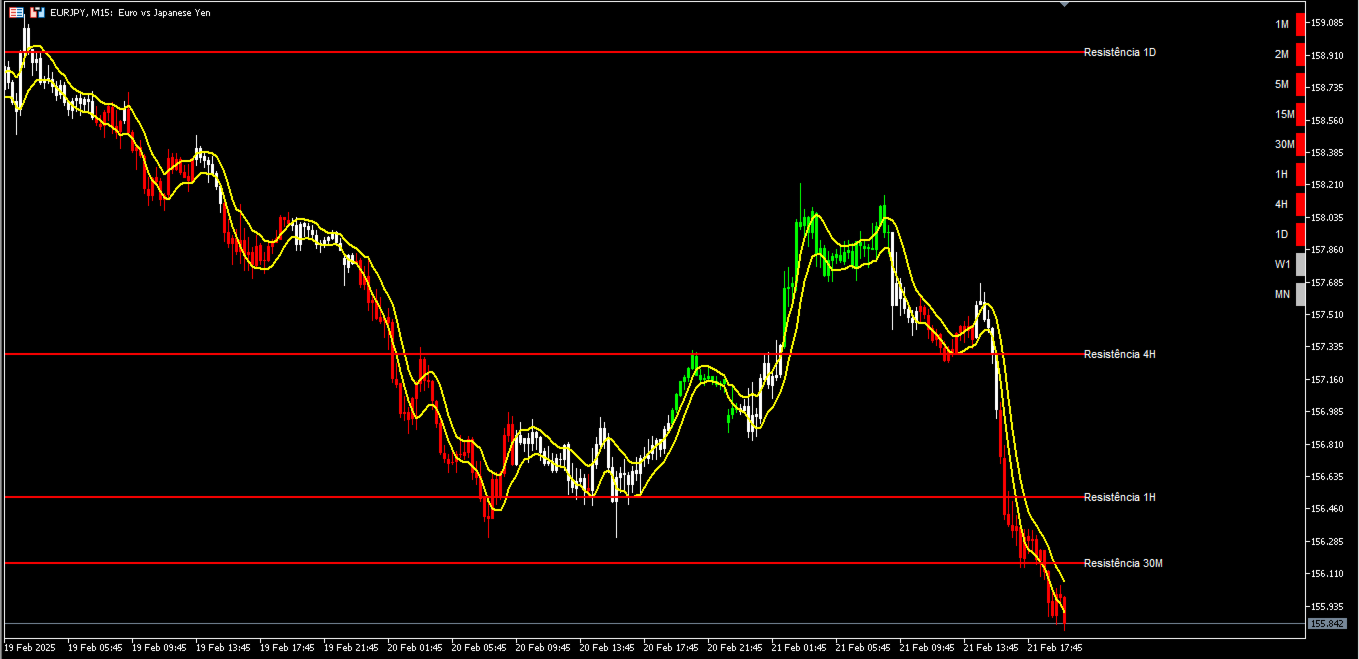
Colored Candles
The indicator highlights candles on the chart with distinct colors (lime green, red, and white), providing an immediate real-time reading of market conditions. This feature helps traders quickly identify price behavior changes.
Support and Resistance Bands
It displays two dynamic lines on the chart: an upper line (resistance) and a lower line (support), drawn in yellow with adjustable thickness for easy visualization.
These lines are accompanied by text labels indicating price levels across different timeframes, offering a clear perspective on critical zones for trade entries or exits.
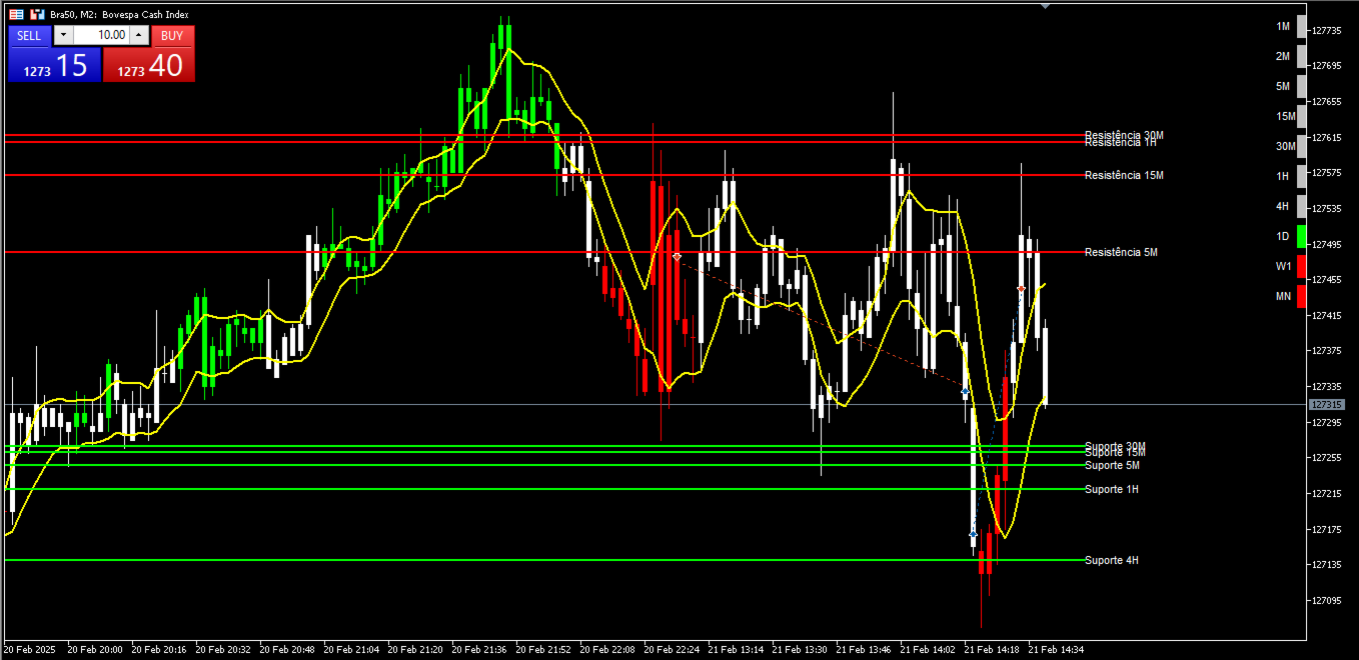
Multi-Timeframe Trend Panel
Includes an interactive panel in the upper-right corner of the chart, displaying the market trend across up to 10 timeframes (from 1-minute to monthly).
Each timeframe is represented by a colored square (green for bullish, red for bearish, and gray for sideways), accompanied by a descriptive label.
The panel allows quick navigation: clicking on a square automatically switches the chart to the corresponding timeframe.
Support and Resistance Across Multiple Timeframes
It presents horizontal support and resistance lines calculated from timeframes higher than the current one, drawn in red (resistance) and green (support).
Each line includes an informative label identifying its originating timeframe, making it easier to analyze confluences between different time horizons.
Intuitive Visual Design
All graphical elements are carefully designed with contrasting colors and optimized sizes to ensure readability in any chart configuration.
Objects are dynamically updated as price evolves, maintaining the relevance of displayed information.
Trader Benefits
✔ Quick Analysis – The use of colors and visual panels reduces the time required to interpret the market, enabling faster decision-making.
✔ Flexibility – Integrated multi-timeframe analysis provides a holistic view, useful for short-, medium-, and long-term strategies.
✔ Customization – Designed to adapt to the active chart's symbol and period, ensuring consistency across different assets (forex, stocks, commodities, etc.).
✔ Interactivity – The click functionality on the trend panel simplifies timeframe navigation, optimizing the trader’s workflow.
Additional Notes
📌 Compatibility: Works on any MT5-supported timeframe and symbol.
📌 Automatic Cleanup: When the indicator is removed from the chart, all graphical objects are automatically deleted to avoid clutter.
📌 Version: 1.14 – The author suggests that the indicator is under continuous development, with potential for future updates.
Purpose
The "Setup Bivit" was created to be a complete technical analysis tool, offering a unique combination of simplicity and depth. It does not execute trades automatically but provides traders with a solid visual foundation for making informed decisions, aligning with the trading style based on the "Setup Bivit" developed by Mario Negreiro.