Trend Screener
- Indicateurs
- STE S.S.COMPANY
- Version: 21.10
- Mise à jour: 3 juin 2024
- Activations: 10
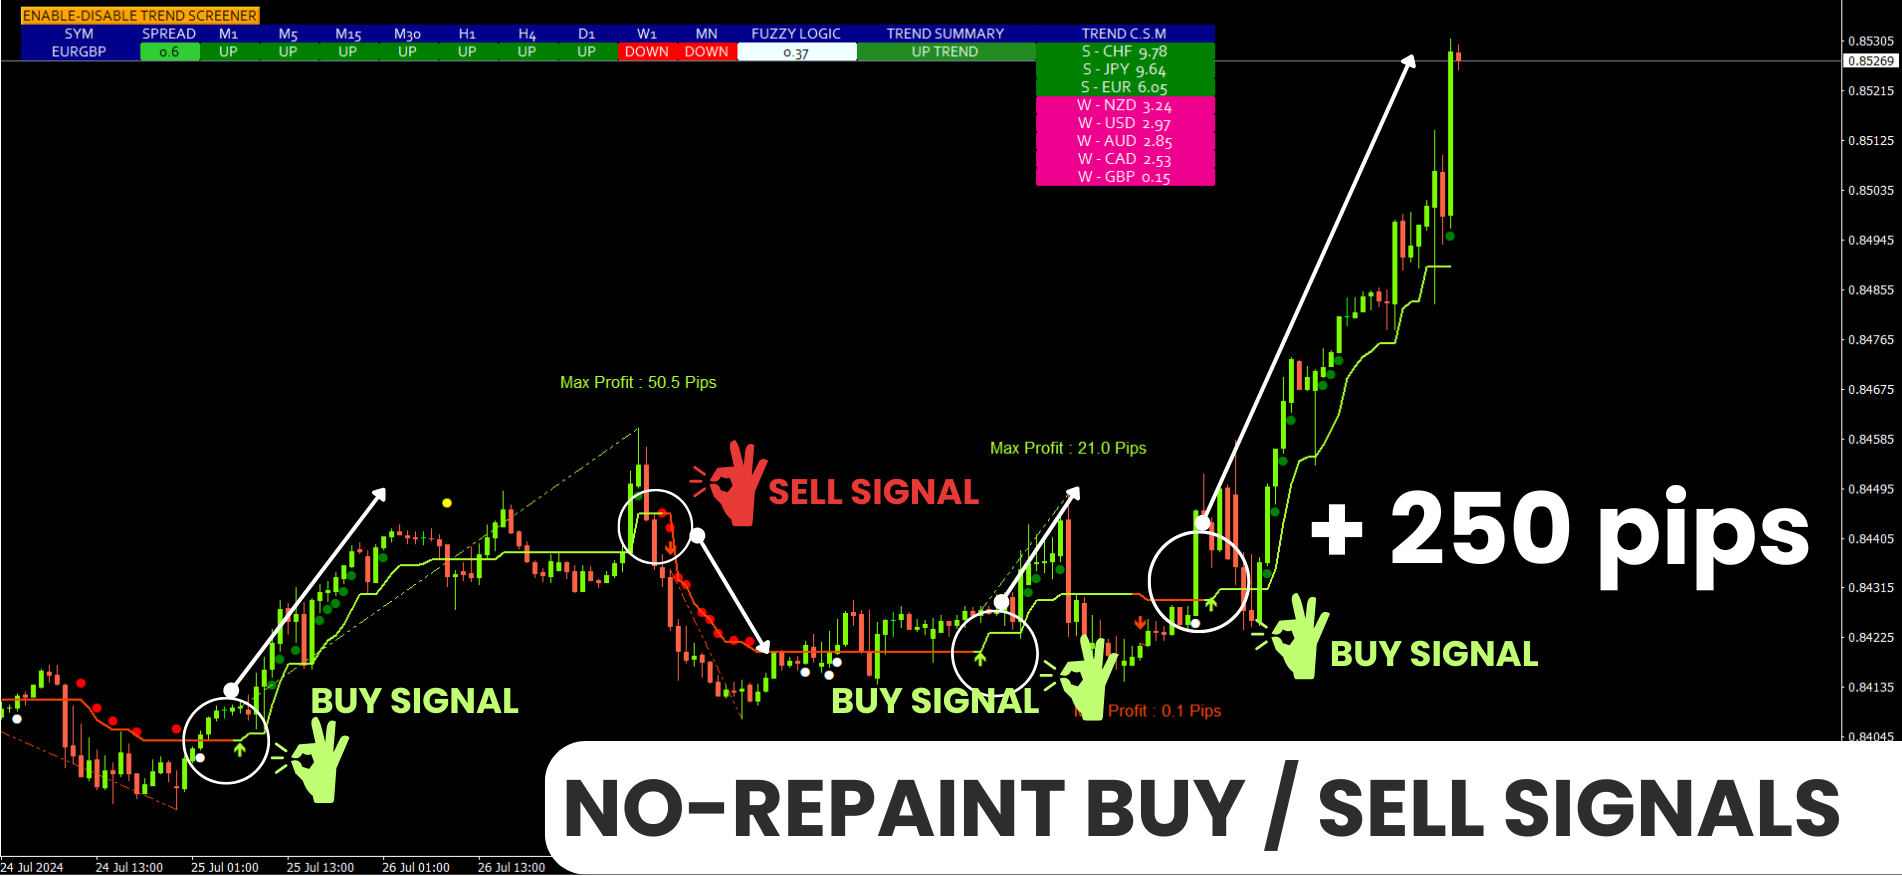
Indicateur de tendance, solution unique révolutionnaire pour le trading et le filtrage des tendances avec toutes les fonctionnalités de tendance importantes intégrées dans un seul outil ! Il s'agit d'un indicateur multi-période et multi-devises 100 % non repeint qui peut être utilisé sur tous les symboles/instruments : forex, matières premières, crypto-monnaies, indices et actions.
OFFRE À DURÉE LIMITÉE : L'indicateur Support and Resistance Screener est disponible pour seulement 50 $ et à vie. (Prix d'origine 250 $) (offre prolongée)
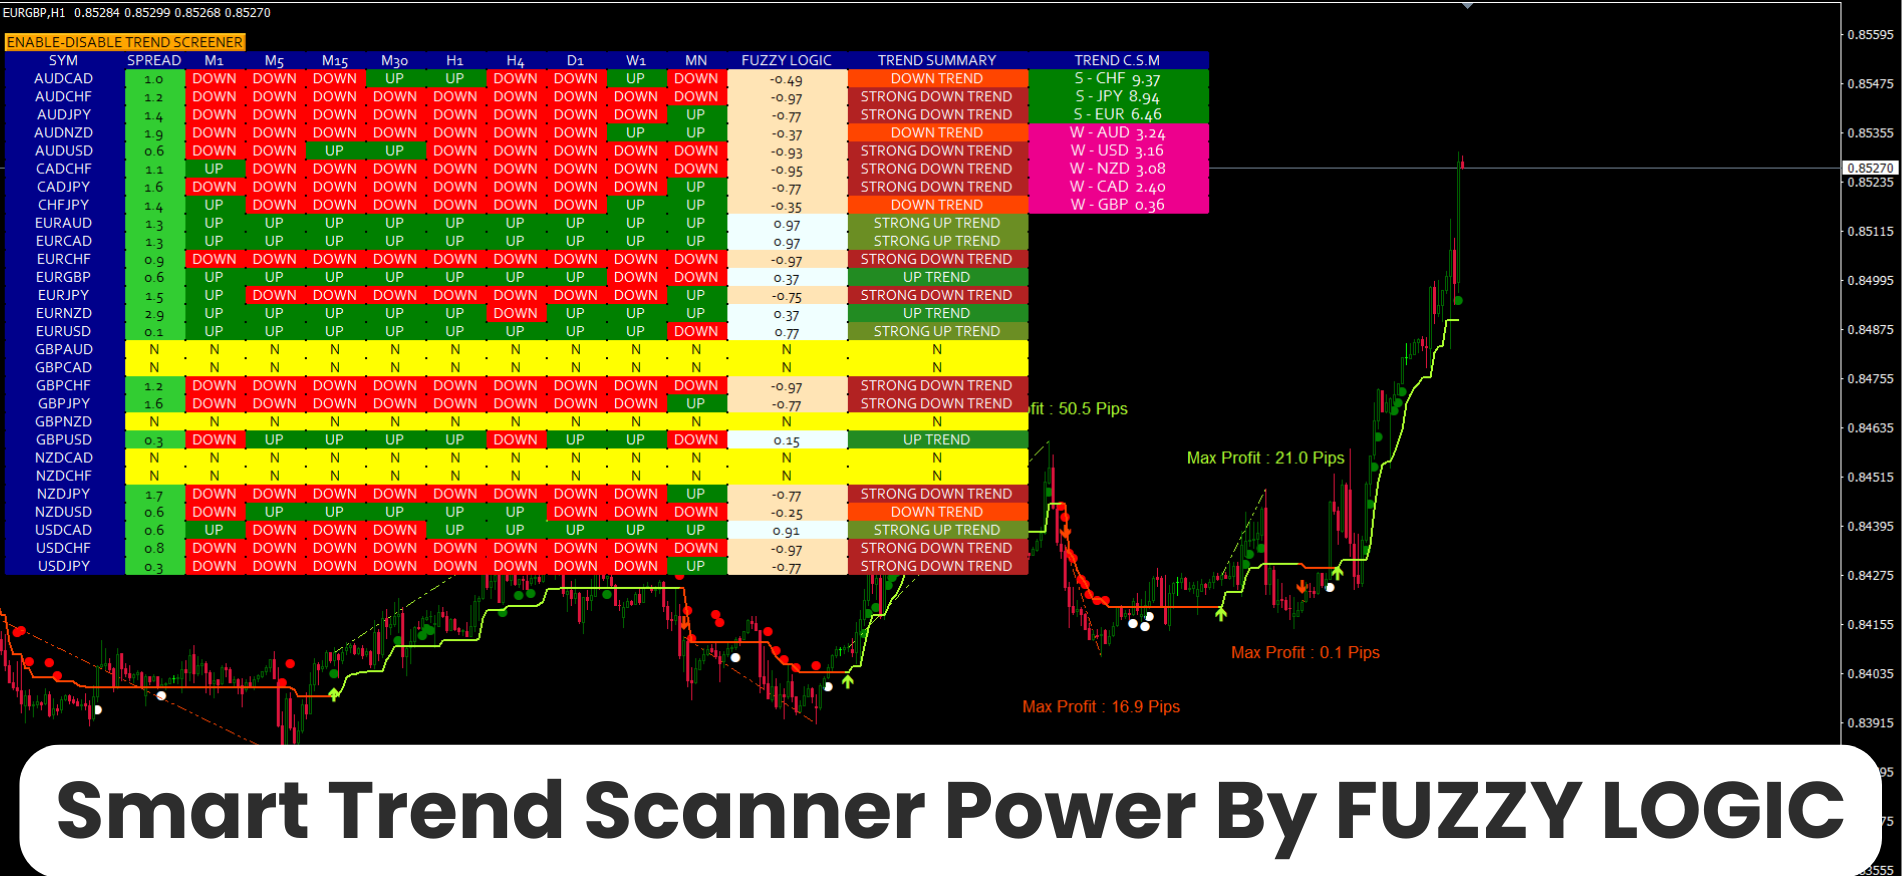
Trend Screener est un indicateur de suivi de tendance efficace qui fournit des signaux de tendance fléchés avec des points dans le graphique. Les fonctionnalités disponibles dans l'indicateur Analyseur de tendance :
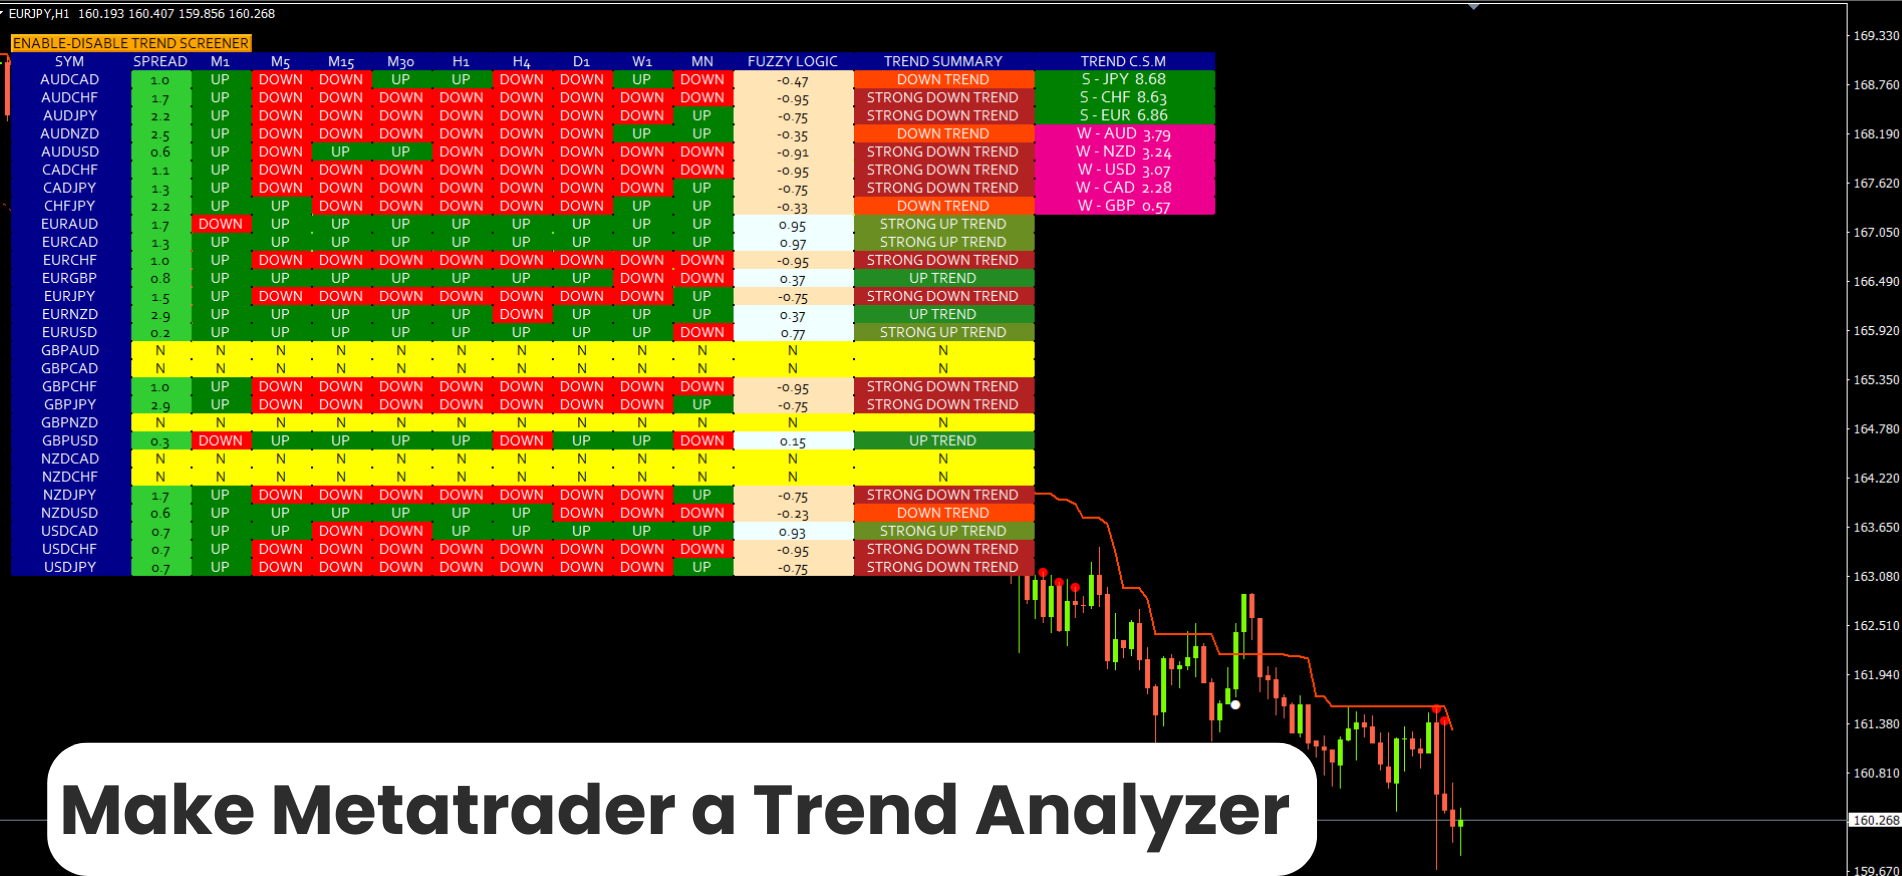
1. Analyseur de tendance.
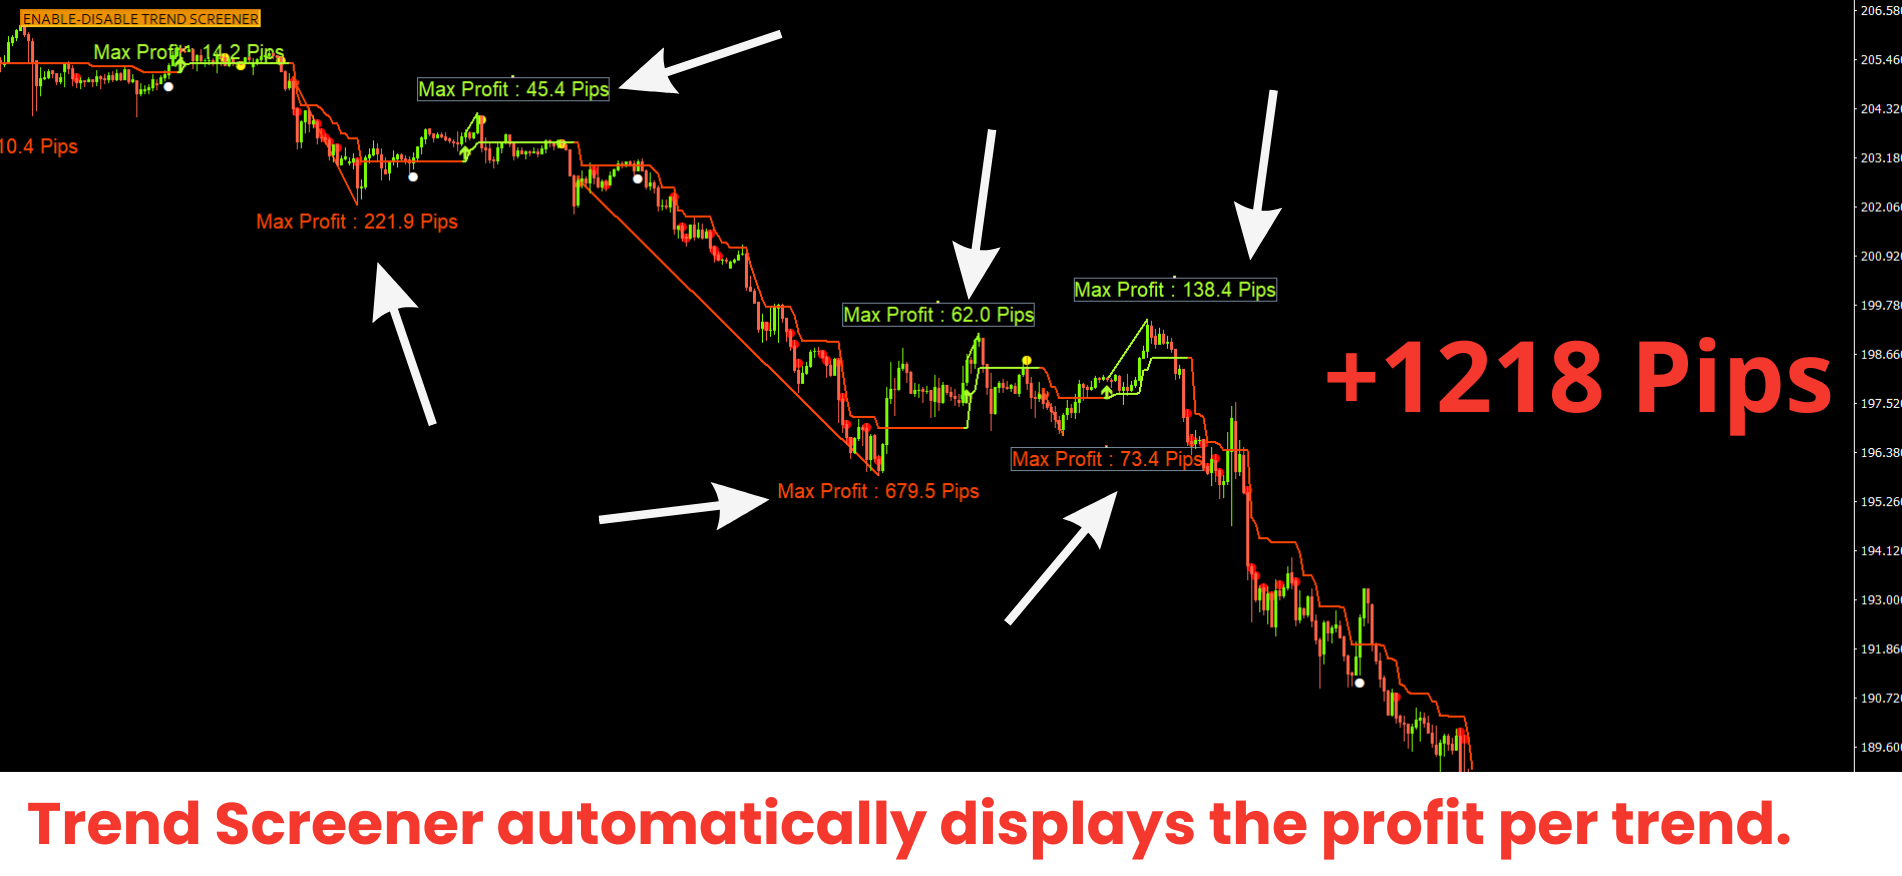
2. Ligne de tendance avec analyse du profit maximum.
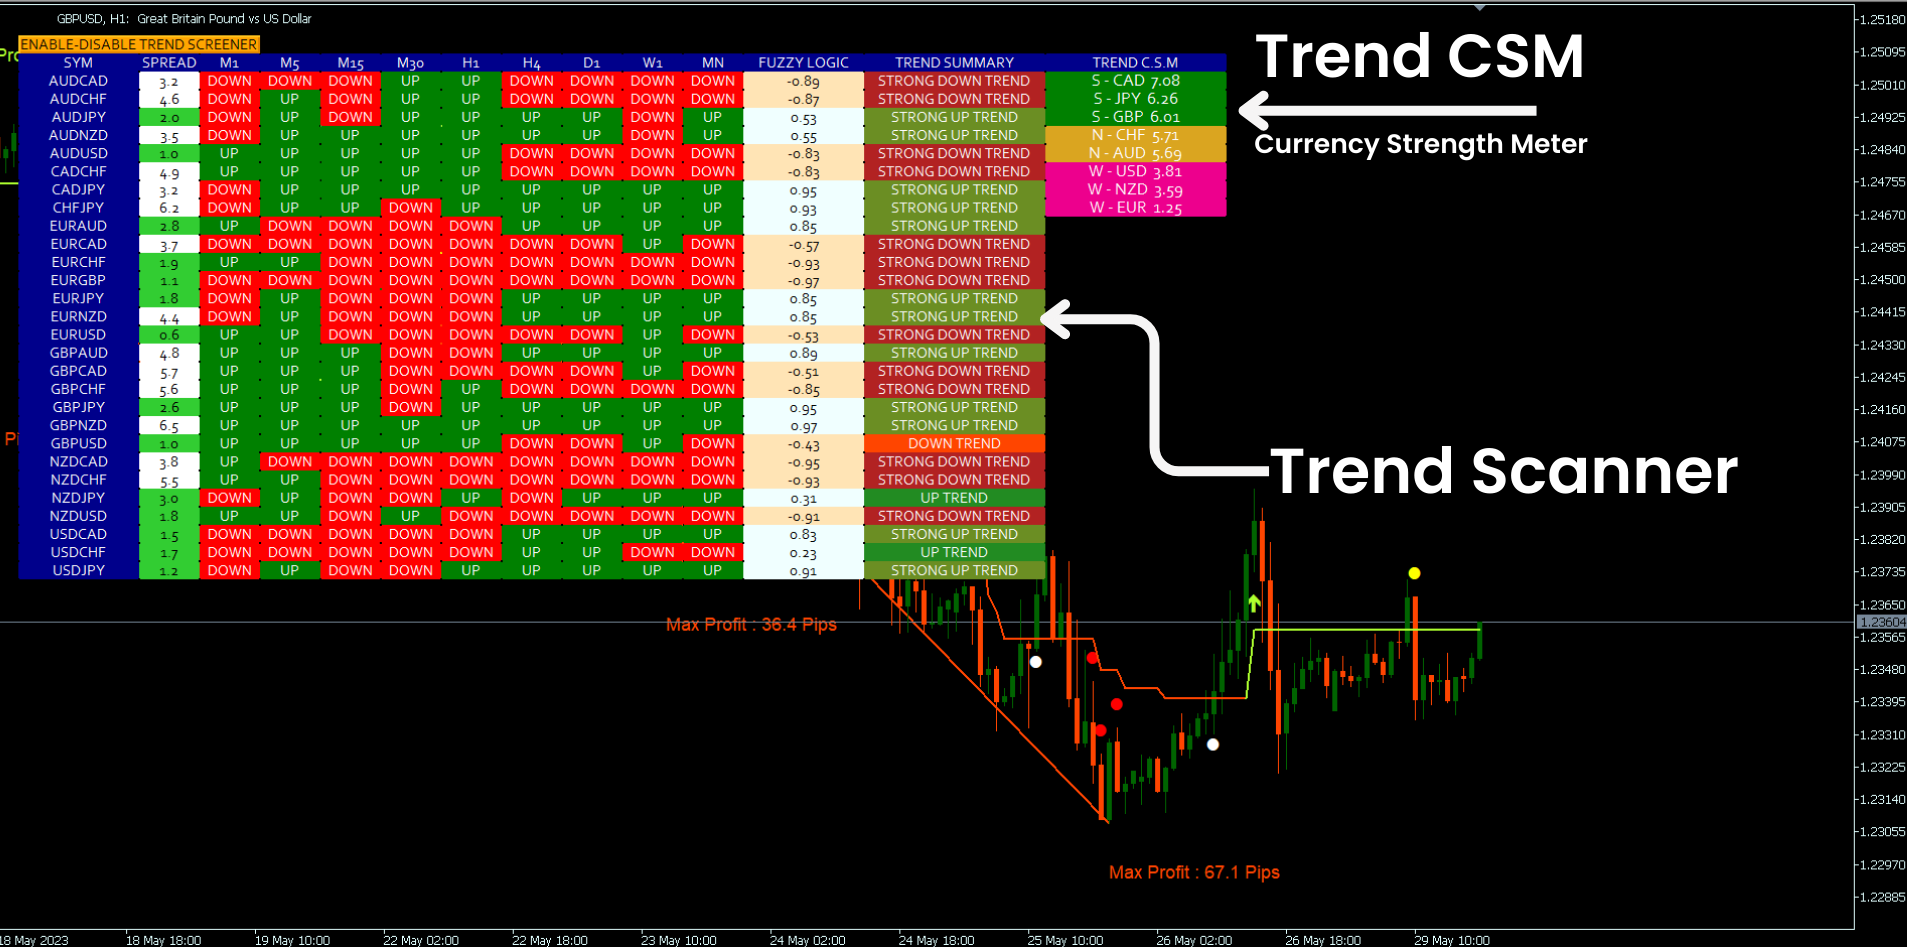
3. Compteur de force de devise de tendance.
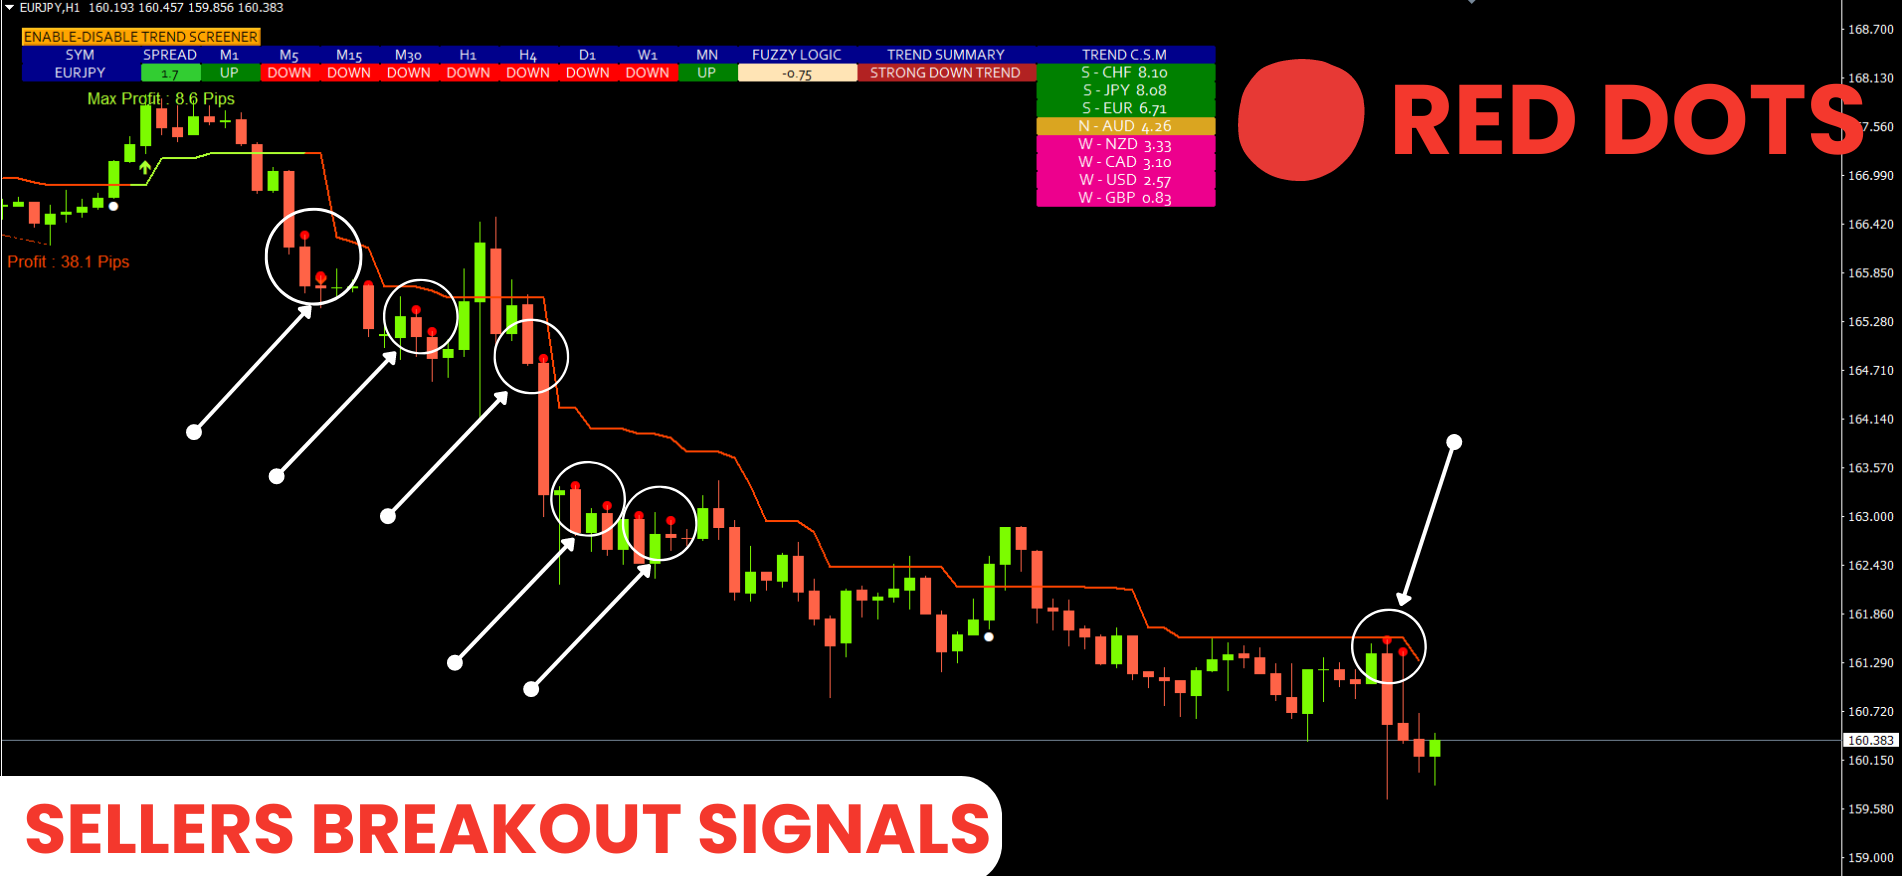
4. Points d'inversion de tendance avec alertes.
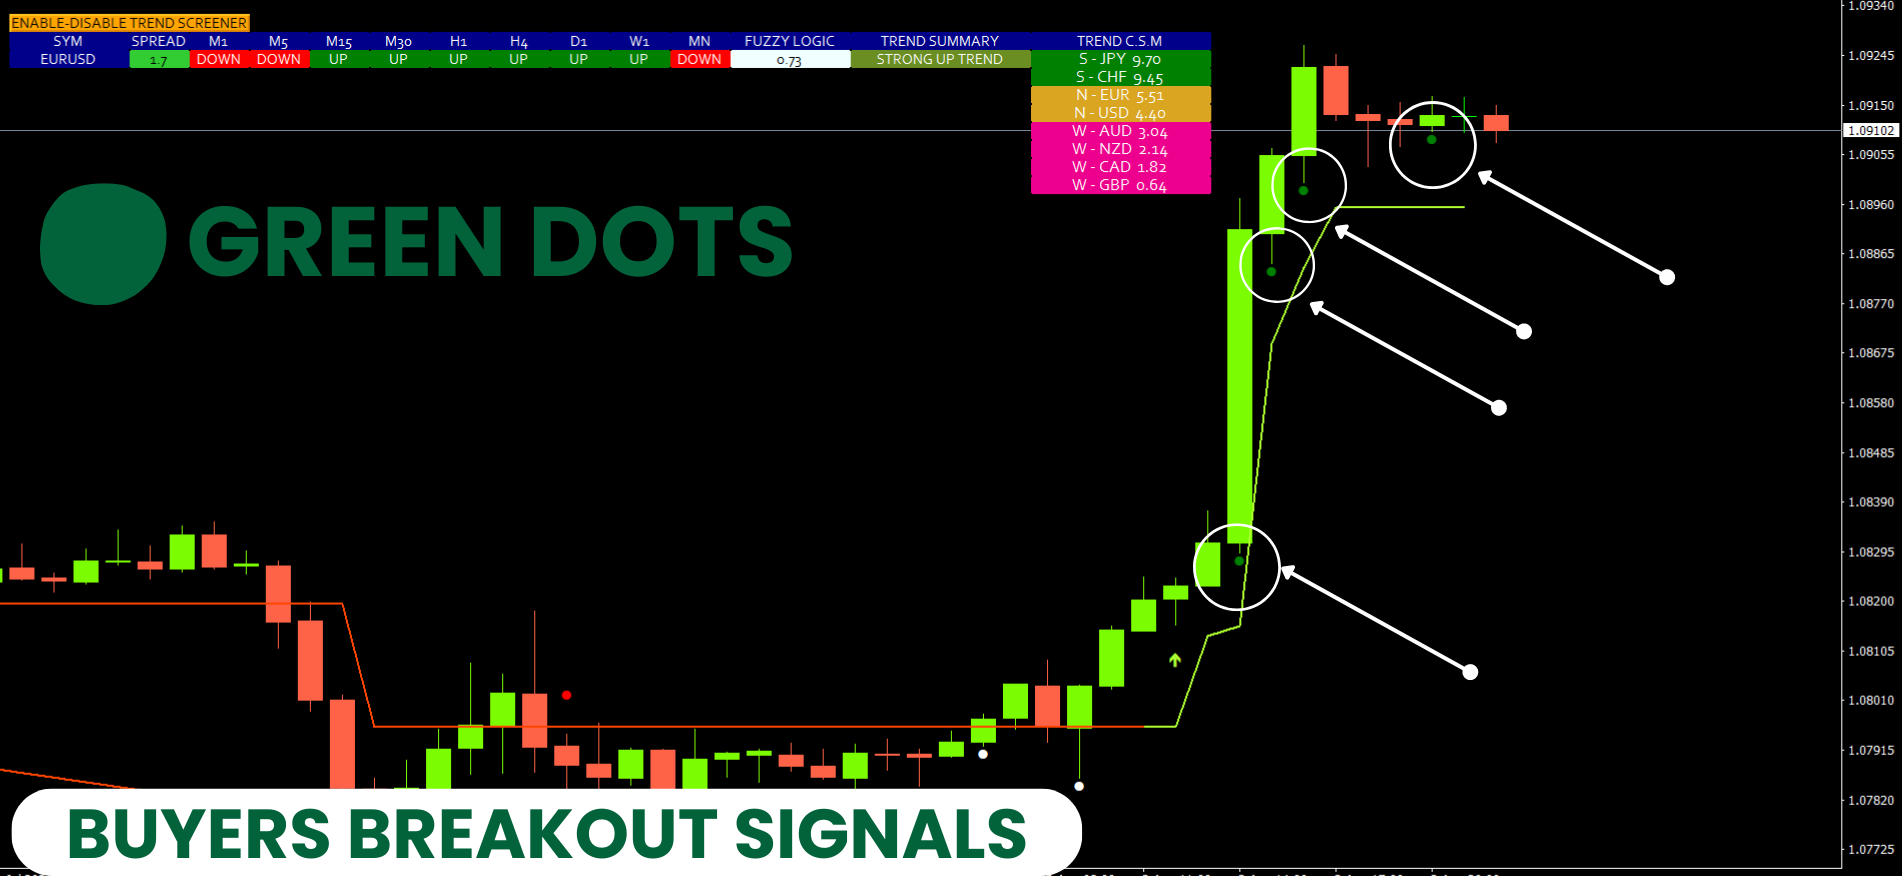
5. Points de tendance forts avec alertes.
6. Flèches de tendance
Des exemples d'analyses quotidiennes, des performances quotidiennes du signal, etc. avec notre indicateur de dépistage des tendances, peuvent être trouvés ici : Cliquez ici
En accédant à notre Blog MQL5, vous pouvez retrouver tous nos indicateurs premium avec des exemples d'analyse, Daily Signal Performance...etc. : Cliquez ici
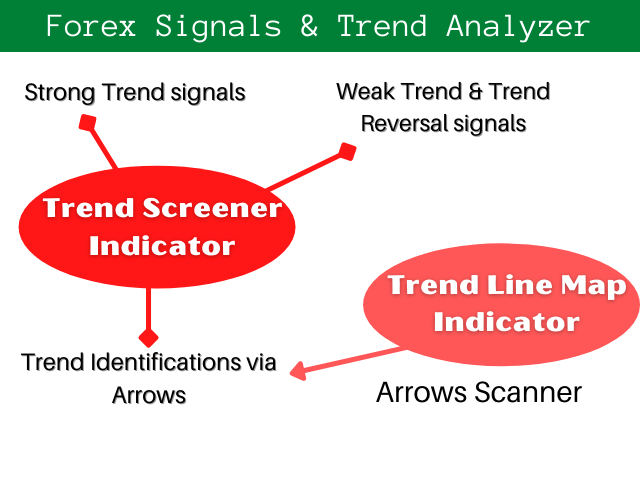
Notre système de Tendance composé de 2 Indicateurs :
1. Indicateur de filtre de tendance : affichez le tableau de bord de tendance, la ligne de tendance dans le graphique, les points d'entrée... etc.
2. Indicateur de carte de ligne de tendance : affichez les achats et les ventes sous forme de tableau de bord, les signaux actifs profit/perte... etc.
Télécharger l'indicateur de carte de ligne de tendance
Tutoriels vidéos Youtube :
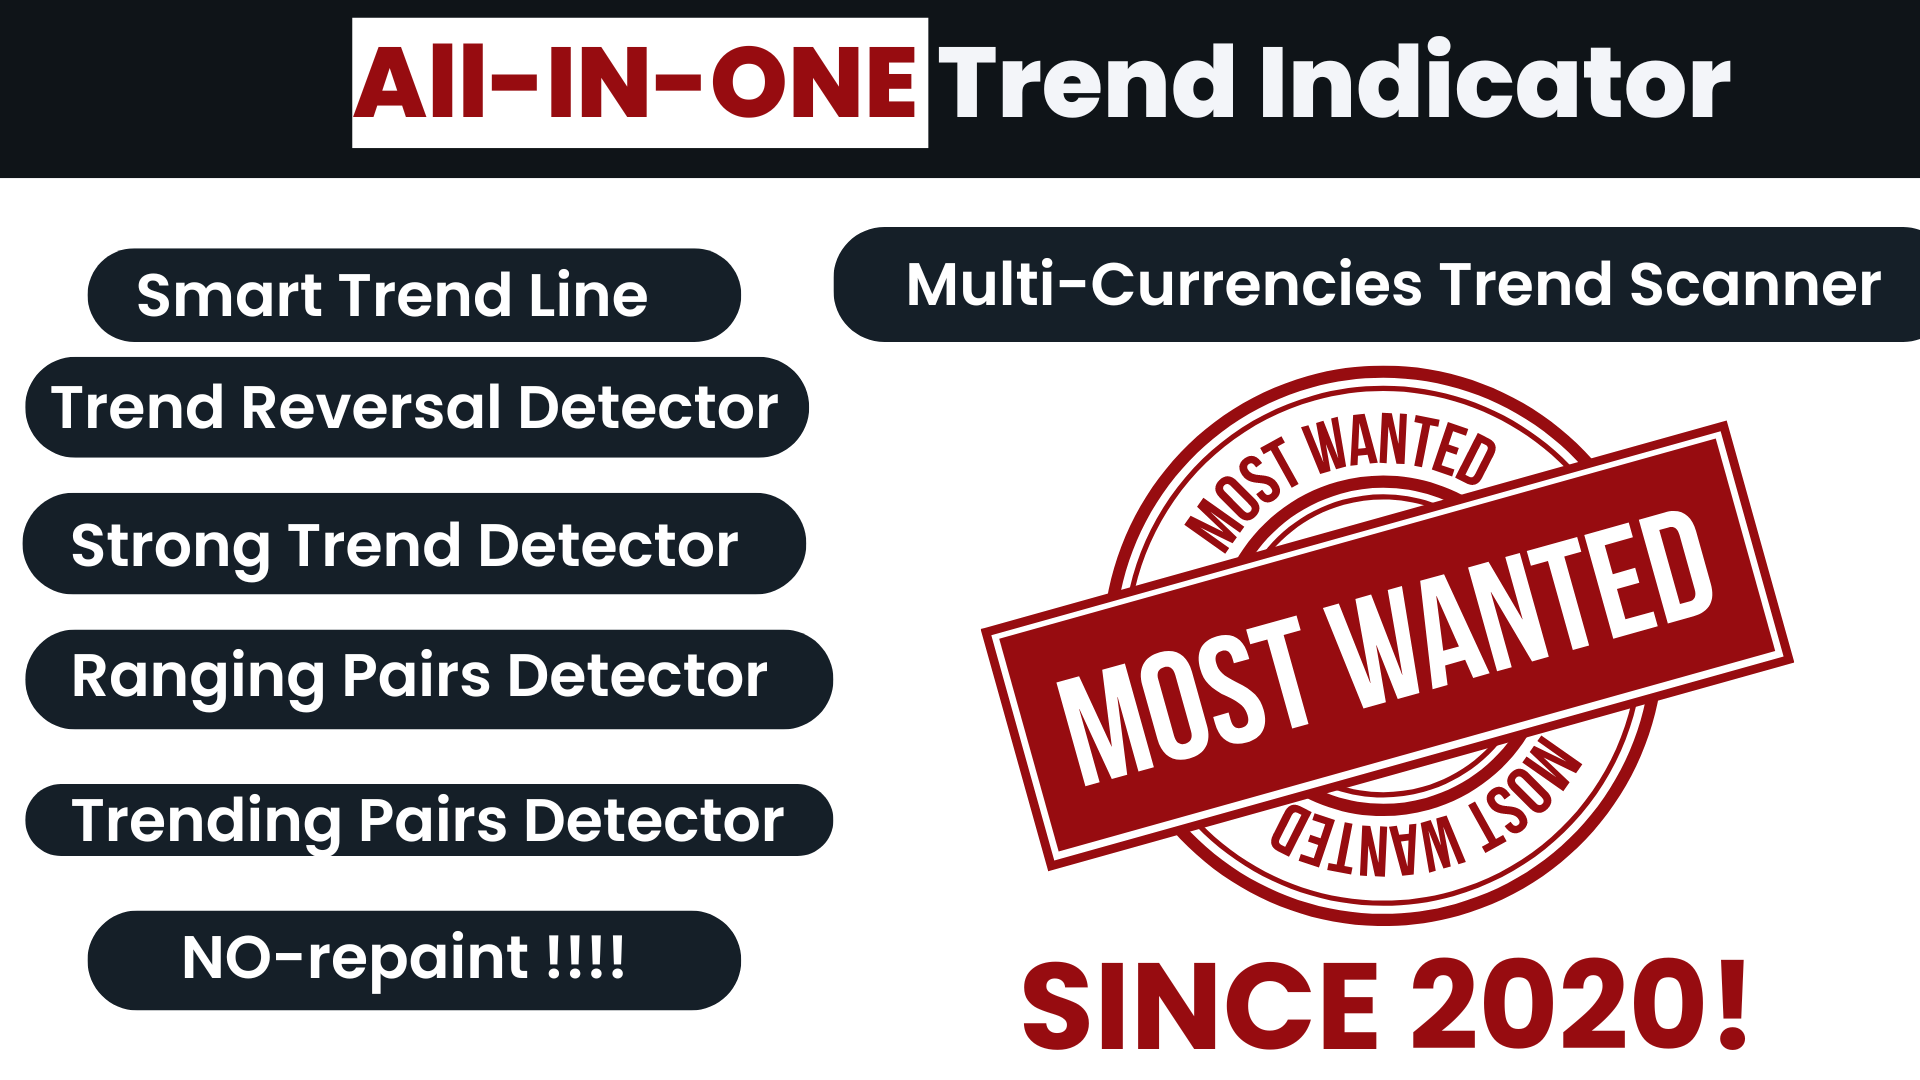
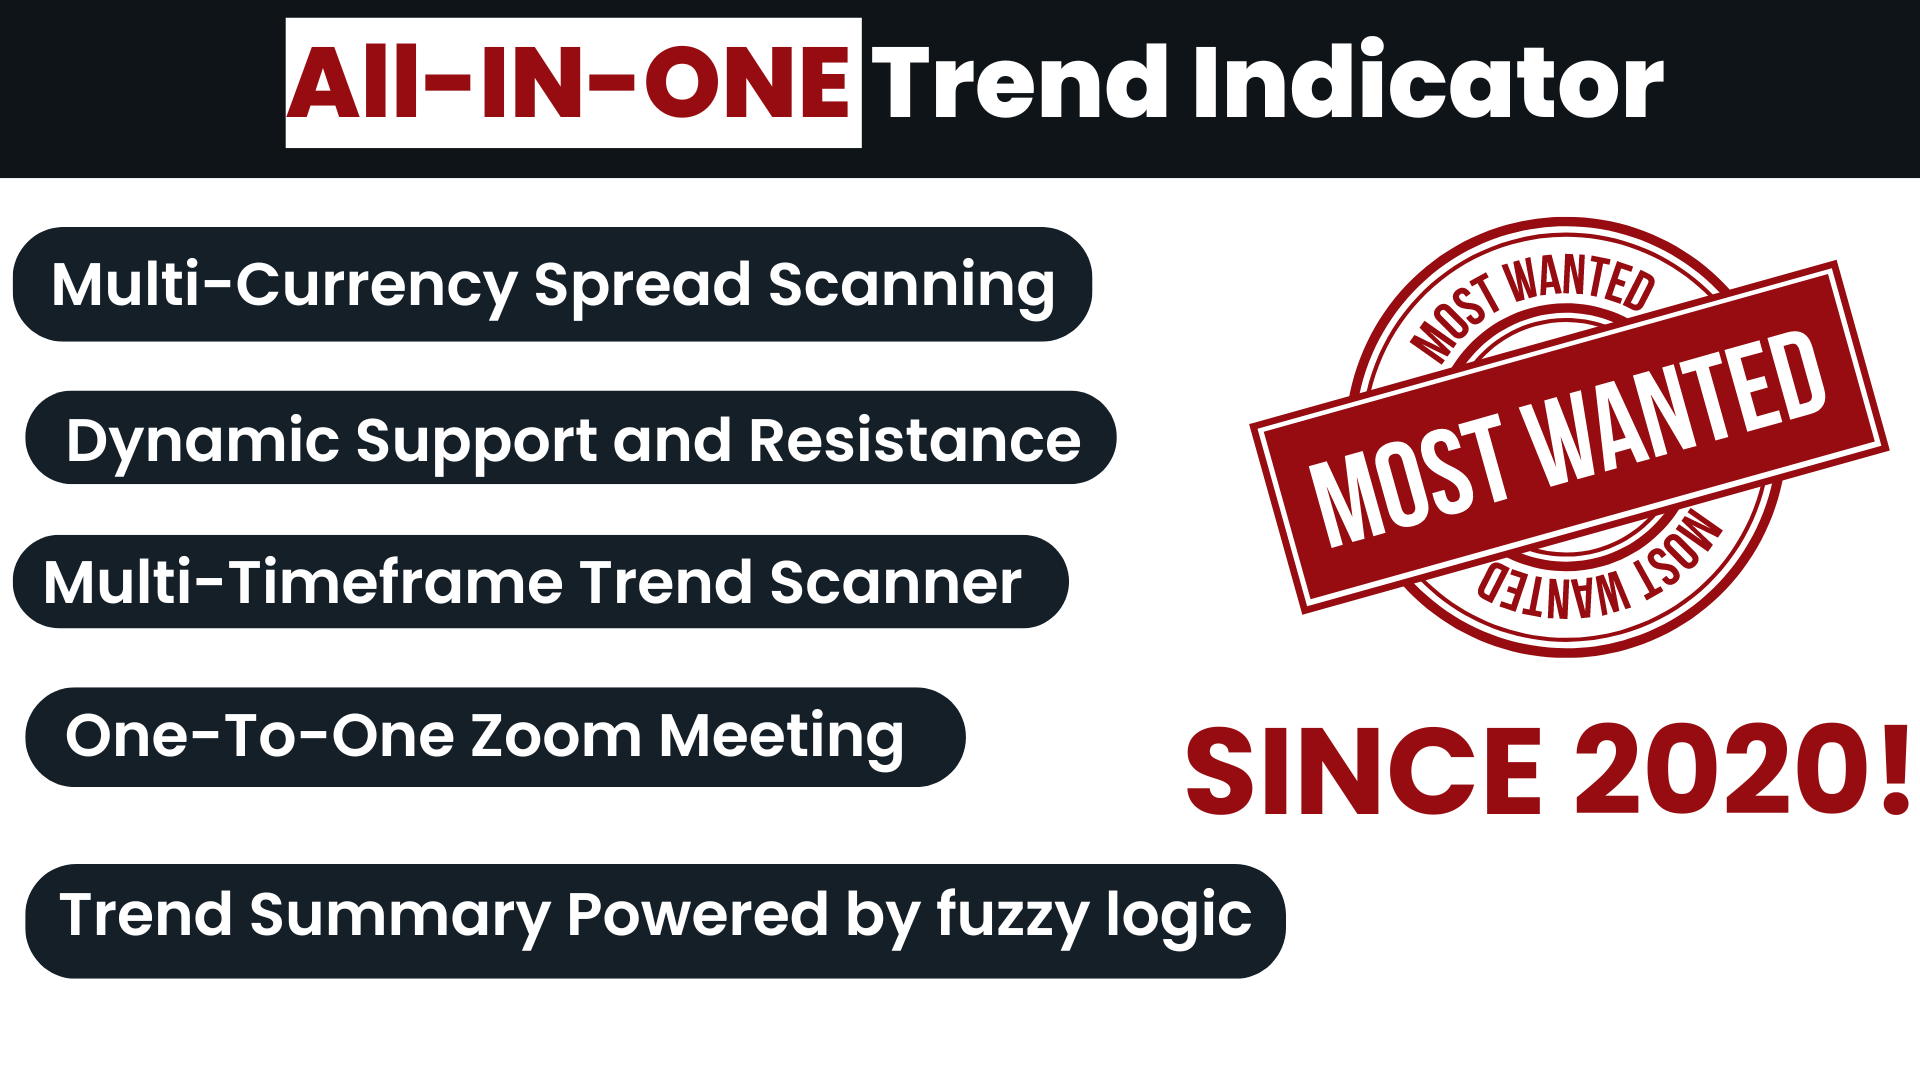
Principales caractéristiques
- Analyseur de force de tendance.
- Analyseur de tendances multi-périodes et multi-devises.
- Tableau de bord des tendances
- Signaux d'inversion de tendance. (signaux de points)
- Signaux de tendance forts. (signaux de points)
- Ligne de tendance
Documentations ( Instructions )
Toutes les documentations de Trend Screener ( Instructions ) et les détails de la stratégie sont disponibles dans cet article de notre Blog MQL5 : Cliquez ici.
Contact
Si vous avez des questions ou si vous avez besoin d'aide, contactez-moi par Message Privé.
Auteur
SAYADI ACHREF , ingénieur logiciel fintech et fondateur de Finansya. 


This is an amazing indicator. ive used it for 2 weeks on a demo on Gold and the results have been amazing. it took a couple days to get the setting right. but since then its been the best, will try on a demo for another 2 weeks. having a small issue with notification not coming to my phone all the time but thats not a big deal for me..