• Aperçu
  • Avis (23)
  • Commentaires (87)
  • Nouveautés

Supply and Demand Dashboard PRO

4.82
Actuellement 20% de réduction !

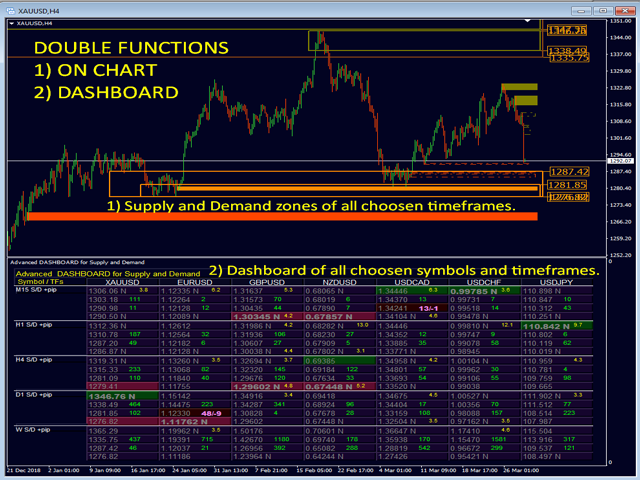
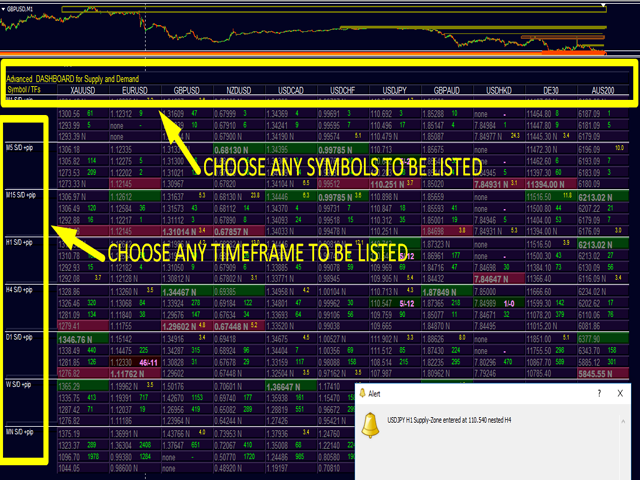
Ce tableau de bord est un logiciel très puissant qui fonctionne sur plusieurs symboles et jusqu'à 9 horizons temporels.
Il est basé sur notre indicateur principal (Best reviews : Advanced Supply Demand).  

Le tableau de bord donne une excellente vue d'ensemble. Il montre : 
  1. Les valeurs d'offre et de demande filtrées, y compris l'évaluation de la force de la zone,
  2. Les distances en pips vers/et dans les zones,
  3. Il met en évidence les zones imbriquées,
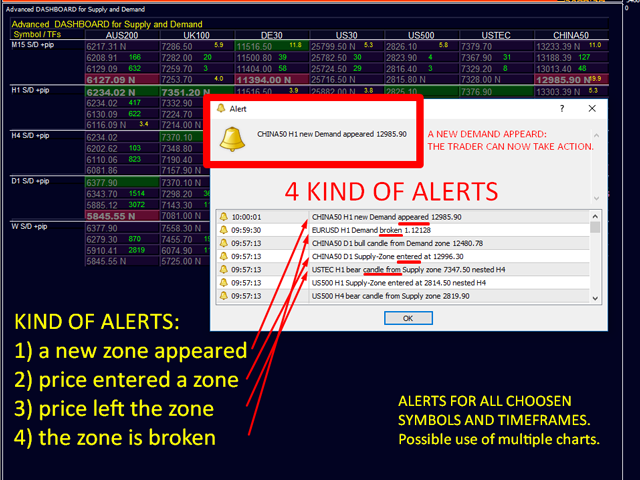
  4. Il donne 4 types d'alertes pour les symboles choisis dans toutes les (9) périodes de temps.
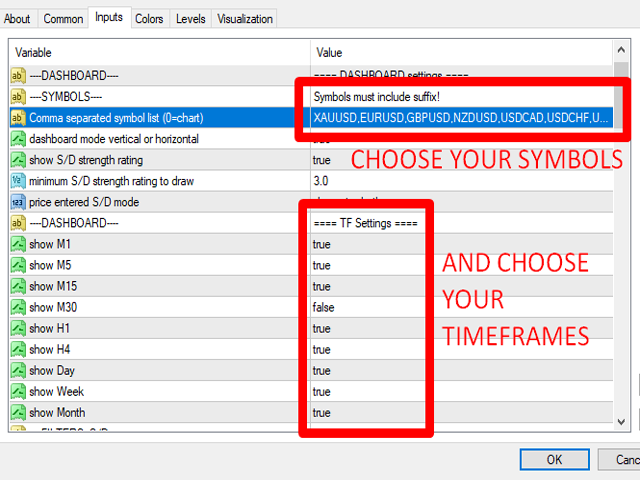
  5. Il est hautement configurable pour vos besoins personnels !

Vos avantages !

Les questions les plus importantes pour chaque trader :

Quels sont les meilleurs niveaux pour entrer sur le marché ?
Entrez votre transaction à l'intérieur ou à proximité d'une zone d'offre et de demande forte pour avoir les meilleures chances de succès et de risque/récompense.

Quel est le meilleur endroit pour mon stop loss ?
Placez votre stop en dessous ou au-dessus d'une zone d'offre et de demande forte pour être le plus sûr.

Quel est mon meilleur objectif de profit ?
Votre stratégie de sortie est tout aussi importante que votre entrée et le fait de connaître le cadre temporel supérieur peut vous y aider. Pour un achat, utilisez la prochaine zone d'offre comme cible, pour une vente, utilisez les prochaines zones de demande comme cible. Entrer sur un repli de l'offre ou de la demande pour s'assurer qu'il y a suffisamment de place pour une marge de profit jusqu'à l'offre et la demande du cadre temporel supérieur augmentera vos profits.

Pourquoi filtrons-nous les zones fortes et faibles ?
Plus le déséquilibre est grand, plus le mouvement du prix est important. Les niveaux de prix les plus probables sont ceux qui présentent le plus grand déséquilibre entre acheteurs et vendeurs. Sans aucun avertissement préalable, il s'inverse sur le champ et tombe comme une pierre - ce sont les zones de déséquilibre majeur. Un grand nombre de vendeurs sont entrés sur le marché à ce prix et ont surpassé en nombre les acheteurs. Il est également très probable que, en cas de vente soudaine, d'autres vendeurs attendaient de vendre juste autour de ce niveau. 


Informations importantes révélées :


Maximiser le potentiel de l'offre et de la demande, veuillez consulter le manuel de l'utilisateur

Si vous êtes novice en matière de trading, lisez également ce blog

Les fonctions avancées sont 4 alertes spéciales : 
  • Une nouvelle zone est apparue.
  • Le prix est entré dans une zone.
  • Le prix a quitté la zone.
  • La zone est cassée.
  • Filtrer les alertes pour les zones imbriquées.


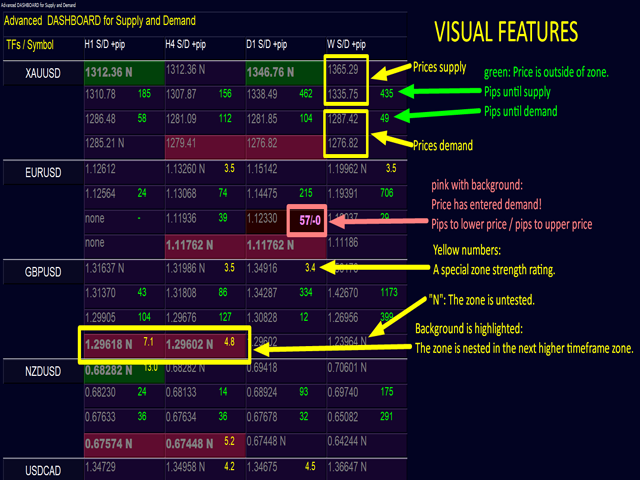
Caractéristiques visuelles :
Prix de l'offre et de la demande. (De haut en bas : prix supérieur de l'offre / prix inférieur de l'offre / prix supérieur de la demande / prix inférieur de la demande).
Distances en pips jusqu'à l'offre et la demande. Vert, si le prix est loin de la zone.
Distances en pips à l'intérieur de l'offre et de la demande. Rose et gras, si le prix est entré dans la zone. (pips vers le prix extérieur / pips vers le prix intérieur)
Une évaluation spéciale de la force de la zone. Numéro jaune, si une force minimale est atteinte.
Nouveau ou testé : "N" est ajouté au prix si la zone est encore non testée ou nouvelle.
Emboîtée : le fond est mis en évidence si la zone est emboîtée dans la zone de temps supérieure.
Nested AND new : les prix de l'offre et de la demande apparaissent en gras.


Caractéristiques visuelles sur le graphique :

Cliquez sur le nom des symboles pour en changer.
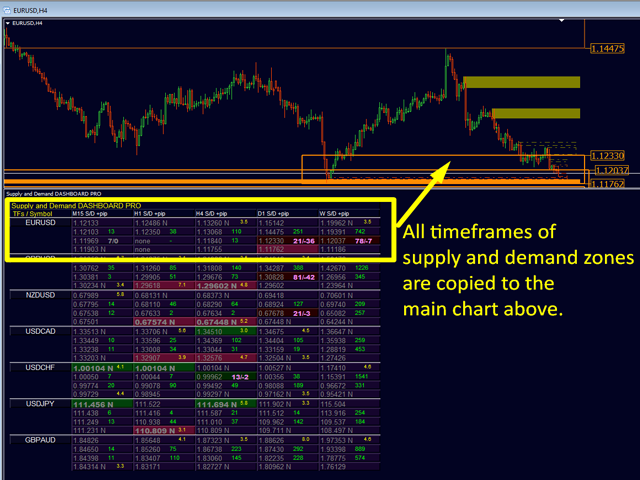
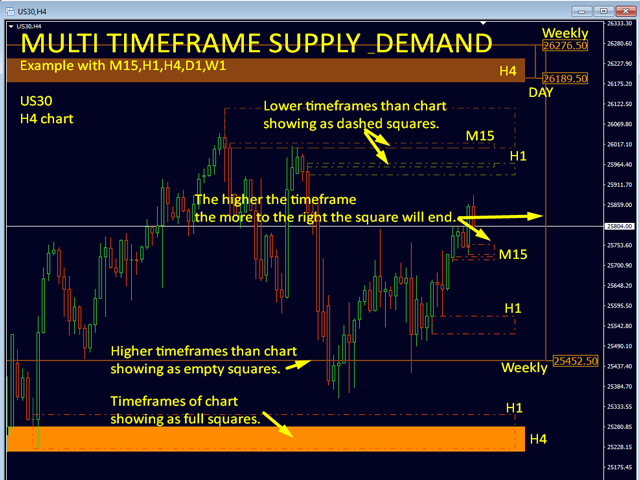
Tous les horizons temporels affichés dans le tableau de bord seront dessinés sur le graphique.
Les horizons temporels inférieurs au graphique sont représentés par des carrés en pointillés.
L'horizon temporel actuel du graphique est représenté par des carrés pleins.
Les horizons temporels supérieurs au graphique sont représentés par des carrés vides.
et plus ...

La liste complète est disponible dans le manuel de l'utilisateur


Pour que la démo fonctionne dans le testeur de stratégie, il faut une configuration spéciale. Envoyez-moi un message privé. 

Une fois que vous avez reçu le(s) indicateur(s), demandez l'email du STARTER-PACK avec plus d'informations, des liens, des modèles, et plus. Je veux m'assurer de votre succès !


Traduit automatiquement ! Original anglais cliquez ici


Avis 20
MarcoEA
133
MarcoEA 2023.06.09 22:50 
 

hello, I bought two of your indicators. Sup and Dem and Dashboard of Sup and Demand. What are the bonuses?

Gabor Bocsak
1858
Gabor Bocsak 2023.05.23 18:42 
 

I really like the indicators! Actually i use 4 of them and they work really well together! I had a lot of questions as i use a bit different strategy.but i got all the help! Thank you!

Tyrena Booker
96
Tyrena Booker 2023.02.01 19:59 
 

The indicator is phenomenal!!! This indicator help me to know when pullbacks are happening.I enjoy the enhance features of this indicator because you can add any symbols see the whole market within seconds. I use this indicator with Currency Strength Exotics on the chart and let just say you will be counting PIPS. Bernhard will help with your question and answer each one in punctual time. I highly recommend this indicator to anyone. I appreciated your help Bernhard!!!

Produits recommandés
Binary Options Support Resistance Indicator This indicator is designed for binary options trading and effectively shows retracements from support and resistance levels. Signals appear on the current candle. A red arrow pointing downwards indicates a potential selling opportunity, while a blue arrow pointing upwards suggests buying opportunities. All that needs adjustment is the color of the signal arrows. It is recommended to use it on the M1-M5 timeframes as signals are frequent on these timef
Credible Cross System   indicator is designed for signal trading. This indicator generates trend signals. It uses many algorithms and indicators to generate this signal. It tries to generate a signal from the points with the highest trend potential. The indicator works based on instant price movements. This indicator is a complete trading product. This indicator does not need any additional indicators. The indicator certainly does not repaint. The point at which the signal is given does not
This   Rattling Signal Point   indicator is designed for signal trading. This indicator generates trend signals. It uses many algorithms and indicators to generate this signal. It tries to generate signals from the points with the highest trend potential. This indicator is a complete trading product. This indicator does not need any additional indicators. The indicator is never repainted. The point at which the signal is given does not change. When the signal comes the arrows are put back
Real Magic Trend
Muhammed Emin Ugur
This   Real Magic Trend   indicator is designed for signal trading. This indicator generates trend signals. It uses many algorithms and indicators to generate this signal. It tries to generate signals from the points with the highest trend potential. This indicator is a complete trading product. This indicator does not need any additional indicators. The indicator is never repainted. The point at which the signal is given does not change.      Features and Recommendations Time Frame
SuperTrend Alerts
Libertas LLC
3 (4)
SuperTrend Alerts adds alerts to the widely popular SuperTrend indicator. As the name suggests, SuperTrend is a trending indicator which works best in trendy (not choppy) markets. SuperTrend is extremely popular for intraday and daily trading, and can be used on any timeframe. Place a call when the price closes above the SuperTrend line, and place a put when the price closes below the SuperTrend line. These crossovers are highlighted by non-repainting up/down arrows. Alerts Email, message and
Real Pro Signal
Muhammed Emin Ugur
Real Pro Signal   indicator is designed for signal trading. This indicator generates trend signals. It uses many algorithms and indicators to generate this signal. It tries to generate a signal from the points with the highest trend potential. This indicator is a complete trading product. This indicator does not need any additional indicators. The indicator certainly does not repaint. The point at which the signal is given does not change.     Features and Suggestions Time Frame: H1 W
Signal Tower   indicator is designed for signal trading. This indicator generates trend signals. It uses many algorithms and indicators to generate this signal. It tries to generate a signal from the points with the highest trend potential. This indicator is a complete trading product. This indicator does not need any additional indicators. The indicator certainly does not repaint. The point at which the signal is given does not change. The indicator has a pips counter. You can see how
Pro Magic Signal   indicator is designed for signal trading. This indicator generates trend signals.  It uses many algorithms and indicators to generate this signal. It tries to generate a signal from the points with the highest trend potential. This indicator is a complete trading product. This indicator does not need any additional indicators.  The indicator certainly does not repaint. The point at which the signal is given does not change.  Thanks to the alert features you can get the signals
Great Strong System   indicator is designed for signal trading. This indicator generates trend signals. It uses many algorithms and indicators to generate this signal. It tries to generate a signal from the points with the highest trend potential. This indicator is a complete trading product. This indicator does not need any additional indicators. The indicator certainly does not repaint. The point at which the signal is given does not change.     Features and Suggestions Time Frame:
The   True Magic Oscillator   indicator is designed for signal trading. This indicator generates trend signals. It uses many algorithms and indicators to generate this signal. It tries to generate signals from the points with the highest trend potential. This indicator is a complete trading product. This indicator does not need any additional indicators. The indicator is never repainted. The point at which the signal is given does not change.         Features and Recommendations Wor
The new update makes this indicator a complete tool for studying, analyzing and operating probabilistic patterns. It includes: On-chart Multi-asset percentage monitor. Configurable martingales. Twenty-one pre-configured patterns , including Mhi patterns and C3. An advanced pattern editor to store up to 5 custom patterns. Backtest mode to test results with loss reports. Trend filter. Hit operational filter. Martingale Cycles option. Various types of strategies and alerts. Confluence between patte
Gvs Undefeated Trend   indicator is designed for trend and signal trading. This indicator generates trend signals.  It uses many algorithms and indicators to generate this signal. It tries to generate a signal from the points with the highest trend potential. This indicator is a complete trading product. This indicator does not need any additional indicators.  You can only trade with this indicator. The generated signals are displayed on the graphical screen.  Thanks to the alert features you ca
Signal Undefeated   indicator is designed for trend and signal trading. This indicator generates trend signals.  It uses many algorithms and indicators to generate this signal. It tries to generate a signal from the points with the highest trend potential. This indicator is a complete trading product. This indicator does not need any additional indicators.  You can only trade with this indicator. The generated signals are displayed on the graphical screen.  Thanks to the alert features you can g
Shark Trading
Yaroslav Varankin
The indicator is designed to trade binary options on small time frames up to m 30 Signals The blue up arrow is a buy signal. The red dn arrow is a sell signal. The signal will appear together with the advent of a new candle  and during formation Signals on the current candle Expiration time one candle from the timeframe on which you are trading You can use moving average to filter out false signals. Or escort support levels. This tool is reliable in trading.
Two Candles to Glory
Ellan Dirgantara Tholkhah
This is a Binary Options signal indicator. Extremely powerful for the 1 min chart. The signals are based on my personal tweak (based on real trial and error & backtested) of the RSI, ADX and Ichimoku and my observation on how price moves. It turns out, 2 candles expiry is the most consistent with this set up. How to use: 1. Wait for arrow signal to show. 2. Place a 2 candle expiry right after the close of the signal candle. So if you are trading a 1 min chart, place an expiry for 2 mins... if yo
Happy Trend Arrow
Muhammed Emin Ugur
This   Happy Trend Arrow   indicator is designed for signal trading. This indicator generates trend signals. It uses many algorithms and indicators to generate this signal. It tries to generate signals from the points with the highest trend potential. This indicator is a complete trading product. This indicator does not need any additional indicators. The indicator is never repainted. The point at which the signal is given does not change.       Features and Recommendations Time Fra
Entry Signal Arrows   indicator is designed for signal trading. This indicator generates trend signals.  It uses many algorithms and indicators to generate this signal. It tries to generate a signal from the points with the highest trend potential. This indicator is a complete trading product. This indicator does not need any additional indicators.  The indicator certainly does not repaint. The point at which the signal is given does not change.  Thanks to the alert features you can get the sign
Advanced Stochastic Scalper - is a professional indicator based on the popular Stochastic Oscillator. Advanced Stochastic Scalper is an oscillator with dynamic overbought and oversold levels, while in the standard Stochastic Oscillator, these levels are static and do not change. This allows Advanced Stochastic Scalper to adapt to the ever-changing market. When a buy or a sell signal appears, an arrow is drawn on the chart and an alert is triggered allowing you to open a position in a timely mann
Big Trend Signal   indicator is designed for trend and signal trading. This indicator generates trend signals.  It uses many algorithms and indicators to generate this signal. It tries to generate a signal from the points with the highest trend potential. This indicator is a complete trading product. This indicator does not need any additional indicators.  You can only trade with this indicator. The generated signals are displayed on the graphical screen.  Thanks to the alert features you can ge
Night ghost
Dmitriy Kashevich
Night Ghost - Indicateur de flèche pour les options binaires. Ceci est un assistant fiable pour vous à l'avenir! - Pas de redessin sur le graphique -Fonctionne très bien sur toutes les paires de devises ! -Précision de l'indicateur jusqu'à 90% (surtout la nuit) -Pas besoin de configurer pendant une longue période (configurer parfaitement pour les options binaires) - Pas de signaux en retard - L'apparition d'un signal sur la bougie en cours -Parfait pour la période M1 (Pas Plus !
This indicator is customized for binary option trading like M1 timeframe or turbo option trading. The way a binary option works is from the traders perspective is that you choose whether or not a certain underlying asset (a stock, commodity, currency etc.) is going to go up or down in a certain amount of time. You essentially bet money on this prediction. You are shown how much money up front you will earn if your prediction is correct. If your prediction is wrong, you lose your bet and the mone
Good Signal
Yaroslav Varankin
The indicator is designed for binary options and short-term transactions on Forex To enter a trade when a signal appears blue up arrow buy red down arrow sell signal For Forex enter on a signal exit on the opposite signal or take profit For binary options Enter on 1 candle, if the deal goes negative, set a catch on the next candle Works on all timeframes If you apply a filter like Rsi, you will get a good reliable strategy.. The algorithm is at the stage of improvement and will be further develo
indicator for trading binary options and forex trading. The indicator does not redraw the readings. when trading binary options, testing was performed. This indicator showed the good results correct predictions. Under these conditions, the eur / usd m1 chart, when a signal appears, the transaction opens in the direction indicated by the indicator for 5 candles, then the truth is (5 minutes since in us the 1-minute chart of a candlestick is 1 minute) the result was. When trading in the forex
VR Cub
Vladimir Pastushak
VR Cub est un indicateur permettant d'obtenir des points d'entrée de haute qualité. L'indicateur a été développé pour faciliter les calculs mathématiques et simplifier la recherche de points d'entrée dans un poste. La stratégie de trading pour laquelle l'indicateur a été rédigé prouve son efficacité depuis de nombreuses années. La simplicité de la stratégie de trading est son grand avantage, qui permet même aux traders débutants de négocier avec succès avec elle. VR Cub calcule les points d'ouve
Beta Signal
Svyatoslav Kucher
Beta Signal   - индикатор предназначенный для поиска локальных экстремумов, определения текущей тенденции. В расчетах индикатора используется авторская методика. С помощью индикатора можно определять места возможного разворота цены желательно в направлении тенденции, но также с достаточной точностью и против нее. Также с помощью индикатора можно определять текущую тенденцию. Индикатор подходит для любых валютных пар, но для адекватного отображения показания необходимо, чтобы было достаточно исто
Indicator for binary options arrow is easy to use and does not require configuration works on all currency pairs, cryptocurrencies buy signal blue up arrow sell signal red down arrow tips do not trade during news and 15-30 minutes before their release, as the market is too volatile and there is a lot of noise it is worth entering trades one or two candles from the current period (recommended for 1 candle) timeframe up to m 15 recommended money management fixed lot or fixed percentage of the depo
How to use Pair Trading Station Pair Trading Station is recommended for H1 time frame and you can use it for any currency pairs. To generate buy and sell signal, follow few steps below to apply Pair Trading Station to your MetaTrader terminal. When you load Pair Trading Station on your chart, Pair Trading station will assess available historical data in your MetaTrader platforms for each currency pair. On your chart, the amount of historical data available will be displayed for each currency pai
Super Magic Signal     indicator is designed for signal trading. This indicator generates trend signals. It uses many algorithms and indicators to generate this signal. It tries to generate a signal from the points with the highest trend potential. This indicator is a complete trading product. This indicator does not need any additional indicators. The indicator certainly does not repaint. The point at which the signal is given does not change.     Features and Suggestions Time Frame:
Trend PRO Expert Advisor
Nguyen Tran Ha
1 (1)
Trend PRO Expert Advisor  is developed base on the PipFinite Trend PRO Indicator, the best indicators on the market so far. PipFinite  Trend Pro's smart algorithm detects the trend, filters out market noise and gives entry signals with exit levels.  This EA open order when the indicator has buy/sell signals and set SL/TP follow the indicator rules. You can read more information about PipFinite Trend PRO indicator  here . Important Information   This EA will only work if you purchased  PipFin
ZhiBiCCI MT4
Qiuyang Zheng
5 (1)
[ZhiBiCCI] indicators are suitable for all cycle use, and are also suitable for all market varieties. [ZhiBiCCI] Green solid line is a reversal of bullish divergence. The green dotted line is a classic bullish divergence. [ZhiBiCCI] The solid line to the red is a reverse bearish divergence. The red dotted line is a classical bearish divergence. [ZhiBiCCI] can be set in the parameters (Alert, Send mail, Send notification), set to (true) to send instant signals to the alarm window, email, in
Les acheteurs de ce produit ont également acheté
Présentation de l'indicateur miraculeux Forex : Libérez la puissance du trading précis En avez-vous assez de chercher le meilleur indicateur Forex qui fournisse réellement des résultats exceptionnels sur tous les délais ? Ne cherchez plus ! L'indicateur miraculeux Forex est là pour révolutionner votre expérience de trading et propulser vos gains vers de nouveaux sommets. Basé sur une technologie de pointe et des années de développement minutieux, l'indicateur miraculeux Forex se positionne comme
TrendMaestro
Stefano Frisetti
5 (2)
note: this indicator is for METATRADER4, if you want the version for METATRADER5 this is the link: TRENDMAESTRO recognizes a new TREND in the bud, he never makes mistakes. The certainty of identifying a new TREND is priceless. DESCRIPTION TRENDMAESTRO identifies a new TREND in the bud, this indicator examines the volatility, volumes and momentum to identify the moment in which there is an explosion of one or more of these data and therefore the moment in which prices have strong probability of f
Indicator : RealValueIndicator Description : RealValueIndicator is a powerful tool designed specifically for trading on the EURUSD pair. This indicator analyzes all EUR and USD pairs, calculates their real currency strength values, and displays them as a single realistic value to give you a head start on price. This indicator will tell you moves before they happen if you use it right. RealValueIndicator allows you to get a quick and accurate overview of the EURUSD currency pair tops and bottoms,
Nous vous présentons ON Trade Waves Patterns Harmonic Elliot Wolfe, un indicateur avancé conçu pour détecter divers types de schémas sur le marché à l'aide de méthodes manuelles et automatiques. Voici comment il fonctionne : Schémas Harmoniques : Cet indicateur peut identifier les schémas harmoniques qui apparaissent sur votre graphique. Ces schémas sont essentiels pour les traders qui pratiquent la théorie du trading harmonique, telle qu'elle est décrite dans le livre de Scott Carney "Harmonic
Shepherd Harmonic Pattern
Abdullah Alrai
4.68 (59)
Cet indicateur détectera des motifs harmoniques dessinés sur le graphique par des méthodes manuelles et automatiques. Vous pouvez consulter le manuel d'utilisateur à partir de ce lien: Ajoutez votre avis et contactez-nous pour l'obtenir. Il existe une version gratuite pour essayer ce produit sur MT4. Vous pouvez l'utiliser pour détecter les motifs Gartley et Nenstar: https://www.mql5.com/en/market/product/30181 Vous pouvez acheter la version complète de MT4 à partir de: https://www.mql5.com/en/m
PZ Day Trading
PZ TRADING SLU
3.67 (3)
This indicator detects price reversals in a zig-zag fashion, using only price action analysis and a donchian channel. It has been specifically designed for short-term trading, without repainting or backpainting at all. It is a fantastic tool for shrewd traders aiming to increase the timing of their operations. [ Installation Guide | Update Guide | Troubleshooting | FAQ | All Products ] Amazingly easy to trade It provides value on every timeframe It provides suitable SL and TP levels It impl
Gann Signal
Kirill Borovskii
Gann Signal is a very simple indicator at first glance, but hidden inside is many years of experience in studying W.D.Ganna methods. The indicator gives accurate BUY/SELL signals, without redrawing. The indicator is very easy to use. All you need to do is attach it to your chart and follow its recommendations. The indicator constantly analyzes the market for entry opportunities. When such an opportunity appears, the indicator gives a signal in the form of an arrow. I repeat, all signals are NOT
Présentation de l'indicateur astronomique pour MT4 : Votre compagnon de trading céleste ultime Êtes-vous prêt à élever votre expérience de trading à des hauteurs célestes ? Ne cherchez pas plus loin que notre indicateur astronomique révolutionnaire pour MT4. Cet outil innovant transcende les indicateurs de trading traditionnels en exploitant des algorithmes complexes pour vous fournir des aperçus astronomiques inégalés et des calculs de précision. Un univers d'informations à portée de main : Con
Order Block Indicator MT4
Diego Arribas Lopez
5 (3)
[ MT5 Version ] Order Block Indicator MT4 Order Block Indicator MT4  is currently the most accurate and customizable indicator in the market. It has been developed to facilitate the analysis of operations based on Order Blocks and Supply and Demand Zones. These zones are possible reversal points of a movement. Order Blocks indicate a possible accumulation of orders in one area. The price usually gets to reach and react strongly to those areas. The most relevant levels for this reaction are the c
Please send me Direct message on MQL5 CHAT after purchasing the Indicator for Training and Installation Support There are some additional files that is important to use with the Indicator . So be sure to contact me after purchasing the Indicator So that I can add you for training and support . If you find any difficulty with installation then send me Direct message here So that I can connect with you via Anydesk or Teamview for the product installation. " Smart Order Block Indicator " to find
Candle Power Pro
Thushara Dissanayake
4.33 (6)
Libérez la puissance des informations de volume réel avec l'indicateur   Candle Power Pro   . Cet outil dynamique capture les données de volume réelles pour chaque bougie et les présente sous forme de pourcentage du volume total. Ce faisant, cela vous permet de discerner la lutte en cours entre acheteurs et vendeurs sur le marché. Le Candle Power Pro affiche la bataille entre les acheteurs et les vendeurs sous forme de pourcentage du volume total, vous donnant des informations précieuses sur la
Market Breaker Updated version 3
Allistair Kabelo Mandow
1 (1)
Features for software Main functions: Accurate entry signals WITHOUT REPAINTING! Once a signal appears, it remains valid! This is a significant distinction from repainting indicators that might provide a signal and then alter it, potentially leading to deposit losses. Now, you can enter the market with higher probability and precision. There's also a function to colour candles after an arrow appears until the target (take profit) is reached or a reversal signal appears . Display of STOP LOSS
Weis Wave with Alert
Trade The Volume Waves Single Member P.C.
4.79 (19)
Rental/Lifetime Package Options and Privileges' * For optimum results the yearly or lifetime package is suggested due to live training and Discord  channel trading with the  creator! Rent Monthly Six Months   Yearly/Lifetime Weis Wave with Speed with Alert+Speed Index x x x Manual  x x x Quick Set up Video x x x Blog x x x Lifetime Updates x x x Setup and Training Material x x Free Rectangle Break Alert Tool      x Discord Access Channel "The SI traders" x 2-hour live methodology traini
VTrende Pro mt4
Andrii Diachenko
3 (2)
VTrende Pro MT4 - MTF indicator for trend trading with a display panel for MT5 *** Videos can be translated into any language using subtitles (video language - Russian) Although the signals of the VTrende Pro indicator can be used as signals of a full-fledged trading system, it is recommended to use them in conjunction with the Bill Williams TS. VTrende Pro  MT4 is an extended version of the VTrende indicator. Difference between Pro version and VTrende: - Time zones - Signal V - signal 1-
The Nihilist 5.0 Indicator includes Forexalien and Nihilist Easy Trend trading strategies and systems. It is composed of an MTF Dashboard where you can analyze the different input possibilities of each strategy at a glance. It has an alert system with different types of configurable filters. You can also configure which TF you want to be notified on your Metatrader 4 platform and Mobile application The indicator has the option to view how could be a TP and SL by using ATR or fixed points, even
MartingaleArrow
Abdulkarim Karazon
Martingale Arrow est un indicateur mt4 de type flèche conçu pour le trading d'options binaires martingale, cette flèche s'imprime sur la barre ouverte/intra barre et donne une alerte. COMMENT UTILISER : ouvrez le commerce dès que la flèche apparaît, si le commerce est gagné, attendez le prochain signal et négociez le même lot. Si le commerce perd le double lot au signal suivant et continuez ainsi jusqu'à ce qu'un signal gagne, réinitialisez et négociez avec le premier lot commercial. DÉLAI RECO
System Trend Pro - This is the best trend trading indicator!!! The indicator no repaint!!!   The indicator has   MTF   mode, which adds confidence to trading on the trend (   no repaint   ). How to trade? Everything is very simple, we wait for the first signal (big arrow), then wait for the second signal (small arrow) and enter the market in the direction of the arrow. (See screens 1 and 2.) Exit on the opposite signal or take 20-30 pips, close half of it, and keep the rest until the oppo
Full STO
Roman Smoroda
Indicateur STO complet (inclut toutes les versions des trois indicateurs STO : Premium, Gold, Silver) - STABLE TRADE OPTION est conçu pour le trading automatique d'options binaires.  À LIRE ATTENTIVEMENT !!!!! IMPORTANT Dans un terminal, créez deux modèles avec des expirations différentes, un modèle pour 18:01, 18:02 avec des expirations de 1 à 15 minutes et un modèle pour 22:00 avec des expirations de 10 à 20 minutes. Taux de réussite : 71% sur les 5 dernières années Money management :
Connect Indicator
Sukunthakan Ngernbamrung
Connect Indicator is a tool used for connecting indicators between the MQL market and MT4. The connected indicators are made by our group and can be used for other applications, such as sending messages to the Line application or Telegram application. If you have any questions, please don't hesitate to ask us to receive support. Function and indicator buffer Buffer one is the high price of the previous candle. Buffer two is the high price of the previous candle. Usage To connect indicators to fu
Idea: RSI ( Relative Strength Index) and CCI ( Commodity Channel Index ) are powerfull to solved the market.  This indicator has Smoothed Algorithmic signal of RSI and CCI. So that, it separates the market into buy and sell zones, these areas are marked with arrows, red for downtrend, green for uptrend. This algorithm has the effect of predicting the next trend based on the historical trend, so users need to be cautious when the trend has gone many candles. Please visit screenshots
DESCRIPTION The CHAOS INDICATOR has been developed to be used for the TRADING STRATEGY OF CHAOS, as described in the book. The book is in italian language only and can be obtained only on my website indicated below. DATAS COLLECTED AND SHOWN ON GRAPHS The CHAOS INDICATOR apply easily to any graph and any asset, and it is a TRADING FACILITATOR, as it identify immediately the following items on any graph: - The GP (= RIGHT PRICE) i.e. the price to which the asset should be attracted within 24
Gann Swing Structure
Kirill Borovskii
5 (1)
This indicator is based on the mathematics of the great trader W.D. Ganna. With its help, you can easily find strong levels by analyzing swings to find the optimal entry point. The indicator works on all instruments and all timeframes. The indicator is fully manual and has control buttons. All you need to do is press the NEW button, a segment will appear, which you can place on any movement, swing or even 1 candle that you want to analyze. By placing the segment, press the OK button. A grid (th
Tricky to find and scarce in frequency, divergences are one of the most reliable trading scenarios. This indicator finds and scans for regular and hidden divergences automatically using your favourite oscillator. [ Installation Guide | Update Guide | Troubleshooting | FAQ | All Products ] Easy to trade Finds regular and hidden divergences Supports many well known oscillators Implements trading signals based on breakouts Displays suitable stop-loss and take-profit levels Configurable oscill
PZ Swing Trading
PZ TRADING SLU
5 (4)
Swing Trading is the first indicator designed to detect swings in the direction of the trend and possible reversal swings. It uses the baseline swing trading approach, widely described in trading literature. The indicator studies several price and time vectors to track the aggregate trend direction and detects situations in which the market is oversold or overbought and ready to correct. [ Installation Guide | Update Guide | Troubleshooting | FAQ | All Products ] Profit for market swings with
A. Qu'est-ce que l'A2SR ?   * C'est un indicateur technique avancé (pas de peinture, pas de retard). -- Conseils : -- sur https://www.mql5.com/en/blogs/post/734748/page4#comment_16532516 -- et https://www.mql5.com/en/users/yohana/blog A2SR a une technique spéciale pour déterminer les niveaux de Support (demande) et de Résistance (offre). Contrairement à la manière ordinaire que nous avons vue sur le net, A2SR a un concept original pour déterminer les niveaux réels de SR. La technique origin
Le système de négociation technique des flèches de renversement de BB a été développé pour prédire les points inversés pour prendre des décisions de vente au détail. La situation actuelle du marché est analysée par l'indicateur et structurée pour plusieurs critères: l'attente des moments d'inversion, des tournants potentiels, des signaux d'achat et de vente. L'indicateur ne contient pas d'informations excédentaires, a une interface visuelle compréhensible, permettant aux commerçants de prend
Gold Channel is a volatility-based indicator, developed with a specific timing algorithm for the XAUUSD pair, which consists of finding possible corrections in the market. This indicator shows two outer lines, an inner line (retracement line) and an arrow sign, where the theory of the channel is to help identify overbought and oversold conditions in the market. The market price will generally fall between the boundaries of the channel. If prices touch or move outside the channel it is a tra
ECM Channel MT4
Paulo Rocha
5 (1)
ECM Elite Channel is a volatility-based indicator, developed with a specific time algorithm, which consists of finding possible corrections in the market. This indicator shows two outer lines, an inner line (retracement line) and an arrow sign, where the channel theory is to help identify overbought and oversold conditions in the market. The market price will generally fall between the boundaries of the channel. If prices touch or move outside the channel, it's a trading opportunity. The
Gann Zone Pro
Kirill Borovskii
This indicator identifies and displays zones, as it were areas of strength, where the price will unfold. The indicator can work on any chart, any instrument, at any timeframe. The indicator has two modes. The indicator is equipped with a control panel with buttons for convenience and split into two modes. Manual mode: To work with manual mode, you need to press the NEW button, a segment will appear. This segment is stretched over the movement and the LVL button is pressed. The level is displayed
Full Forex Market View Dashboard
Opengates Success International
5 (2)
Indicateur de tableau de bord FULL FOREX MARKET VIEW Il s'agit d'un indicateur personnalisé créé pour donner aux commerçants une vue complète de ce qui se passe sur le marché. Il utilise des données en temps réel pour accéder au marché et afficher toutes les informations nécessaires pour effectuer des transactions réussies. INSTALLATION: Avant de joindre cet indicateur à votre graphique de fenêtre, accédez au panneau Market Watch de votre MT4 et MASQUEZ toutes les paires de devises dont
Plus de l'auteur
ACTUELLEMENT 26% DE RÉDUCTION La meilleure solution pour tout débutant ou trader expert ! Cet indicateur est un outil de trading unique, de haute qualité et abordable car nous avons incorporé un certain nombre de caractéristiques exclusives et une nouvelle formule. Avec seulement UN graphique, vous pouvez lire la force de la devise pour 28 paires Forex ! Imaginez comment votre trading va s'améliorer parce que vous êtes capable de repérer le point de déclenchement exact d'une nouvelle tendan
Actuellement 20% de réduction ! La meilleure solution pour tout débutant ou trader expert ! Ce logiciel de tableau de bord fonctionne sur 28 paires de devises. Il est basé sur 2 de nos principaux indicateurs (Advanced Currency Strength 28 et Advanced Currency Impulse). Il donne un excellent aperçu de l'ensemble du marché Forex. Il montre les valeurs de l'Advanced Currency Strength, la vitesse de mouvement des devises et les signaux pour 28 paires de devises dans tous les (9) délais. Imagine
Advanced Supply Demand
Bernhard Schweigert
4.92 (310)
CURRENTLY 26% OFF !! Best Solution for any Newbie or Expert Trader! This indicator is a unique, high quality and affordable trading tool because we have incorporated a number of proprietary features and a new formula. With this update, you will be able to show double timeframe zones. You will not only be able to show a higher TF but to show both, the chart TF, PLUS the higher TF: SHOWING NESTED ZONES. All Supply Demand traders will love it. :) Important Information Revealed Maximize the potenti
Advanced Supply Demand MT5
Bernhard Schweigert
4.53 (15)
La meilleure solution pour tout commerçant débutant ou expert ! Cet indicateur est un outil de trading unique, de haute qualité et abordable car nous avons intégré un certain nombre de fonctionnalités propriétaires et une nouvelle formule. Avec cette mise à jour, vous pourrez afficher des zones à double horaire. Vous pourrez non seulement afficher un TF plus élevé, mais afficher les deux, le graphique TF, PLUS le TF supérieur : AFFICHAGE DES ZONES NICHÉES. Tous les traders Supply Demand vont ado
ACTUELLEMENT 31% DE RÉDUCTION ! ! La meilleure solution pour tout débutant ou Expert Trader ! Cet indicateur est un outil de trading unique, de haute qualité et abordable car nous avons incorporé un certain nombre de caractéristiques exclusives et une formule secrète. Avec seulement UN graphique, il donne des alertes pour les 28 paires de devises. Imaginez comment votre trading s'améliorera parce que vous serez capable de repérer le point de déclenchement exact d'une nouvelle tendance ou d'
GOLD Impulse with Alert
Bernhard Schweigert
4.56 (9)
Cet indicateur est une super combinaison de nos 2 produits Advanced Currency IMPULSE with ALERT  +   Currency Strength Exotics . Il fonctionne pour tous les cadres temporels et montre graphiquement l'impulsion de force ou de faiblesse pour les 8 principales devises plus un symbole ! Cet indicateur est spécialisé pour montrer l'accélération de la force des devises pour tout symbole comme l'or, les paires exotiques, les matières premières, les indices ou les contrats à terme. C'est le premi
Currency Strength Exotics
Bernhard Schweigert
4.88 (33)
ACTUELLEMENT 20% DE RÉDUCTION ! La meilleure solution pour tout débutant ou trader expert ! Cet indicateur est spécialisé pour montrer la force de la devise pour tous les symboles comme les paires exotiques, les matières premières, les indices ou les contrats à terme. C'est le premier de son genre, n'importe quel symbole peut être ajouté à la 9ème ligne pour montrer la force réelle de la devise de l'or, l'argent, le pétrole, DAX, US30, MXN, TRY, CNH etc. Il s'agit d'un outil de trading uniq
ACTUELLEMENT 20% DE RÉDUCTION ! La meilleure solution pour tout débutant ou trader expert ! Cet indicateur est un outil de trading abordable car nous avons incorporé un certain nombre de caractéristiques exclusives ainsi qu'une nouvelle formule. L'Indicateur Avancé de Volume Accumulé de Devises est spécialisé pour les 28 principales paires Forex et fonctionne sur tous les cadres temporels. Il s'agit d'une nouvelle formule qui, sur un seul graphique, extrait tout le volume des devises (C-V
La meilleure solution pour tout débutant ou trader expert ! Cet indicateur est un outil de trading unique, de haute qualité et abordable car nous avons incorporé un certain nombre de caractéristiques exclusives et une nouvelle formule. Avec seulement UN graphique, vous pouvez lire la force de la devise pour 28 paires Forex ! Imaginez comment votre trading va s'améliorer parce que vous êtes capable de repérer le point de déclenchement exact d'une nouvelle tendance ou d'une opportunité de scalp
La meilleure solution pour tout débutant ou Expert Trader ! Cet indicateur est un outil de trading unique, de haute qualité et abordable car nous avons incorporé un certain nombre de caractéristiques exclusives et une formule secrète. Avec seulement UN graphique, il donne des alertes pour les 28 paires de devises. Imaginez comment votre trading s'améliorera parce que vous serez capable de repérer le point de déclenchement exact d'une nouvelle tendance ou d'une opportunité de scalping ! Cons
My Trade History PRO
Bernhard Schweigert
5 (3)
ACTUELLEMENT 20% DE RÉDUCTION ! ! La meilleure solution pour tout débutant ou trader expert ! Passer en revue vos transactions est la première étape d'un trader qui réussit. Les traders qui réussissent ont l'habitude de revoir régulièrement leurs performances de trading. Cet outil vous aidera à le faire. Le processus de révision sera plus efficace avec cet outil pour suivre votre trading. Analysez vos trades manuels ou les trades de votre EA. Utilisez les 3 vues générales. Pour passer
My Trades in Pips
Bernhard Schweigert
4.71 (24)
Un outil de trading que vous ne voulez pas manquer. L'indicateur affiche toutes les transactions/opérations dans le graphique avec le symbole auquel il est attaché. Il imprime le nombre de pips en profit ou en perte. Par choix, il imprime une ligne verticale à travers les sous-fenêtres pour une meilleure analyse. Consultez également la version PRO ici : My Trade History PRO https://www.mql5.com/en/market/product/50206 Il ajoute également les informations sur le résultat total des transactio
FREE
ACTUELLEMENT 26% DE RÉDUCTION ! !! Cet indicateur est une super combinaison de nos deux indicateurs principaux ( Advanced Currency Strength 28   &  Advanced Currency IMPULSE with ALERT ). Il montre les valeurs de force de la devise pour les TICK-UNITS et les signaux d'alerte pour 28 paires Forex. 11 unités de tic-tac différentes peuvent être utilisées. Ce sont 1, 2, 3, 4, 5, 6, 10, 12, 15, 20 et 30 secondes. La barre de Tick-Unit dans la sous-fenêtre sera affichée et déplacée vers la gauche l
Filtrer:
MarcoEA
133
MarcoEA 2023.06.09 22:50 
 

hello, I bought two of your indicators. Sup and Dem and Dashboard of Sup and Demand. What are the bonuses?

Bernhard Schweigert
80481
Réponse du développeur Bernhard Schweigert 2023.06.25 12:01
Thank you for purchasing our dashboard. As a bonus, we invite you to join our exclusive community of traders by registering at www.CurrencyStrength28.com/forum . In our forum, you'll have access to valuable resources and discussions on successful trading strategies. The best part? It's completely free for our clients. Don't miss out on this opportunity to enhance your trading skills and connect with like-minded traders. If you have any further questions or need assistance, feel free to reach out. Happy trading!
Gabor Bocsak
1858
Gabor Bocsak 2023.05.23 18:42 
 

I really like the indicators! Actually i use 4 of them and they work really well together! I had a lot of questions as i use a bit different strategy.but i got all the help! Thank you!

Bernhard Schweigert
80481
Réponse du développeur Bernhard Schweigert 2023.06.09 15:01
Thank you, Gabor Bocsak, for your positive feedback. We truly appreciate it. We are glad to hear that you are enjoying the indicators and that they are working well in conjunction with your strategy. Our team is always ready to assist you and answer any questions you may have. We are committed to providing top-notch support and ensuring your success. 💖
Tyrena Booker
96
Tyrena Booker 2023.02.01 19:59 
 

The indicator is phenomenal!!! This indicator help me to know when pullbacks are happening.I enjoy the enhance features of this indicator because you can add any symbols see the whole market within seconds. I use this indicator with Currency Strength Exotics on the chart and let just say you will be counting PIPS. Bernhard will help with your question and answer each one in punctual time. I highly recommend this indicator to anyone. I appreciated your help Bernhard!!!

Bernhard Schweigert
80481
Réponse du développeur Bernhard Schweigert 2023.02.02 12:38
I appreciate your review with the phenomenal note.💖
batukbhairava
206
batukbhairava 2022.08.10 19:13 
 

Similar to CS28 Dashboard this indicator is a great dashboard which provides the Supply & Demand zones of all 28 pairs in a single window. My only issue with this indicator is that I couldn't resize the windows properly. May be Bernhard could look into this in the next update can design a template which can be resized properly. Also adding & removing currency requires manually typing the currency pairs in the settings. Is it possible if we can use the "Check Box" from the list instead? That will save lot of time As usual great work from Bernhard Thanks and Happy trading to all.. :-)

Bernhard Schweigert
80481
Réponse du développeur Bernhard Schweigert 2022.12.30 16:05
Thanks for sharing your great feedback. 🙏💖
New update: 2 buttons have been added to move the dashboard right/left or up/down. There may be symbols outside the visible chart if there are many symbols used. A click on the button will move the diagram by a number of rows or columns. Hope it helps.
najis080
129
najis080 2021.12.08 19:38 
 

Makes trading in zone much easier. I love this indicator.

Bernhard Schweigert
80481
Réponse du développeur Bernhard Schweigert 2022.02.02 09:07
Thanks for the review! 👍
Darryl Brown
203
Darryl Brown 2021.09.27 07:28 
 

I rented the indicator over the weekend and I plan on using this indicator along with cs28 and impulse for binary options trading. My first day so far I made 3k from $400 (5 wins 0 loss trades total) by following his rules of all 3 indicators. His system is by far superior and worth the money spent IMO. This indicator lets you know that all entries are not good entries. I love your other indicators Bernhard but this is by far my favorite one.

Bernhard Schweigert
80481
Réponse du développeur Bernhard Schweigert 2021.12.06 13:30
Thank you very much for your excellent review, friend! Wish you more success in your trading. 🙏👍
sudiang
222
sudiang 2021.09.06 15:00 
 

Personally, I like the stand alone version better. But this dashboard help me alot not to open many chart and stay all the time infront of laptop to monitor the opportunity. Just use it with the main trend and TF > 30, and it give low RR and many potential setup.

Bernhard Schweigert
80481
Réponse du développeur Bernhard Schweigert 2021.09.07 20:44
Thanks for the feedback! 🙏👍
George Palcau
21
George Palcau 2021.03.15 21:09 
 

Supply and demand zones are dissapearing all the time and it is confusing when it broke that resistance, i did not knew that from that begining and i can't use this indicator in my trading. When i contacted the seller about refund he recommended to buy another indicator that could go better with this one. Signals and alarms are also not triggering often. Overall bad experience and i did not received any refund.

Bernhard Schweigert
80481
Réponse du développeur Bernhard Schweigert 2021.03.16 13:52
It is the design of the dashboard to give a quick overview of the market. If you want to see broken zones, you need to use Advanced Supply Demand indicator version. The whole mql5 website does not support refunds. You can try the free demo before buying to know how it works. Besides, you rent only 1 month, which is only intended for a test.
Zachary David Cox
914
Zachary David Cox 2021.02.28 14:38 
 

I've used a couple of this authors products and have had success so I decided to try this one. My experience with the other products made setup and understanding very easy. It is a very powerful indicator!

Bernhard Schweigert
80481
Réponse du développeur Bernhard Schweigert 2022.10.01 17:21
Thanks for the honest review! 👍
Zafer Cakar
201
Zafer Cakar 2021.02.24 21:04 
 

Very strong indicator , incredible.

elthandoriancox
62
elthandoriancox 2020.09.18 14:11 
 

This indicator makes visually easy to determine where the buyers and sellers are in the market, thereby allowing you to see where the market will turn and or go too, impressive Bernhard !!!

a.hanson
221
a.hanson 2020.09.12 12:36 
 

I only have this indicator for 3 weeks but already I find it very useful in determining where to get out of a trade. Very good indicator, I am still getting used to it Bernhard's support is great like with all his other indicators, keep up the good job work.Thanks

Mark Taylor
1722
Mark Taylor 2020.08.27 11:30 
 

I have a few SD indicators and this one is by far the best, easy to read at a quick glance.

teapeak
75
teapeak 2020.08.05 13:21 
 

Best SD indicator I ever saw in Forex for Mt4. Hat off. Thank you.

SENMAO ZHANG
643
SENMAO ZHANG 2020.07.15 07:46 
 

This is the best support pressure indicator I've ever used, and it's my fifth Bernhard product.

stev18
136
stev18 2020.07.10 15:42 
 

I have been using some of the indicators from Bernhard. The quality of his products is very commendable. This indicator is a great tool. It plots accurate supply and demand zones on the chart and also displays them on a dashboard. With the dashboard, one can easily spot zones of interest, that can be traded with high probability of success. It also displays a lot of information that will help the trader make better trading decisions. I find it very useful. Thank you Bernhard and keep up the good work.

Oliver Henry
593
Oliver Henry 2020.06.16 13:01 
 

As a long time user of Bernhard's stand alone Supply and demand indicator I know just how accurate this indicator is. Being able to receive alerts for multiple pairs and monitor from a single dashboard is next level trading! Using this in conjunction with his other indicators makes for some very reliable signals. Many thanks

prestonmay3
215
prestonmay3 2020.02.22 20:19 
 

I have been using s/d as trade entry and exit now with a lot of success . The problem is that I spent most of my day looking for trades and charting . Instead of charting all 28 pairs , I use this to send me alerts , then I do technical analysis . Most free ones will only tell you when price enters a zone and not when it breaks and exit. I like this so much that I will purchase the Advance Standalone version and the Exotic ACS system. I have wasted 2000 on systems and indicators in the past year - This system paid for itself within the first week. The developer is an A plus guy also. Always answers questions in a fast manner .

valera123
172
valera123 2019.11.05 20:58 
 

Very good and high-quality product!

daniela maria lazzi
514
daniela maria lazzi 2019.10.16 12:41 
 

Incredibile.SUPER-Genio l'ideatore di un indicatore simile.Grazie

12
Répondre à l'avis
Version 3.7 2024.04.25
Best rated Supply and Demand Dashboard in the Market.
Important improvements.
Please update.
Version 3.6 2024.02.21
Various improvements for new Metatrader version.
Version 3.5 2023.12.26
Unlock Your Trading Potential with the Latest Upgrade!

Seize the opportunity for a trading revolution! Elevate your strategies with the latest enhancements to the Supply and Demand DASHBOARD PRO. Upgrade now and trade with newfound confidence. Don't miss out on these essential improvements—your journey to successful trading begins here.
Version 3.4 2023.10.25
We've just released an exciting update for our indicator, packed with enhancements that take your trading to the next level.

Upgrading your indicator is a smart move. It ensures you're leveraging the latest features, giving you a competitive edge in the market. Don't miss out!

Should you have questions or need help with the update, our team is here for you. Reach out anytime; we're committed to your success.

www.CurrencyStrength28.com
Version 3.3 2023.08.24
Upgrade to Version 3.3 for Enhanced Trading Insights

+ We're thrilled to introduce Version 3.3, featuring the industry's highest-rated Supply and Demand DASHBOARD PRO. Elevate your trading strategy with this powerful tool, designed to help you identify critical price reversal areas.

+ What's New in Version 3.3:
- Seamlessly compatible with the latest Metatrader version.
- Empowered by advanced algorithmic enhancements, offering unparalleled accuracy in Supply and Demand multi-timeframe analysis.

+ Don't miss out on these exciting updates. Keep your indicators up to date effortlessly and at no cost. By staying current with our latest version, you're ensuring that your trading arsenal remains at the cutting edge of the market.

+ Upgrade to Version 3.3 now and access the best-rated Supply and Demand DASHBOARD PRO available. With the new Price Label feature, trading on higher timeframes becomes even more insightful. Join the community of savvy traders who are enhancing their strategies with our free, top-notch tools.
Version 3.2 2023.06.25
We are thrilled to announce the highly anticipated release of Version 3.2 of our Supply and Demand Dashboard PRO – the top-rated tool for traders like you. With its advanced capabilities, this powerful indicator will revolutionize your trading strategy by identifying critical price reversal areas, giving you a significant edge in the market.

Discover the latest enhancements we have made to ensure seamless compatibility with the newest Metatrader version. By upgrading to Version 3.2, not only do you gain access to cutting-edge features, but you also stay ahead of the competition. And the best part? These updates are completely free, so you can maximize your trading potential without any additional cost.

Upgrade now to Version 3.2 and experience firsthand the unparalleled benefits of our top-rated Supply and Demand Dashboard PRO. Take control of your trading journey, make informed decisions, and elevate your profitability. Don't miss out on this opportunity to improve your trading strategy – all for free.
Version 3.1 2023.04.23
We're excited to announce the release of Version 3.1, featuring the best-rated Supply and Demand Zone Dashboard on the market. This powerful tool helps you spot key areas of price reversal, giving you an edge in your trading strategy.

Our team has made various improvements to ensure compatibility with the latest Metatrader version, so you can take advantage of new features and stay ahead of the competition. Plus, keeping your indicators up to date is completely free and ensures that you're always using the most advanced tools available.

Upgrade now to Version 3.1 and experience the benefits of our best-rated Supply and Demand Zone Dashboard. Stay ahead of the competition and improve your trading strategy with the latest updates, all for free.
Version 3.0 2023.02.20
Please update to Version 3.0 of the Supply and Demand Zone Dashboard Indicator, the best rated indicator of its kind in the market, with various improvements.

Some traders have reported that the zones in smaller time frames can be overlapped by the full rectangle of the current time frame. We have found a solution to this issue.

Now, you can choose to display the current time frame zone as an empty rectangle with a thicker border, so that the zones in smaller time frames are still visible.

There are two new input parameters available:

Full Rectangles Current Chart TF (default = true)
Rectangle Width Current TF (if not full 1-5) (default = 5)
We have not changed the previous display, so if you want to use the new function, you need to set the "Full Rectangles Current Chart TF" parameter to "false".
Version 2.9 2022.12.31
This is a small adjustment to yesterday's version with the new buttons.
This allows a practical navigation through the dashboard.
Version 2.8 2022.12.30
Added more improvements.
Updating is recommended.

2 buttons have been added to move the dashboard right/left or up/down. There may be symbols outside the visible chart if there are many symbols used. A click on the button will move the diagram by a number of rows or columns.

New input added:
+ Scroll number of rows list (1-10)
Version 2.7 2022.12.19
Various improvements.
Please update.
Version 2.6 2022.10.23
Various improvements.
Please update.
Version 2.5 2022.08.20
A useful feature has been added at the request of a trader.
It is possible for a trader to only have preferences for only buying or selling an instrument. Choose the alarms you want to set. The graph and alert for "entering a zone" and "new zone appearing" remain unaffected.

==== General Alert Settings ====
New input:
+ Traders preference alerts buy-sell-both

There was an issue with M1-alerts that has been fixed.

Please update.
Version 2.4 2022.07.02
Various improvements for new Metatrader version.
Version 2.3 2021.09.19
IMPORTANT UPDATE !!!

Due to new Metatrader versions, we need a corrective input to draw objects in a subwindow. If you use MT4 build 1341+, add the subwindow number (1 for the first subwindow, 2 for the second...). 0 means automatic.

New input at the end of the list:

+ Force objects to subwindow number (0=auto)
Version 2.2 2021.06.02
Various improvements.
Version 2.1 2021.04.25
Various improvements.
Version 2.0 2020.10.22
MAJOR UPDATE 2020
==================

Added optional: Supply and Demand zones with ENGULFING BARS pattern at the beginning of the zone.
Use reversal candle color for bar 1 or bar 2 (the one before). Use either one or both.
Use a true engulfing pattern for the above-mentioned bars. (Must choose above.)

By default the use is false. To use the function you must set the new inputs = true (The selection is copied to all timeframes).

New inputs:
==== Candle pattern
+ use reversal candle color bar 1
+ use reversal candle color bar 2 (both or either)
+ use true engulfing pattern (choose above)

MODIFICATION FOR ZONE SIZE
It was added optionally: Including a wick for the width of the supply and demand zones.
New input:
+ Include wick 1 for the zone size

By default, the function is not used. To use the function, you must set the new input = true (The selection is copied to all timeframes).
Since the zones will be wider, some zones could be filtered. You may want to use lower XY factors.
Version 1.9 2020.10.16
Various improvements.
Version 1.8 2020.06.23
Various improvements.
Optimized signal export to EAs.
Version 1.7 2020.05.21
New graphical feature added. We organize different time frames. Now you can display all time frame names on the right side of each square.

New input:
+ display all TF names right
Version 1.6 2020.01.16
Various improvements.
Version 1.5 2019.05.30
A new filter for alerts has been added to do alerts only if the zone is new or untouched. (Excluding break alert.)

New input:
+ alert only new zones (excluding breaks) (default = false)
To activate the filter set above input to true.
If false, the info will anyway be included into the alerts.
Example Alert: EURUSD H4 Demand-Zone (untested) entered at 1.11333 nested D1

Version 1.4 2019.04.23
Added a description on chart for higher S/D zones to know better the timeframe.
And diverse other improvements.
Version 1.3 2019.04.08
Made some changes to minimum Zone Drop to be align with Advanced Supply Demand indicator.
Version 1.2 2019.04.07
Re-activated the function for pivot and yesterdays high-low-open lines.
Version 1.1 2019.04.06
Added a message print on screen for last alert with time of alert.
You can choose if the time shows broker time or your PC time.
New input
+ Last Signal time is Local or broker time

Added an option to show less digital points.
New input
+ show prices with less digits (0-2) (0=all digits)