PSAR Strategy
- Indicateurs
-
Andrei Lukoianov
 ANDREI LUKOIANOV · MarketStructureLab
Trader since 2008 | Algorithmic trading since 2018
From a trading idea to a clear, systematic approach - Version: 1.0
PSAR Strategy
See the trend direction and spot changes on one chart.
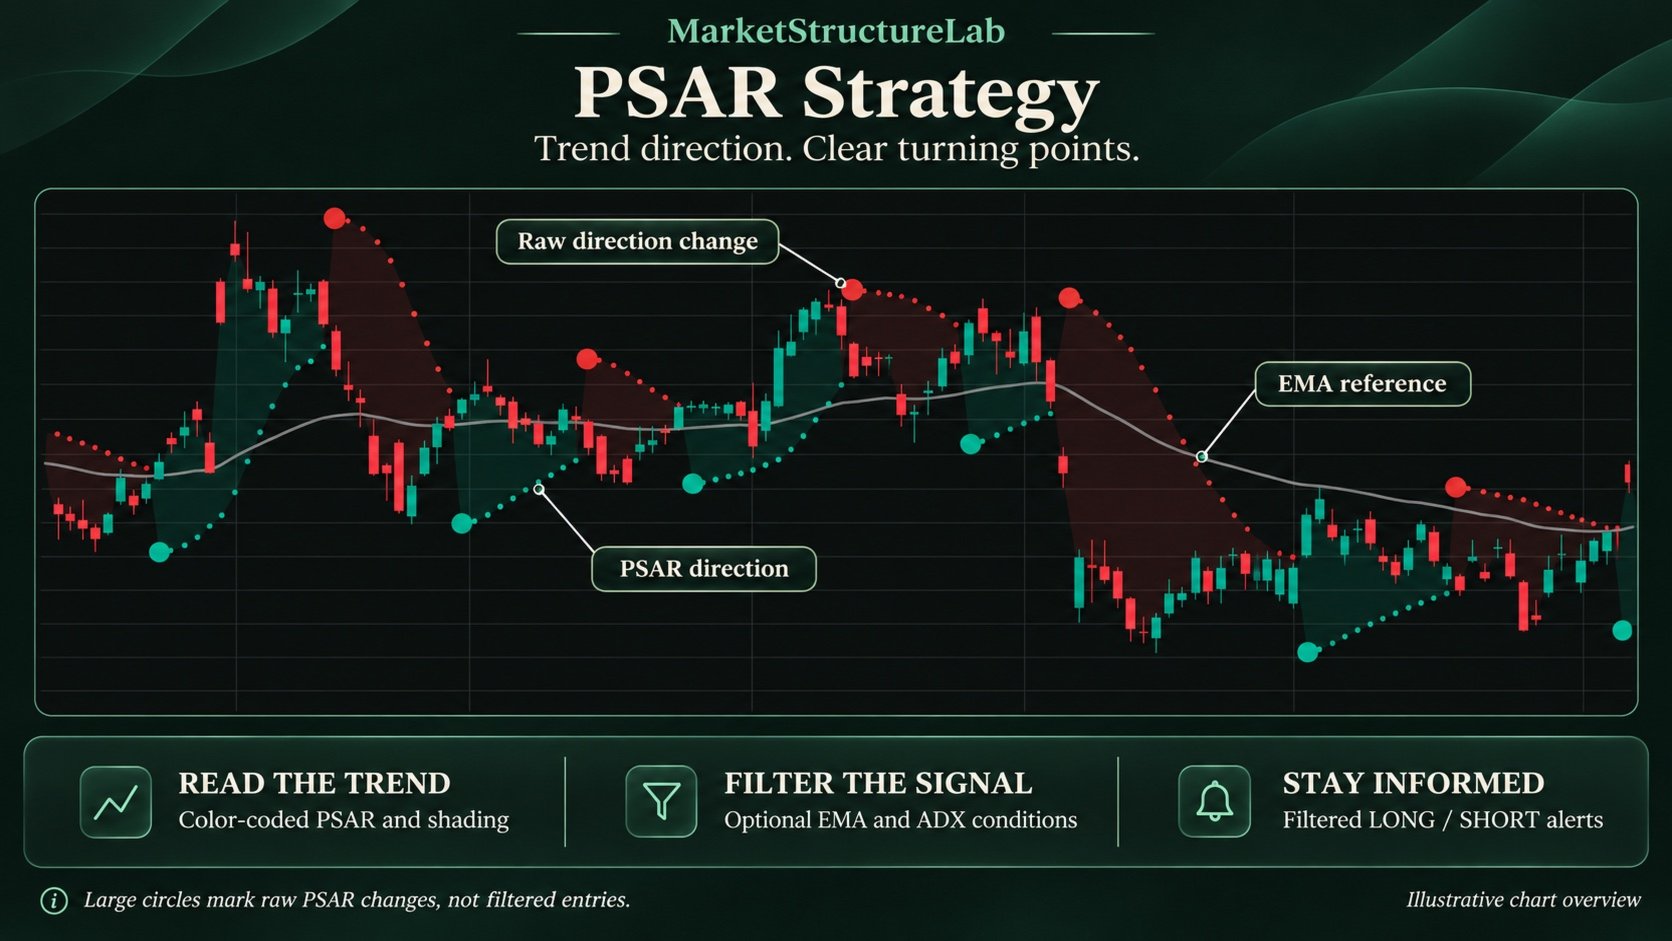
PSAR Strategy is a trend indicator for MetaTrader 5 that combines Parabolic SAR, an EMA direction filter, and an ADX trend strength filter.
Colored dots show the current PSAR state, large circles highlight direction changes, and transparent shading makes the chart easier to read. Alerts can notify you when a direction change meets your selected filter conditions.
Clear Chart Display
- Turquoise dots below price — bullish PSAR state.
- Red dots above price — bearish PSAR state.
- Large circles — raw PSAR direction changes. Enabled by default.
- Colored shading — highlights the current state.
- EMA line — an additional reference for market direction.
You can adjust the colors, dot size, marker size, and shading opacity. Large markers and shading can be switched off separately.
Additional Signal Filters
When PSAR changes direction, the indicator checks the enabled conditions:
- EMA direction: price must be above the EMA for LONG and below it for SHORT.
- ADX strength: ADX must meet or exceed the selected minimum value.
- Candle direction: a bullish candle for LONG and a bearish candle for SHORT, when candle confirmation is enabled.
- Signal cooldown: enough bars must pass after the previous filtered signal.
The default settings use EMA 50, ADX 14 with a minimum value of 15, and filtered signal confirmation after the candle closes.
A large circle and a filtered alert are different events. The circle marks a raw PSAR direction change. A filtered LONG or SHORT alert is triggered only when all enabled conditions are met. Filtered signals do not have separate chart markers.
How to Use
PSAR Strategy supports visual chart analysis and can provide additional confirmation for your own trading method.
The indicator calculates values for the symbol and timeframe of the current chart. It can be used on different instruments and timeframes when enough price history is available.
Start with the default settings, review how the indicator behaves on your chosen market, and then adjust PSAR sensitivity and filter conditions to suit your approach.
Input Parameters
Parabolic SAR Calculation
- PSAR Start — initial acceleration factor. Default: 0.02.
- PSAR Increment — acceleration factor step. Default: 0.02.
- PSAR Maximum — maximum acceleration factor. Default: 0.20.
Signal Filters
- Confirm Signals On Bar Close — confirm filtered signals after the candle closes. Enabled by default.
- Use EMA Trend Filter — check price position relative to the EMA. Enabled by default.
- EMA Length — EMA calculation period. Default: 50.
- Use ADX Strength Filter — check trend strength using ADX. Enabled by default.
- ADX Length — ADX calculation period. Default: 14.
- Minimum ADX — minimum ADX value required to pass the filter. Default: 15.
- Use Candle Confirmation — require a bullish candle for LONG and a bearish candle for SHORT. Disabled by default.
- Use Cooldown Between Signals — limit how often filtered signals can occur. Enabled by default.
- Cooldown Bars — minimum pause between signals. The bar distance must exceed this value. Default: 1, which skips the next bar after a filtered signal.
Visual Settings
- PSAR Point Width — PSAR dot size, from 1 to 4. Default: 2.
- Highlight Start Points — mark raw direction changes with large circles. Enabled by default.
- Highlight Trend State — show colored shading between PSAR and the candle’s average price, OHLC4. Enabled by default.
- Show EMA Filter — display the EMA line when the EMA filter is enabled. Enabled by default.
- Bullish Color — bullish state color. Default: turquoise.
- Bearish Color — bearish state color. Default: red.
- EMA Color — EMA line color. Default: gray.
- State Fill Opacity — shading opacity, from 0 to 255. Higher values make the shading more visible. Default: 31.
- Start Point Radius — large marker radius, from 3 to 14 pixels at 96 DPI. Default: 7. The size adjusts to the screen scaling.
Alerts
- Enable Raw Direction Change Alerts — terminal alerts for raw PSAR direction changes, without checking the filters. Disabled by default.
- Enable Filtered Long/Short Alerts — terminal alerts for LONG and SHORT signals that meet all enabled conditions. Enabled by default.
Important Notes
On an open candle, PSAR dots, shading, and raw direction markers may change as the price moves. The candle-close confirmation setting applies to filtered signals.
Sideways markets may produce frequent direction changes. EMA, ADX, and other conditions help filter signals, but they cannot remove all false signals.
PSAR Strategy does not open trades or place Stop Loss or Take Profit orders. It is an analysis tool designed to support your trading approach. Signals do not guarantee profit. Entry rules, exit rules, position size, and risk remain your responsibility.