Euro USD Trade Plan Assistant

EUR/USD Trade Plan Assistant

Manual EUR/USD entry and risk-planning indicator for MetaTrader 5. It displays confirmed trade plans with entry, stop, target, position volume, time limit and combined account risk in a clear chart interface.

Product description

EUR/USD Trade Plan Assistant is designed for traders who want structured EUR/USD trade plans without automatic order execution.

The indicator continuously evaluates EUR/USD and can display up to three independent trade plans based on different market perspectives and time horizons. Each plan is handled separately and may generate a long or short opportunity.

When an entry is confirmed, the dashboard displays:

· Trade direction

· Confirmed entry price

· Stop-loss level

· Main target

· Risk-adjusted trading volume

· Individual plan risk

· Time limit for the trade plan

Long and short plans can exist at the same time when their respective conditions are met. The combined planned risk of all active plans is displayed at the top of the dashboard.

The indicator does not open, modify or close orders.

Main features

· Developed specifically for EUR/USD

· Up to three independent trade plans

· Separate M15, H4 and M30 plan displays

· Long and short trade plans

· Confirmed entry, stop and target levels directly on the chart

· Automatic position-volume calculation based on current account equity, the selected risk profile and broker symbol specifications

· Four predefined risk profiles plus a manual setting

· Individual risk calculation for every active plan

· Combined planned account risk shown in account currency and percent

· Clearly defined time limit for every trade plan

· Clear visual distinction between long and short plans

· Configurable historical trade-plan display

· Light and dark chart themes

· Terminal and mobile push notifications

· Manual execution only

Independent trade plans

The three plan sections operate independently.

A trade plan becomes active only when its respective confirmation requirements are met. Therefore, the dashboard may show no active plan, one active plan or several active plans at the same time.

Different plans may point in the same direction or in opposite directions. This is not a display error. Each plan represents a separate market assessment with its own entry, stop, target, volume and risk.

Whether long and short positions can be held simultaneously depends on the hedging or netting model of the trading account. The indicator displays its trade plans independently of the account model.

The user remains responsible for deciding whether to execute one, several or none of the displayed plans.

Active trading times

New trade plans are confirmed only during internally defined active trading hours intended for manual trading.

An already active plan may remain active or reach its stop, target or time limit outside this entry period. The internally defined entry schedule cannot be changed by the user.

Non-repainting confirmed signals

Once an entry has been confirmed and displayed, it is not moved to another candle, removed retrospectively or redrawn to improve the historical appearance.

A temporary entry-confirmation state is not yet an active trade plan. The dashboard clearly indicates whether a plan is awaiting final confirmation or has become active.

Completed historical plans remain available according to the selected display mode.

Risk management

EUR/USD Trade Plan Assistant calculates a risk-based trading volume for every confirmed trade plan. The calculation considers current account equity, the selected risk profile and the volume increments permitted by the broker.

The M15 plan uses the main profile value. The H4 and M30 plans each use half of that value.

The available profiles are:

· Conservative: M15 0.75%, H4/M30 0.375%

· Balanced: M15 1.00%, H4/M30 0.50%

· Standard: M15 1.50%, H4/M30 0.75%

· Aggressive: M15 2.00%, H4/M30 1.00%

· Manual Risk: User-defined M15 risk; H4/M30 use half of the selected value

Standard is the default profile.

The displayed total planned risk is the combined initial risk of all currently active plans. Actual trading results can differ due to spread, commission, swap, slippage and execution.

How to use

  1. Attach the indicator to an EUR/USD chart.
  2. Select the preferred risk profile and display settings.
  3. Wait until one of the plan sections shows "TRADE PLAN ACTIVE".
  4. Review the displayed direction, entry, stop, target, volume, plan risk and time limit.
  5. Decide whether the plan is suitable for your own account and current market conditions.
  6. Place and manage any order manually with your broker.

Only one indicator instance is required on the selected EUR/USD chart. The visible chart timeframe can be changed without attaching additional copies of the indicator.

Input parameters

Risk and account

Risk profile: Selects Conservative, Balanced, Standard, Aggressive or Manual Risk.

Manual M15 risk (%): Used only when Manual Risk is selected. It defines the risk percentage for the M15 plan. The H4 and M30 plans automatically use half of the entered value.

Display

Show chart objects: Shows or hides entry, stop, target and completed-plan objects on the chart.

Show information panel: Shows or hides the information dashboard.

Chart theme: Selects the Light or Dark visual theme.

Completed plan display: Controls how completed historical plans remain visible:

· Full color

· Neutral gray

· Markers only

· Hidden

Alerts

Alert when entry is confirmed: Generates a notification when a new trade plan becomes active.

Alert when a plan is completed: Generates an optional notification when an active plan reaches its stop, target or time limit.

Terminal pop-up alert: Enables MetaTrader terminal notifications.

Mobile push notification: Enables MetaTrader mobile push notifications. Push notifications must first be configured in the terminal settings.

Important information

· This product is an indicator and manual decision-support tool, not an Expert Advisor.

· It does not place, modify or close orders.

· It is designed and calibrated specifically for EUR/USD. Other symbols are not part of the intended use.

· The displayed M15, H4 and M30 plans are independent. Opposite trade directions may therefore appear simultaneously.

· Whether opposite positions can be held simultaneously depends on the broker and the hedging or netting model of the trading account.

· A confirmed trade plan is not a guarantee that the displayed target will be reached.

· Reaching the displayed stop, target or time limit completes only the indicator's internal trade plan. An actual broker position is not closed or modified automatically.

· Stops, targets and time limits are guidance for manual execution. The indicator does not monitor or control the user's actual broker position.

· The displayed volume is calculated from the account and symbol information available in MetaTrader.

· Volume is rounded down to the broker's permitted volume step. A plan may be unavailable when the broker's minimum volume would exceed the selected risk.

· Broker price feeds, spreads, commissions, swaps, contract sizes, minimum volumes and execution conditions can differ. Displayed prices and calculated volumes may therefore vary between brokers.

· Higher risk profiles increase both potential gains and potential drawdown. They do not improve signal quality.

· Multiple simultaneous plans increase total account exposure. Always review the total planned risk before placing an order.

· Trade plans can produce losses, consecutive losses and extended periods without a signal.

· Historical chart examples and Strategy Tester screenshots illustrate product operation only. They do not represent guaranteed or expected future results.

· Always verify the displayed volume and price levels before placing a manual order.


EUR/USD Trade Plan Assistant provides structured entry and risk information. The final trading decision, order execution and position management always remain with the user.


Produits recommandés
L'indicateur construit les cotations actuelles, qui peuvent être comparées aux cotations historiques et, sur cette base, faire une prévision de l'évolution des prix. L'indicateur dispose d'un champ de texte pour une navigation rapide jusqu'à la date souhaitée. Option : Symbole - sélection du symbole que l'indicateur affichera ; SymbolPeriod - sélection de la période à partir de laquelle l'indicateur prendra des données ; IndicatorColor - couleur de l'indicateur ; HorisontalShift - décalage
Here   our more valuable tools SMC Trend Trading   ,  Easy SMC Trading  ,  Institutional SMC Architect Volume Analysis Tools  ,  Volume flow Profile  ,  Market volume profile  , FVG with Volume  , Liquidity Heatmap Profile  ,  Volume Spread Analysis The Trading Guide MT5 Indicator is a powerful psychological trading assistant designed to keep traders disciplined, focused, and emotionally balanced. This innovative indicator displays real-time motivational messages, trading rules, and analysis
FREE
BoxChart MT5
Evgeny Shevtsov
5 (7)
The market is unfair if only because 10% of participants manage 90% of funds. An ordinary trader has slim changes to stand against these "vultures". This problem can be solved. You just need to be among these 10%, learn to predict their intentions and move with them. Volume is the only preemptive factor that faultlessly works on any timeframe and symbol. First, the volume appears and is accumulated, and only then the price moves. The price moves from one volume to another. Areas of volume accumu
[b]Titan Pro V7 Institutional Dashboard[/b] is an advanced quantitative HUD terminal engineered for MetaTrader 5, designed for institutional market analysis, quantitative prop-firm verification, and disciplined intraday execution. Unlike conventional single-formula indicators that suffer from lag and market regime shifts, Titan Pro V7 synthesizes a multi-strategy quantitative consensus model combining Trend Momentum, Volatility Breakout, Intraday VWAP, and Smart Money Concepts (SMC) into a sin
Market Profile Heat indicator  — is a classic Market Profile implementation that can show the price density over time, outlining the most important price levels, value area, and control value of a given trading session. This indicator can be attached to timeframes between M1 and D1 and will show the Market Profile for daily, weekly, monthly, or even intraday sessions. Lower timeframes offer higher precision. Higher timeframes are recommended for better visibility. It is also possible to use a fr
Volume Profile Sidebar dessine sur le côté du graphique un histogramme horizontal du volume par prix et marque le Point of Control (POC) et la Value Area. Fonctions principales Trois modes de plage : zone visible, N dernières barres, ou jour / session en cours. Ligne du POC, lignes de la Value Area (70 % par défaut) et lignes extérieures dans des couleurs distinctes. Lignes et étiquettes de prix optionnelles pour le POC, la Value Area High (VAH) et la Value Area Low (VAL). Le volume de chaque ba
FREE
Buyer Seller Arrows – Tradez en toute confiance ! Découvrez un outil révolutionnaire pour l’analyse visuelle de la force des acheteurs et des vendeurs sur tous les horizons temporels – de M1 à MN1. Cet indicateur vous offre une vue instantanée de la dynamique du marché grâce à des pourcentages et des flèches codés par couleur. Fonctions principales : Flèches vertes vers le haut = domination des acheteurs Flèches rouges vers le bas = domination des vendeurs Pourcentage de force pour chaque
RAD CRITICAL LEVES RAD indicator tracks “Relevant Volume” in real time, identifying accumulation and distribution processes, projecting them in the chart as SUPPORT or RESISTANCE zones. Natural   support   and resistance levels are generated by Volume Accumulation and Distribution processes. As these processes evolve, levels at which the relevant volume in the market place is positioned, become difficult areas to cross upwards or downwards. By using this information, traders can identify very s
TradeAQ
Guo Sheng Zhao
LuoMo Volume & Price Structure 8.98 A multi-function chart indicator for   MetaTrader 4 and MetaTrader 5 , designed to display key volume, volatility, sentiment, and price-structure information directly on the main chart. Main Features Volume and price-based Support & Resistance Volume spike and exhaustion signals ATR volatility expansion alerts Volume Profile with HVN and LVN Bullish and bearish sentiment distribution Developing or fixed POC VAH and VAL levels Supply and Demand zones Volume-wei
Volume Bubble Pro
Alexander Henzel
5 (1)
Volume Bubble Pro est un outil de visualisation avancé pour MetaTrader 5 qui affiche le volume de transaction directement sur le graphique des prix. Au lieu de s'appuyer sur des histogrammes séparés en bas de l'écran, cet indicateur montre l'intensité du volume via des cercles dynamiques (bulles) directement sur chaque bougie. Pourquoi Volume Bubble Pro ? Les indicateurs de volume standard ne montrent que des chiffres absolus, manquant souvent de contexte. Volume Bubble Pro compare statistiqueme
The Sessions and Bar Time indicator is a professional utility tool designed to enhance your trading awareness and timing precision on any chart. It combines two key features every trader needs — market session visualization and real-time bar countdown — in one clean, efficient display. Key Features: Candle Countdown Timer – Shows the remaining time before the current candle closes, helping you anticipate new bar formations. Market Session Display – Automatically highlights the four main trading
FREE
Volume Profil MT5
Vincent Jose Proenca
Volume Profile Rectangle Résumé Indicateur interactif de profil de volume qui affiche la répartition horizontale du volume échangé à chaque niveau de prix dans une zone sélectionnée. Il crée automatiquement un rectangle déplaçable et affiche des barres colorées représentant le volume haussier et baissier. Fonctionnalités : Affiche le volume horizontal : Visualise la répartition du volume à chaque niveau de prix sous forme de barres horizontales Analyse haussière/baissière : Colore les barres en
VOLUME PROFILE SAF-XII Analyse Market Profile Professionnelle pour MT5 (L'indicateur idéal pour le trading de type Grid) QU'EST-CE QUE LE VOLUME PROFILE ? Le Volume Profile est un outil institutionnel qui affiche l'activité de trading à des niveaux de prix spécifiques, contrairement aux indicateurs de volume classiques qui montrent le volume en fonction du temps. Il révèle OÙ les transactions ont eu lieu, aidant ainsi à identifier : ZONES DE VALEUR (VAH/VAL) – Niveaux de prix où la majorité des
Profil de volume à plage fixe automatique avec alertes pour MT5 Cet indicateur montre où le prix a passé le plus de temps, mettant en évidence les niveaux importants qui peuvent être utilisés dans le trading. et peut montrer la densité des prix au fil du temps, décrivant les niveaux de prix les plus importants, la zone de valeur et la valeur de contrôle d'une séance de négociation donnée. Cet indicateur peut être attaché à des délais entre M1 et D1 et affichera le profil du marché pour des se
Was: $249  Now: $99   Market Profile defines a number of day types that can help the trader to determine market behaviour. A key feature is the Value Area, representing the range of price action where 70% of trading took place. Understanding the Value Area can give traders valuable insight into market direction and establish the higher odds trade. It is an excellent addition to any system you may be using. Inspired by Jim Dalton’s book “Mind Over Markets”, this indicator is designed to suit the
Dynamic Volume Profile MT5
Cesar Sebastian Rosales Ibarra
Box Volume Profile Box Volume Profile dessine un histogramme de volume à l'intérieur de tout rectangle que vous placez sur le graphique. Choisissez une fenêtre temporelle et une plage de prix, et l'indicateur montre combien de volume a été échangé à chaque niveau de prix dans cette zone. Il trace également le Point of Control (POC) et les limites de la Value Area (VAH et VAL). Comment utiliser Appuyez sur la touche de raccourci de dessin (la lettre V par défaut) et faites glisser un rectangle n
Supply and Demand Monster
Tsog Erdene Borjigon Enkhkhudulmur
Supply and demand zones are at the heart of   supply and demand trading . These zones are areas that show  liquidity at a specific price.  The supply zone is also called the distribution zone, while the demand zone is called the accumulation zone.   Our indicator automatically draw supply and demand zones in Metatrader 5. It give opportunity to understand trading zone and avoiding risk.
KD HTF Candles
Dien Du Khanh Duong
KD HTF Candles projects transparent higher-timeframe candle bodies and wicks (e.g. M15/H1) directly onto your lower-timeframe chart, allowing you to view higher-timeframe candlestick patterns while trading a lower timeframe. Reviewing a higher-timeframe candle typically requires switching charts, which can interrupt focus on the execution timeframe. This tool displays the higher-timeframe candle directly on the lower-timeframe chart. Key Features Transparent HTF Overlay: Semi-transparent higher-
FREE
Blahtech Supply Demand MT5
Blahtech Limited
4.57 (14)
Was: $299  Now: $99  Supply Demand uses previous price action to identify potential imbalances between buyers and sellers. The key is to identify the better odds zones, not just the untouched ones. Blahtech Supply Demand indicator delivers functionality previously unavailable on any trading platform. This 4-in-1 indicator not only highlights the higher probability zones using a multi-criteria strength engine, but also combines it with multi-timeframe trend analysis, previously confirmed swings a
Here   our more valuable tools SMC Trend Trading   ,  Easy SMC Trading  ,  Institutional SMC Architect Volume Analysis Tools  ,  Volume flow Profile  ,  Market volume profile  , FVG with Volume  , Liquidity Heatmap Profile  ,  Volume Spread Analysis The    Liquidity Heatmap   is a sophisticated institutional trading tool designed to reveal where over-leveraged traders are trapped. By calculating estimated liquidation levels based on volume spikes and leverage, this indicator draws a dynamic "h
Daily gold recaps and new signals on my channel: https://www.mql5.com/en/channels/kizami-gold Launch price: $39. The price goes up by $10 after every 10 copies sold. Buyers get the SADAME Trade Assistant for free (one-click orders, automatic close on the opposite signal). Just send me a message after purchase. SADAME - Gold Signals 83.4% HIT RATE on XAUUSD M1. 561 signals tested. Each signal runs +90 pips on average at its peak. Best single BUY: +462 pips. Reversal and breakout signals, plus li
Slippage Analized
Nestor Alejandro Chiariello
Analyse de glissement conçue pour le trading de haute précision et l'ensemble du marché Il fonctionne à la fois sur les comptes réels et de démonstration et vous permet d'analyser toutes vos positions avec prise de profit et stop loss, afin que vous puissiez analyser le glissement de votre courtier. Qu'est-ce que le slippage dans le commerce ? Le glissement ou glissement est la différence de prix qui peut survenir entre le moment où un ordre commercial est passé et son exécution réelle sur le
FREE
Here   our more valuable tools SMC Trend Trading   ,  Easy SMC Trading  ,  Institutional SMC Architect Volume Analysis Tools  ,  Volume flow Profile  ,  Market volume profile  , FVG with Volume  , Liquidity Heatmap Profile  ,  Volume Spread Analysis Short Description: Stop overloading your charts with dozens of indicators.   Bollinger Fibo  Pro   is a sophisticated, all-in-one trading system for MetaTrader 5 that merges two legendary concepts into a single, powerful tool. It enhances standard
Tape Hunter
Thalles Nascimento De Carvalho
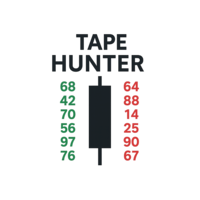
Tape Hunter – Votre radar Effort vs Résultat sur MT5 Tape Hunter est l’indicateur ultime pour les traders souhaitant voir le véritable jeu des prix sur MetaTrader 5. Il affiche de manière claire et intuitive les volumes agressifs d’achat et de vente basés sur le POC (Point of Control), vous permettant de visualiser l’effort du marché et le résultat réel de chaque chandelier. ️ Pourquoi est-ce important ? Tout volume ne fait pas bouger le prix ! Tape Hunter met en évidence si l’effort (vo
Based on the trading model/strategy/system of gold double-position hedging and arbitrage launched by Goodtrade Brokers, problems encountered in daily operations: 1. Account B immediately places an order immediately following account A. 2: After account A places an order, account B will automatically copy the stop loss and take profit. 3: Account A closes the position of Account B and closes the position at the same time. 4: When account B closes the position, account A also closes the position.
VMS Oscillator
Vincent Jose Proenca
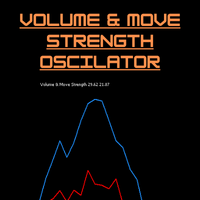
Volume & Move Strength (VMS) Indicator for MT5 The VMS Indicator displays the relationship between trading volume and price movement strength, helping traders assess how well market activity supports price action. How It Works: Measures tick volume as trading activity. Calculates move strength using a normalized True Range (%). Both values can be smoothed (default: 5) and optionally normalized (0–100) for consistency across markets. Plots two lines in a separate window: Blue (Volume) – trading a
FREE
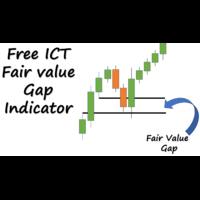
An ICT fair value gap is a trading concept that identifies market imbalances based on a three-candle sequence. The middle candle has a large body while the adjacent candles have upper and lower wicks that do not overlap with the middle candle. This formation suggests that there is an imbalance where buying and selling powers are not equal. Settings Minimum size of FVG (pips) -> FVGs less than the indicated pips will be not be drawn Show touched FVGs Normal FVG color -> color of FVG that hasn't
FREE
GoldenX Entry MT5
VividMind Digital Solutions
5 (17)
GoldenX Entry est un indicateur MT5 doté d’un algorithme adaptatif Smart Entry Trend, d’un système de scoring des signaux, d’un détecteur de régime de marché et d’un filtre de volatilité. Chaque signal inclut un niveau d’entrée calculé, trois niveaux de Take-Profit (TP1, TP2, TP3) ainsi qu’un niveau de Stop-Loss. Il est construit sur plusieurs couches analytiques conçues pour s’adapter à différentes conditions de marché, combinant un système analytique multicouche avec un optimiseur intégré et u
Les acheteurs de ce produit ont également acheté
Trend Sniper X
Sarvarbek Abduvoxobov
4.87 (46)
Trend Sniper X est un indicateur de suivi de tendance multi-unités de temps pour MetaTrader 5 qui aide les traders à identifier la direction de la tendance et les points d'inversion potentiels avec clarté et précision. pour MT4: https://www.mql5.com/en/market/product/193245 Informations sur le prix : Le prix actuel est un prix promotionnel et est susceptible de changer lors des prochaines mises à jour et nouvelles fonctionnalités. Offre bonus : Pour obtenir GRATUITEMENT l'Auto-Trade Assistant E
Entry Points Pro vous montre où entrer, où placer le stop et avec quel lot trader — avant que vous ne passiez l'ordre. PRIX Actuellement 199 USD : 4 exemplaires à ce prix, ensuite 249 USD. Le prix final est de 349 USD. Je gagne ma vie en tradant sur les marchés, et je le montre, donc je n'ai pas besoin de vendre cet indicateur à tout le monde. C'est un outil pour les traders qui réfléchissent par eux-mêmes, pas un bouton magique. Pas de cassure, pas de trade. Une flèche grise est un signal annu
Gann Made Easy   est un système de trading Forex professionnel et facile à utiliser qui est basé sur les meilleurs principes de trading en utilisant la théorie de mr. WD Gann. L'indicateur fournit des signaux d'ACHAT et de VENTE précis, y compris les niveaux Stop Loss et Take Profit. Vous pouvez échanger même en déplacement en utilisant les notifications PUSH. VEUILLEZ ME CONTACTER APRÈS L'ACHAT POUR RECEVOIR GRATUITEMENT DES INSTRUCTIONS DE TRADING ET D'EXCELLENTS INDICATEURS SUPPLÉMENTAIRES! V
Ultra Indicator
Ihor Otkydach
5 (1)
ULTRA est un indicateur technique « tout-en-un » : il analyse le marché de manière autonome, génère des signaux de trading, affiche les niveaux permettant de définir des ordres stop-loss et suggère le moment opportun pour clôturer les positions afin de sécuriser les bénéfices ou de minimiser les pertes. En d'autres termes, peu importe que vous ne sachiez pas analyser le marché, déterminer les niveaux (où placer votre stop-loss) ou que vous ayez du mal à gérer votre capital. ULTRA s'occupera de t
Boba Analysis Suite
Trade Ready Solutions LLC
5 (2)
Boba Analysis Suite Boba Analysis Suite est un indicateur d’analyse pour MetaTrader 5. Il réunit la structure du marché, les zones de prix pertinentes et le contexte général du marché dans une même vue graphique. Développé à partir de l’expérience pratique d’un trader et formateur en trading, il accompagne une démarche d’analyse structurée : évaluer la direction du marché, identifier les niveaux importants et analyser plusieurs unités de temps conjointement. Une analyse en contexte La significat
Power Candles MT5
Daniel Stein
4.58 (12)
Power Candles V3 - Indicateur de force à optimisation automatique Power Candles V3 transforme la force des devises et des instruments en un plan de trading exploitable sur chaque graphique auquel il est associé. Au lieu de se contenter de colorer les bougies, il effectue une optimisation automatique en temps réel en arrière-plan et vous fournit les meilleurs niveaux de Stop Loss, Take Profit et seuils de signal pour le symbole que vous avez sous les yeux. Un simple clic suffit pour l'adopter en
M1 Sniper MT5
Oleg Rodin
5 (7)
M1 SNIPER   est un système d'indicateurs de trading facile à utiliser. Il s'agit d'un indicateur à flèche conçu pour l'unité de temps M1. Cet indicateur peut être utilisé seul pour le scalping sur l'unité de temps M1 ou intégré à votre système de trading existant. Bien que conçu spécifiquement pour le trading sur l'unité de temps M1, ce système peut également être utilisé avec d'autres unités de temps. Initialement, j'avais conçu cette méthode pour le trading du XAUUSD et du BTCUSD. Cependant, j
Auto Optimized SpeedAngle est un système de vectorisation du momentum de niveau institutionnel qui élimine l'ajustement de courbe ( curve-fitting ) grâce à une optimisation continue par avancement ( Walk-Forward Optimization , WFO). Plutôt que de s'appuyer sur des entrées statiques qui se dégradent lorsque les régimes de marché changent, l'indicateur recalibre dynamiquement ses paramètres en utilisant une validation hors échantillon ( Out-of-Sample , OOS), garantissant ainsi que les signaux affi
Azimuth Pro
Ottaviano De Cicco
5 (7)
Azimuth Pro V2: Synthetic Fractal Structure and Confirmed Entries for MT5 Overview Azimuth Pro is a multi-level swing structure indicator by Merkava Labs . Four nested swing layers, swing-anchored VWAP, ABC pattern detection, three-timeframe structural filtering, and closed-bar confirmed entries — one chart, one workflow from micro-swings to macro-cycles. This is not a blind signal product. It is a structure-first workflow for traders who care about location, context, and timing. 1. What Change
Apex Patterns PRO Achetez l'indicateur - Obtenez GRATUITEMENT l'Expert Advisor basé sur celui-ci. Intelligence auto-optimisée des figures chartistes et des cassures Les scanners de figures traditionnels s'appuient sur des paramètres fixes, sous-performant souvent lorsque la volatilité et les structures du marché changent. Apex Patterns PRO est conçu pour s'adapter aux conditions changeantes du marché en combinant la reconnaissance des figures chartistes structurelles, le filtrage du momentum et
Meridian Pro
Ottaviano De Cicco
4 (3)
Meridian Pro 2.00: Professional Multi-Timeframe Trend Matrix for MT5 Meridian Pro 2.00 is a professional adaptive trend matrix for MetaTrader 5. It combines the original Meridian trend engine, a clean chart ribbon, closed-bar signal arrows, an 8-timeframe dashboard, Fuel momentum, weighted consensus, synthetic HTF processing and chart-native higher-timeframe context lines. The goal is simple: read current trend, multi-timeframe structure, strength, momentum and EA-ready state from one discipline
Divergence Bomber
Ihor Otkydach
4.89 (94)
Chaque acheteur de cet indicateur reçoit également gratuitement : L’outil exclusif « Bomber Utility », qui accompagne automatiquement chaque opération de trading, fixe les niveaux de Stop Loss et de Take Profit, et clôture les positions selon les règles de la stratégie Des fichiers de configuration (set files) pour adapter l’indicateur à différents actifs Des set files pour configurer le Bomber Utility selon différents modes : « Risque Minimum », « Risque Équilibré » et « Stratégie d’Attente »
Adaptive Price Action Engine Achetez un indicateur, obtenez l'EA gratuitement Analyse auto-optimisée des tendances et des figures de chandeliers Multi-Timeframe Les marchés évoluent constamment, et tous les modèles de Price Action n’ont pas la même valeur dans toutes les conditions de marché. Adaptive Price Action Engine a été conçu pour s’adapter aux changements du marché en combinant structure de tendance, analyse Multi-Timeframe, figures de chandeliers et optimisation statistique au sein d’un
Currency Strength Wizard   est un indicateur très puissant qui vous offre une solution tout-en-un pour un trading réussi. L'indicateur calcule la puissance de telle ou telle paire de devises en utilisant les données de toutes les devises sur plusieurs périodes. Ces données sont représentées sous la forme d'un indice de devise facile à utiliser et de lignes électriques de devise que vous pouvez utiliser pour voir la puissance de telle ou telle devise. Tout ce dont vous avez besoin est d'attacher
Naked Forex Tweezer Pro Indicator Tweezer Pro Indicator is a pattern recognition indicator for Forex, Stocks, Indices, Futures, Commodities and Cryptos. The standard Tweezer is a two bar pattern. Our enhanced version is a multi-bar pattern. We filter the patterns for you so that you only get the     best and most effective patterns   and ignore the noise. The Tweezer pattern is a simple and effective pattern to trade. The strategy that comes with the Tweezer is based on price action. The Twe
Advanced Supply Demand MT5
Bernhard Schweigert
4.53 (15)
La meilleure solution pour tout commerçant débutant ou expert ! Cet indicateur est un outil de trading unique, de haute qualité et abordable car nous avons intégré un certain nombre de fonctionnalités propriétaires et une nouvelle formule. Avec cette mise à jour, vous pourrez afficher des zones à double horaire. Vous pourrez non seulement afficher un TF plus élevé, mais afficher les deux, le graphique TF, PLUS le TF supérieur : AFFICHAGE DES ZONES NICHÉES. Tous les traders Supply Demand vont ado
Fx Levels Premium Indicator Support and Resistance are important concepts in trading. Fx Levels Premium was created to easily draw important levels of support and resistance for the active trader. The indicator will give you all important levels (support/resistance) to watch for a wide range of assets. Trading without these levels on your chart is like driving a car for a long journey without a roadmap. You would be confused and blind. Support and resistance levels should be used as guideline
Apollo SR Master est un indicateur de support/résistance doté de fonctionnalités spéciales qui simplifient et fiabilisent le trading basé sur les zones de support/résistance. Cet indicateur calcule ces zones en temps réel, sans aucun décalage, en détectant les sommets et les creux locaux des prix. Pour confirmer la nouvelle zone de support/résistance, il affiche un signal spécifique indiquant que cette zone peut être prise en compte et utilisée comme un véritable signal d'achat ou de vente. Dans
Neuro Poseidon MT5
Daria Rezueva
4.68 (53)
Neuro Poseidon is a new indicator by Daria Rezueva. It combines precise trading signals with adaptive TP/SL levels - creating best possible trades as a result! Message me and get  Neuro Poseidon Assistant  as a gift to automize your trading process! What makes it stand out? 1. Proven profitability on all assets and timeframes 2. Only confirmed BUY and SELL signals present on the chart 3. Adaptive TP & SL levels generated by the software for each trade 4. Easy to understand - suitable for al
SIO Oscillator : oscillateur auto-optimisé de déséquilibre de semi-variance Achetez l’indicateur et recevez GRATUITEMENT l’Expert Advisor (EA) basé sur celui-ci. La plupart des oscillateurs traitent tous les mouvements de prix de la même manière. SIO sépare la pression haussière de la pression baissière et mesure le déséquilibre entre les deux, montrant quel camp contrôle réellement le marché : les acheteurs ou les vendeurs. Lorsque le déséquilibre atteint un extrême, SIO génère un signal clair
TREND LINES PRO     Cet indicateur permet de comprendre les véritables changements de direction du marché. Il révèle les renversements de tendance et les points de retour des principaux acteurs. Tu vois     Lignes BOS     Détection des changements de tendance et des niveaux clés sur des unités de temps supérieures, sans paramètres complexes ni interférences inutiles. Les signaux restent affichés sur le graphique même après la fermeture de la bougie. VERSION MT 4    -     Révèle son potentiel max
ARICoins
Temirlan Kdyrkhan
ARICoin is a powerful trading companion designed to generate high-probability entry signals with dynamic TP/SL/DP levels based on volatility. Built-in performance tracking shows win/loss stats, PP1/PP2 hits, and success rates all updated live. Key Features: Buy/Sell signals with adaptive volatility bands Real-time TP/SL/DP levels based on ATR Built-in MA Filter with optional ATR/StdDev volatility Performance stats panel (Success, Profit/Loss, PP1/PP2) Alerts via popup, sound, push, or email Cust
Precision Spike Detector
Francisco Mandomo Simbine
5 (2)
Precision Spike Detector V3 – Institutional-Grade AI Trading System Attention: The price increases by US$50 for every 10 purchases.  Final price: US$599 Precision Spike Detector V3   is a   state-of-the-art, institutional-grade market analysis system   for   MetaTrader 5 , designed to detect   high-probability market movements   in synthetic indices such as   Boom, Crash, GainX, and PainX . After purchase, send me a private message to receive the optimized configuration files,  the installation
Murrey Math Classic
Sarvarbek Abduvoxobov
5 (2)
Murrey Math Classic Murrey Math Classic est un indicateur de trading professionnel et dynamique conçu pour prédire les mouvements de prix sur les marchés financiers mit avec une précision mathématique. Le système modernise la légendaire géométrie prix-temps, la transformant en un modèle mathématique hautement structuré adapté aux marchés financiers modernes. La logique fondamentale de Murrey Math est que les marchés financiers ne se déplacent pas de manière aléatoire ; ils évoluent selon un ryth
Astral Structure
Ottaviano De Cicco
Astral Structure Évaluez la configuration. Consultez le plan initial. Offre de lancement - $99. $149 après le lancement. Une configuration de structure soulève plusieurs questions : la vue plus large concorde-t-elle, où se situe la référence de stop et comment les objectifs sont-ils définis ? Astral Structure réunit ces questions dans un espace de travail pour les traders discrétionnaires qui fondent leurs décisions sur la structure du marché. Concentrez-vous sur la configuration pertinente. Exa
Gold Sniper Scalper Pro
Ich Khiem Nguyen
3.9 (10)
Gold Sniper Scalper Pro est un indicateur pour MetaTrader 5 conçu spécifiquement pour détecter les figures de fausse cassure (false breakout) sur XAUUSD. Il identifie la structure piège à 4 barres où le prix franchit la limite d'un range, attire les traders de cassure, puis inverse — confirmant que le mouvement était une fausse cassure. L'indicateur évalue chaque configuration selon 17 facteurs de qualité, la traite à travers un pipeline de confluence à 4 couches, la vérifie contre un moteur de
Superhero
Ihor Otkydach
5 (3)
L'indicateur SUPERHERO est un système de trading multidevises conçu selon un principe « tout compris ». Cet indicateur analyse le marché de manière autonome et fournit des signaux indiquant quand ouvrir et clôturer des positions. Il utilise des ordres Stop Loss et Take Profit. Le rapport R:R est de 1:1. Ce système peut envoyer des notifications push sur votre smartphone, ce qui vous permet de passer des ordres « où que vous soyez », sans avoir à rester devant un ordinateur. C'est la solution idé
RSI Thunder MT5
Muhammad Abdulrahman Omar Naima Allah Al-rais
RSI Thunder est un indicateur de trading intelligent conçu pour offrir des signaux précis et fiables. Les signaux apparaissent uniquement après la clôture de la bougie, éliminant tout repaint. Il combine RSI, EMA, ADX et ATR avec un filtre de tendance SMA40 pour trader dans la bonne direction. L’indicateur analyse les cinq dernières bougies et confirme les entrées uniquement lorsque la structure du marché est valide. Les signaux sont affichés sous forme de flèches claires avec un Take Profit au
AriFocus
Temirlan Kdyrkhan
AriFocus - Non-Repainting Buy/Sell Signals AriFocus - one clear signal. AriFocus marks buy and sell signals directly on the chart and suggests a stop-loss level for each one. Every signal is confirmed on bar close and never repaints. - Buy/sell arrows, confirmed on bar close - Suggested stop-loss level for every signal - Trend band and candle coloring to show direction at a glance - 10 ready-made presets, or your own settings (14 calculation methods) - Pop-up, push and email alerts with entr
ScalpPoint
Temirlan Kdyrkhan
ScalpPoint is a powerful trading companion designed to generate high-probability entry signals with dynamic TP/SL/DP levels based on volatility. Built-in performance tracking shows win/loss stats, PP1/PP2 hits, and success rates — all updated live. Key Features: Buy/Sell signals with adaptive volatility bands Real-time TP/SL/DP levels based on ATR Built-in MA Filter with optional ATR/StdDev volatility Performance stats panel (Success, Profit/Loss, PP1/PP2) Alerts via popup, sound, push, or emai
Plus de l'auteur
Gold Entry Zone Assistant Manual XAUUSD entry and risk-planning indicator for MetaTrader 5. It displays potential entry zones, confirmed entries, stop and target levels, suggested position volume and optional partial-profit guidance in a clean chart interface. Product description Gold Entry Zone Assistant is designed for traders who want structured XAUUSD trade plans without automatic order execution. The indicator monitors Gold for selected market situations and separates a developing opportuni
USD/JPY Signal Assistant English product description for version 1.00 An indicator for manual USD/JPY trading assistance in MetaTrader 5. It displays entry signals, current stop-loss levels, rule-based exit guidance and a risk-based suggested lot size. Stop adjustment and exit messages support the ongoing management of active signals. Product description USD/JPY Signal Assistant is designed for traders who want to follow clearly defined entry signals and their associated protective stops directl
FREE
Trend Quality Filter Market Structure Overview Trend Quality Filter Market Structure visualizes the currently identified market condition directly below the chart. Each evaluated candle is assigned to one of four phases according to a fixed market-structure logic. This provides traders with a clear additional classification of previous price behavior without generating buy or sell signals. What This Indicator Does The indicator analyzes the existing price structure and displays the resulti
FREE
Automatic trading with a fixed H4 signal timeframe USD/JPY Trading Expert is an Expert Advisor for MetaTrader 5 that combines different trading approaches in one system. It can automatically execute entries, stop-loss adjustments and exits. The system was developed and historically tested for USD/JPY. The signal timeframe is H4. This remains unchanged even if you display a different chart timeframe. New entries are scheduled between 08:00 and 20:00 broker time. Existing positions are also manage
Product Description Overview The AUDUSD Trading Expert is an automated Expert Advisor for MetaTrader 5, designed for trading AUD/USD. It can open and manage positions automatically. Choose between Long and Short or Long Only, set the total risk budget, and review the trading status, risk information, and open positions in the on-chart dashboard. Automated trading with clear controls The Expert Advisor handles trade execution and ongoing position management on AUD/USD. You choose the trading mode
Filtrer:
Aucun avis
Répondre à l'avis