 MetaTrader 5
 Experts
 Indicateurs
 Bibliothèque
 Utilitaires
 Widgets
 Règles
Regardez les tutoriels vidéo de Market sur YouTube
Comment acheter un robot de trading ou un indicateur
Exécutez votre EA sur
hébergement virtuel
hébergement virtuel
Test un indicateur/robot de trading avant d'acheter
Vous voulez gagner de l'argent sur Market ?
Comment présenter un produit pour qu'il se vende bien
Nouveaux Expert Advisors et indicateurs pour MetaTrader 5 - 17
 Utilisez des robots de trading et des indicateurs pour rendre le trading de forex plus rentable. Les robots de trading vous permettent d'automatiser l'ouverture et la clôture des transactions, tandis que les indicateurs vous aident à prédire le comportement du marché avec plus de précision. La page présente le catalogue des applications MetaTrader 5.
# Overnight Gap Risk - The risk stops cannot cover
*Category: Volatility | Difficulty: intermediate | Window: separate window below the chart | Markets: Stocks | Suggested timeframes: H1, H4, D1*
## Short description
> Splits each bar change into gap and intra-bar movement, and reports the share of risk attributable to gaps, the part no stop can protect against.
### Overview
The risk of a position held past the close is not the same as that of the same position closed intraday, and the dif

# Volatility Breakout Projection - Levels projected from the open
*Category: Volatility | Difficulty: beginner | Window: chart window (overlaid on price) | Markets: Universal (Forex, indices, commodities, crypto, stocks) | Suggested timeframes: M5, M15, M30, H1*
## Short description
> Anchors a reference to each session open and projects two pairs of levels computed as fractions of the average daily range. Levels stay fixed for the whole session.
### Overview
If an instrument covers on ave

# Compression Expansion Detector - Squeeze and release
*Category: Volatility | Difficulty: intermediate | Window: separate window below the chart | Markets: Universal (Forex, indices, commodities, crypto, stocks) | Suggested timeframes: M15, M30, H1, H4, D1*
## Short description
> Measures how far short term volatility has narrowed relative to the reference, counts how many bars the compression has lasted and highlights the bars following the release.
### Overview
Volatility is not stable:

# Intraday Volatility Seasonality - Hourly volatility profile
*Category: Volatility | Difficulty: intermediate | Window: separate window below the chart | Markets: Universal (Forex, indices, commodities, crypto, stocks) | Suggested timeframes: M5, M15, M30, H1*
## Short description
> Builds the instrument average hourly volatility profile and compares it with the actual range of the current bar. It separates normally quiet hours from genuine anomalies.
### Overview
Intraday volatility is n

# Downside Upside Vol Ratio - Risk asymmetry
*Category: Volatility | Difficulty: intermediate | Window: separate window below the chart | Markets: Universal (Forex, indices, commodities, crypto, stocks) | Suggested timeframes: H1, H4, D1*
## Short description
> Computes two separate semi-deviations, one on negative returns only and one on positive ones, and reports their proportion. It measures an asymmetry standard deviation conceals.
### Overview
Standard deviation treats an upward and a

# Volatility Shock Decay - Half-life of post-shock recovery
*Category: Volatility | Difficulty: advanced | Window: separate window below the chart | Markets: Universal (Forex, indices, commodities, crypto, stocks) | Suggested timeframes: H1, H4, D1*
## Short description
> Estimates the persistence coefficient of volatility and derives its half-life, how many bars a deviation from normal needs to halve. It also shows the size of the current shock.
### Overview
When volatility explodes, the

# Volume Price Efficiency - Lo spessore del mercato
*Categoria: Volume | Difficolta: intermedio | Finestra: finestra separata sotto il grafico | Mercati: Universale (Forex, indici, materie prime, crypto, azioni) | Timeframe consigliati: M5, M15, M30, H1, H4*
## Descrizione breve
> Misura quanto prezzo viene spostato da una unita di volume. Valori alti indicano un mercato sottile, in cui pochi ordini muovono molto; valori bassi indicano assorbimento.
### Panoramica
Quanto prezzo serve per a

# Cumulative Delta Proxy - Delta estimated from OHLC and volume
*Category: Volume | Difficulty: intermediate | Window: separate window below the chart | Markets: Universal (Forex, indices, commodities, crypto, stocks) | Suggested timeframes: M5, M15, M30, H1*
## Short description
> Estimates the buyer/seller imbalance from the close position within the range, weighted by volume, accumulating it per session in equivalent imbalance bars.
### Overview
True delta, the difference between volume

# Volume Climax Detector - The signature of absorption
*Category: Volume | Difficulty: intermediate | Window: chart window (overlaid on price) | Markets: Universal (Forex, indices, commodities, crypto, stocks) | Suggested timeframes: M15, M30, H1, H4, D1*
## Short description
> Recognises climax bars: exceptional volume, wide range but small body, that is price pushing far and coming back. It marks the bars with arrows on the chart.
### Overview
A volume spike alone means nothing: it can a

# Volume Weighted Range Profile - Rolling window profile
*Category: Volume | Difficulty: advanced | Window: chart window (overlaid on price) | Markets: Universal (Forex, indices, commodities, crypto, stocks) | Suggested timeframes: M15, M30, H1, H4, D1*
## Short description
> Builds a volume profile on a rolling window and extracts the point of control and value area. Unlike session profiles, it does not reshape itself during the day.
### Overview
The volume profile identifies the levels w

# Smart Money Flow Index - Opening versus rest of the day
*Category: Volume | Difficulty: intermediate | Window: separate window below the chart | Markets: Indices | Suggested timeframes: M5, M15, M30, H1*
## Short description
> Separates money flow between the first session hours and the rest of the day, showing their divergence. A time based convention, not a measure of who is trading.
### Overview
There is a long standing observation in equity market analysis: the first part of a sessio

# Volume Divergence Tracker - Price to volume correlation
*Category: Volume | Difficulty: intermediate | Window: separate window below the chart | Markets: Universal (Forex, indices, commodities, crypto, stocks) | Suggested timeframes: M15, M30, H1, H4, D1*
## Short description
> Measures the rolling correlation between the size of price moves and the change in volume. It recognises when movement loses the support of participation.
### Overview
In a healthy market price and volume move tog

# Effort Versus Result - Four bar categories
*Category: Volume | Difficulty: intermediate | Window: separate window below the chart | Markets: Universal (Forex, indices, commodities, crypto, stocks) | Suggested timeframes: M15, M30, H1, H4, D1*
## Short description
> Classifies every bar by comparing effort, the volume, with result, the range, both as standard scores. Four categories with distinct operational meaning follow.
### Overview
The effort versus result principle is one of the fou

# Accumulation Phase Scanner - Compressed range, high volume
*Category: Volume | Difficulty: intermediate | Window: separate window below the chart | Markets: Universal (Forex, indices, commodities, crypto, stocks) | Suggested timeframes: M15, M30, H1, H4, D1*
## Short description
> Recognises accumulation phases by combining three conditions: range compressed versus normal, volume above average and no net price progress.
### Overview
Accumulation has a recognisable signature: price stays

# Relative Volume Heatmap - Volume relative to its own hour
*Category: Volume | Difficulty: beginner | Window: separate window below the chart | Markets: Universal (Forex, indices, commodities, crypto, stocks) | Suggested timeframes: M5, M15, M30, H1*
## Short description
> Compares the bar volume with the historical average of the same hour band and colours it on four levels. It spots genuine participation anomalies, not clock effects.
### Overview
Absolute volume is nearly useless on int

# Liquidity Vacuum Finder - The empty corridors of price
*Category: Volume | Difficulty: advanced | Window: chart window (overlaid on price) | Markets: Universal (Forex, indices, commodities, crypto, stocks) | Suggested timeframes: M15, M30, H1, H4, D1*
## Short description
> Identifies price bands crossed on low volume, where nothing will slow price on its return. It draws the nearest vacuum above and below current price.
### Overview
The concept is the exact complement of the volume prof

# Percentile Rank Oscillator - Thresholds that are frequencies
*Category: Oscillators | Difficulty: beginner | Window: separate window below the chart | Markets: Universal (Forex, indices, commodities, crypto, stocks) | Suggested timeframes: M15, M30, H1, H4, D1*
## Short description
> An oscillator based on the percentile rank of price within its own recent distribution. A value of 90 always and everywhere means price is higher than ninety per cent of observations.
## Full description
###

# Adaptive Stochastic Bands - Soglie che si muovono
*Categoria: Oscillatori | Difficolta: intermedio | Finestra: finestra separata sotto il grafico | Mercati: Universale (Forex, indici, materie prime, crypto, azioni) | Timeframe consigliati: M15, M30, H1, H4, D1*
## Descrizione breve
> Oscillatore con bande calcolate sulla propria distribuzione recente invece che con soglie fisse. In un trend forte le bande si alzano e i falsi segnali contrari spariscono.
## Descrizione lunga
### Panoramic

# Mean Reversion Pressure - Deviation that actually pays
*Category: Oscillators | Difficulty: advanced | Window: separate window below the chart | Markets: Universal (Forex, indices, commodities, crypto, stocks) | Suggested timeframes: M30, H1, H4, D1*
## Short description
> Measures price deviation from the mean and weights it by the market actual tendency to revert, estimated on recent data. It signals only when the deviation is exploitable.
## Full description
### Overview
It is not en

# Cycle Phase Oscillator - Cycle position in degrees
*Category: Oscillators | Difficulty: advanced | Window: separate window below the chart | Markets: Universal (Forex, indices, commodities, crypto, stocks) | Suggested timeframes: M30, H1, H4, D1*
## Short description
> Expresses the market position in its own cycle as a phase angle from minus one hundred eighty to plus one hundred eighty degrees, with an amplitude measure indicating how reliable the phase is.
## Full description
### Over

# Dual Range Oscillator - Two ranges compared
*Category: Oscillators | Difficulty: beginner | Window: separate window below the chart | Markets: Universal (Forex, indices, commodities, crypto, stocks) | Suggested timeframes: M15, M30, H1, H4, D1*
## Short description
> Measures the price position within two ranges of very different length and shows their difference. It separates a move just started from one already mature on every scale.
## Full description
### Overview
Price can sit at t
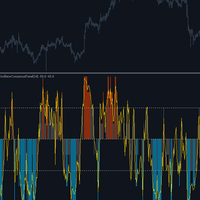
# Oscillator Consensus Panel - Four comparable oscillators
*Category: Oscillators | Difficulty: intermediate | Window: separate window below the chart | Markets: Universal (Forex, indices, commodities, crypto, stocks) | Suggested timeframes: M15, M30, H1, H4, D1*
## Short description
> Computes four oscillators built on different principles and makes them comparable by converting them into percentile ranks, before aggregating them into a consensus measure.
## Full description
### Overview

# Extreme Reading Frequency - How rare is this extreme
*Category: Oscillators | Difficulty: intermediate | Window: separate window below the chart | Markets: Universal (Forex, indices, commodities, crypto, stocks) | Suggested timeframes: M15, M30, H1, H4, D1*
## Short description
> Measures how frequently the oscillator has crossed the thresholds over recent bars. A rare extreme is informative, a frequent one is simply that market norm.
## Full description
### Overview
When an oscillator

# Volatility Scaled RSI - Strength separated from volatility
*Category: Oscillators | Difficulty: intermediate | Window: separate window below the chart | Markets: Universal (Forex, indices, commodities, crypto, stocks) | Suggested timeframes: M15, M30, H1, H4, D1*
## Short description
> A relative strength index where every change is normalised by the volatility of its own moment. It measures pure direction instead of a blend of direction and volatility.
## Full description
### Overview

# Overbought Duration Tracker - How long the extreme has lasted
*Category: Oscillators | Difficulty: intermediate | Window: separate window below the chart | Markets: Universal (Forex, indices, commodities, crypto, stocks) | Suggested timeframes: M15, M30, H1, H4, D1*
## Short description
> Measures how many bars the oscillator has spent in the extreme zone and compares it with the average duration of past stays. It avoids the error of selling on the first overbought touch.
## Full descript

# Reversal Probability Gauge - Historical frequency by analogy
*Category: Oscillators | Difficulty: advanced | Window: separate window below the chart | Markets: Universal (Forex, indices, commodities, crypto, stocks) | Suggested timeframes: M30, H1, H4, D1*
## Short description
> Searches history for bars with a state similar to the current one and counts in what percentage of those cases price then moved the opposite way. It is an observed frequency, not a forecast.
## Full description
#

Level Alert Utility is an essential workflow tool for MetaTrader 5 designed to eliminate constant screen fatigue. Effortlessly drag the interactive level line directly on your chart—the indicator instantly configures trigger rules and delivers real-time notifications via customizable sound repeats, popup alerts, mobile Push notifications, and email. Equipped with high-speed millisecond monitoring, gap and impulse protection, quick-action chart buttons, hotkey support, and state persistence acros

# Level Strength Ranker - Only the two levels that matter
*Category: Support and Resistance | Difficulty: intermediate | Window: chart window (overlaid on price) | Markets: Universal (Forex, indices, commodities, crypto, stocks) | Suggested timeframes: M30, H1, H4, D1*
## Short description
> Scores every level by number of touches, size of reactions and recency, drawing only the strongest one above and below price.
## Full description
### Overview
Not all levels are equal. A level touched

# Round Number Magnet - Do round numbers really matter?
*Category: Support and Resistance | Difficulty: beginner | Window: chart window (overlaid on price) | Markets: Universal (Forex, indices, commodities, crypto, stocks) | Suggested timeframes: M15, M30, H1, H4, D1*
## Short description
> Draws round levels with an automatically computed step and measures how much price actually reacts to them on this specific instrument.
## Full description
### Overview
Round numbers attract orders: st

# Break Retest Detector - The full sequence, not just the break
*Category: Support and Resistance | Difficulty: intermediate | Window: chart window (overlaid on price) | Markets: Universal (Forex, indices, commodities, crypto, stocks) | Suggested timeframes: M15, M30, H1, H4, D1*
## Short description
> Recognises the full sequence of break, return to the level and reaction. It signals only when all three conditions occur in the correct order.
## Full description
### Overview
Breaking a le

CyberZingFx Volume Plus MT5 CyberZingFx Volume Plus is now available for MetaTrader 5! CyberZingFx Volume Plus is an advanced volume and market reversal indicator for MT5 , designed to help traders identify potential swing highs, swing lows, and reversal areas. Originally developed for MetaTrader 4, CyberZingFx Volume Plus has been available to traders for several years and has received excellent feedback from its users. This MT5 version brings the same core trading concept to the MetaTrader 5

# Dynamic Pivot Zones - Pivots as zones, not lines
*Category: Support and Resistance | Difficulty: beginner | Window: chart window (overlaid on price) | Markets: Universal (Forex, indices, commodities, crypto, stocks) | Suggested timeframes: M5, M15, M30, H1*
## Short description
> Turns pivots into zones whose width depends on the previous period volatility. The levels stay fixed for the whole session, with no recalculation.
## Full description
### Overview
Classic pivots are infinitely

# Supply Demand Zone Mapper - Compressed base and decisive departure
*Category: Support and Resistance | Difficulty: intermediate | Window: chart window (overlaid on price) | Markets: Universal (Forex, indices, commodities, crypto, stocks) | Suggested timeframes: M15, M30, H1, H4, D1*
## Short description
> Recognises consolidation bases followed by a decisive move and draws them as zones, which remain until price crosses them fully.
## Full description
### Overview
A demand zone forms wh

# Untested Level Finder - The levels still intact
*Category: Support and Resistance | Difficulty: beginner | Window: chart window (overlaid on price) | Markets: Universal (Forex, indices, commodities, crypto, stocks) | Suggested timeframes: M15, M30, H1, H4, D1*
## Short description
> Draws only the swing levels price has never retested since they formed. A level stops being drawn the moment it is tested.
## Full description
### Overview
A level that has already rejected price three times

# Confluence Score Map - Where several references converge
*Category: Support and Resistance | Difficulty: advanced | Window: chart window (overlaid on price) | Markets: Universal (Forex, indices, commodities, crypto, stocks) | Suggested timeframes: M30, H1, H4, D1*
## Short description
> Computes four independent families of levels and draws only the price bands where at least the required minimum number of references converges.
## Full description
### Overview
A level where several inde

# False Breakout Filter - The failed break as a signal
*Category: Support and Resistance | Difficulty: intermediate | Window: chart window (overlaid on price) | Markets: Universal (Forex, indices, commodities, crypto, stocks) | Suggested timeframes: M15, M30, H1, H4, D1*
## Short description
> Watches every break for a fixed number of bars and classifies it only afterwards. A failed break produces an arrow the opposite way, because it is itself a signal.
## Full description
### Overview
E

# Range Boundary Tracker - Edges that do not follow price
*Category: Support and Resistance | Difficulty: intermediate | Window: chart window (overlaid on price) | Markets: Universal (Forex, indices, commodities, crypto, stocks) | Suggested timeframes: M15, M30, H1, H4, D1*
## Short description
> Recognises when the market enters a range, fixes its two extremes and holds them still while the range lasts, as a trader would draw them.
## Full description
### Overview
A channel that follows

# Level Decay Model - A level that wears out
*Category: Support and Resistance | Difficulty: advanced | Window: chart window (overlaid on price) | Markets: Universal (Forex, indices, commodities, crypto, stocks) | Suggested timeframes: M30, H1, H4, D1*
## Short description
> Assigns each level a strength that decays over time and with every test it undergoes. The level is abandoned once residual strength falls below the threshold.
## Full description
### Overview
A level does not have unl

Stop Watching Key Price Levels. Get Alerted. Horizontal Line Alert automatically monitors a price level and alerts you when price closes above, closes below, or touches the line . Go beyond a basic horizontal-line alert with candle confirmation, candle-size filtering, and price-action conditions . KEY FEATURES Close Above
Detect qualifying bullish candles closing above your horizontal level. Close Below
Detect qualifying bearish candles closing below your level. Close Above / Bel

TradePanel Pro - Manual Trading Panel with Grid, Trailing, and Targets
"Complete manual trading panel for MT5: grid, trailing stop, smart breakeven, daily targets and risk management in one click."
TradePanel Pro is a professional manual trading panel for MetaTrader 5, built for traders who want speed, organization and automatic position protection — without juggling multiple tools or complex setups.
Everything you need lives in a single panel: one-click buy/sell, point-based stops and target

Stop guessing where a pullback ends. Most traders can spot a trend. The hard part is the entry — buying too early into a falling knife, or chasing after the move has already gone. Fibonacci Trend Compass solves exactly that one problem, and it does it on autopilot. Three steps, fully automatic: It reads the trend. An adaptive ATR trend engine paints the chart green or red and tells you which side of the market you are allowed to trade. It maps the impulse leg. Confirmed swing highs and lows

Dispersion — Adaptive Market Dispersion Analysis System for MetaTrader 5
Dispersion is an Expert Advisor built on the statistical analysis of price deviations from an equilibrium state. Rather than simply following a trend or breakout, the system measures the "dispersion" of market movement within a sliding data window, evaluates signal decay speed, and identifies moments where the probability of a reversal or continuation is statistically justified.
How It Works
The core logic relies on con

️ ARMOR Adaptive Lot Sizing Hedging Recovery EA Smarter Recovery. Adaptive Position Sizing. Total Control. Meet ARMOR Adaptive Lot Sizing , an advanced MetaTrader 5 Expert Advisor engineered for traders who want a more flexible approach to hedging, recovery, position sizing, and risk management . Instead of relying on a single fixed recovery method, ARMOR gives traders the ability to configure how the recovery engine behaves — from adaptive lot progression and custom lot sequences to volatilit

# Candle Body Anatomy - Candle proportions in numbers
*Category: Pattern Recognition | Difficulty: beginner | Window: separate window below the chart | Markets: Universal (Forex, indices, commodities, crypto, stocks) | Suggested timeframes: M15, M30, H1, H4, D1*
## Short description
> Splits every candle into body and wicks as a percentage of the range and classifies it on explicit numeric thresholds instead of qualitative judgement.
## Full description
### Overview
Traditional candle nam

# Engulfing Quality Score - Not all engulfings are equal
*Category: Pattern Recognition | Difficulty: intermediate | Window: chart window (overlaid on price) | Markets: Universal (Forex, indices, commodities, crypto, stocks) | Suggested timeframes: M15, M30, H1, H4, D1*
## Short description
> Checks the engulfing pattern and scores it on four additional criteria, flagging only those exceeding the quality threshold.
## Full description
### Overview
The engulfing pattern is among the best k

# Inside Bar Breakout Map - Compression with ready levels
*Category: Pattern Recognition | Difficulty: beginner | Window: chart window (overlaid on price) | Markets: Universal (Forex, indices, commodities, crypto, stocks) | Suggested timeframes: M15, M30, H1, H4, D1*
## Short description
> Counts consecutive inside bars and draws the two breakout levels of the mother bar, holding them fixed while the pattern is active.
## Full description
### Overview
An inside bar, entirely contained wit

# Pin Bar Rejection Scanner - Rejection where it matters
*Category: Pattern Recognition | Difficulty: intermediate | Window: chart window (overlaid on price) | Markets: Universal (Forex, indices, commodities, crypto, stocks) | Suggested timeframes: M15, M30, H1, H4, D1*
## Short description
> Recognises bars with a dominant wick but flags them only when they are significant in absolute terms and occur at a recent extreme.
## Full description
### Overview
A bar with a very long wick tells

# Three Bar Structure Map - Geometry without thresholds
*Category: Pattern Recognition | Difficulty: beginner | Window: separate window below the chart | Markets: Universal (Forex, indices, commodities, crypto, stocks) | Suggested timeframes: M15, M30, H1, H4, D1*
## Short description
> Classifies every three bar group into four geometric configurations, using no arbitrary threshold: two bars either exceed each other or they do not.
## Full description
### Overview
Every group of three co
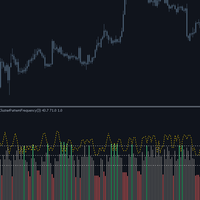
# Cluster Pattern Frequency - Eight sequences and their statistics
*Category: Pattern Recognition | Difficulty: advanced | Window: separate window below the chart | Markets: Universal (Forex, indices, commodities, crypto, stocks) | Suggested timeframes: M30, H1, H4, D1*
## Short description
> Encodes every three bar sequence into one of eight possible configurations and measures the historical frequency of it being followed by an upward move.
## Full description
### Overview
Every three b

# Momentum Thrust Pattern - Thrust, pause, resumption
*Category: Pattern Recognition | Difficulty: intermediate | Window: chart window (overlaid on price) | Markets: Universal (Forex, indices, commodities, crypto, stocks) | Suggested timeframes: M15, M30, H1, H4, D1*
## Short description
> Recognises the thrust, contained pause and resumption beyond the extreme sequence, signalling only once all three phases have completed.
## Full description
### Overview
Directional moves almost always

# Higher Timeframe Bias - The higher timeframe without deception
*Category: Multi Timeframe Hybrids | Difficulty: intermediate | Window: separate window below the chart | Markets: Universal (Forex, indices, commodities, crypto, stocks) | Suggested timeframes: M5, M15, M30, H1, H4*
## Short description
> Brings a higher timeframe direction onto the current chart using only already closed bars, avoiding the most insidious form of repaint.
## Full description
### Overview
Multi timeframe ind

【Gold MA Flow No.2 · Gold M5 · Live-Verified Edition】 One parameter set that fits every account — from small capital to full size. Why choose it? One parameter set, full-cycle backtesting : proven through COVID, the Russia-Ukraine conflict, Fed rate hikes and gold's historic bull run — not a "pretty curve" cherry-picked from the easy times. Multi-period MA flow + 5-layer trend confirmation : a whole family of moving averages shows you where the money flows — ride trends with conviction, bank ste

Quant Desk Pro An R-native trade manager for MetaTrader 5. It manages the trades you have already opened: it measures what each one is really risking, protects it, scales out of it on a plan you set, trails what is left, and stops the whole book when the day has gone far enough wrong. Read this first. Quant Desk Pro does not open trades and has no signal. And it ships in VIEW ONLY : it will not send a single order until you set I understand the risks to true in the inputs. Until you do
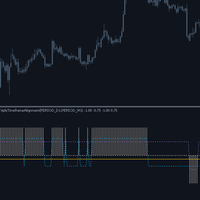
# Triple Timeframe Alignment - Three horizons, one score
*Category: Multi Timeframe Hybrids | Difficulty: intermediate | Window: separate window below the chart | Markets: Universal (Forex, indices, commodities, crypto, stocks) | Suggested timeframes: M5, M15, M30, H1, H4*
## Short description
> Checks whether current, middle and higher timeframes point the same way, showing both the overall score and each horizon direction.
## Full description
### Overview
Full alignment of the three tim

# HTF Level Projector - The levels everyone watches
*Category: Multi Timeframe Hybrids | Difficulty: beginner | Window: chart window (overlaid on price) | Markets: Universal (Forex, indices, commodities, crypto, stocks) | Suggested timeframes: M5, M15, M30, H1, H4*
## Short description
> Projects onto the current chart the high, low and close of the last complete higher period, updating only on period close.
## Full description
### Overview
Yesterday high and low are shared references, no

# Timeframe Divergence Monitor - When horizons disagree
*Category: Multi Timeframe Hybrids | Difficulty: intermediate | Window: separate window below the chart | Markets: Universal (Forex, indices, commodities, crypto, stocks) | Suggested timeframes: M5, M15, M30, H1, H4*
## Short description
> Measures the momentum disagreement between current and higher timeframes, highlighting phases where the two horizons move in opposite directions.
## Full description
### Overview
When the current t

# Volume Support Resistance Map - Supports and resistances drawn by volume
*Category: Experimental | Difficulty: intermediate | Window: chart window (overlaid on price) | Markets: Universal (Forex, indices, commodities, crypto, stocks) | Suggested timeframes: M15, M30, H1, H4, D1*
## Short description
> Horizontal bars drawn on the chart, long in proportion to the volume traded at each level: above price the selling volume marking resistances, below it the buying volume marking supports.
##

Here is the description translated and optimized for the MQL5 Market : Candle Timer Jason – Candle Countdown Indicator (MT5) Candle Timer Jason is a lightweight, high-performance utility developed for MetaTrader 5. It is designed for Forex, Stock, and Crypto traders who need to monitor the exact remaining time before the current candle closes. Knowing precisely how many minutes and seconds are left in a bar is essential for execution timing, helping you avoid premature entries or getting caught

GOLDEN CROSS V1.0 - Moving Average Crossover Indicator with Quality Score General Description The GOLDEN CROSS is an advanced technical indicator developed for MetaTrader 5 that combines moving average crossovers with a quality scoring system based on multiple technical filters. It is designed to identify high-probability entry points, offering traders interactive visual tools and comprehensive risk management features. Indicator Structure and Logic 1. Crossover System Fas

MA Flow No.2 See the Flow of Bulls & Bears at a Glance, and Keep the Rhythm of the Market in Your Hands
Tired of staring at dozens of moving averages until your eyes blur? Unsure when to enter, or where to place your stop? MA Flow No.2 upgrades the humble moving average into a complete trend-trading system. No more scattered lines on your chart — instead, a living "river of bulls and bears". Up to 100 moving averages roll together in real time. On every single bar, you can see at a glance w

Quant Key Levels, version 1.0. The reference levels a discretionary trader actually works from, on one chart and in one visual language. Eleven families, each on its own switch, and nothing on the chart that a level does not earn. What separates it from a pivot pack is not the number of families. It is that the things most level tools assume, this one measures. How far your broker's clock sits from UTC, measured out of your own terminal rather than typed into a box. Where an exchange actually op

【Gold MA Flow No.2 · Gold M3 · Live-Verified Edition】
One parameter set that fits every account — from small capital to full size.
Why choose it?
One parameter set, full-cycle backtesting: proven through COVID, the Russia-Ukraine conflict, Fed rate hikes and gold's historic bull run — not a "pretty curve" cherry-picked from the easy times. The results speak for themselves: starting from just $200, the 2019–2026 seven-and-a-half-year backtest returned $4618.74 net profit with a Recovery Facto

Robust_HEDGE EA: Grid Trading + Hedge Protection + Take Profit and Stop Loss
Robust_HEDGE: Grid EA with 4 modes (Buy/Sell/Both/Hedge), MA+RSI filters,
and risk management (TP, SL, trailing). Hedge Protection = perfect hedge.
Robust_HEDGE is designed to operate across multiple markets and instruments.
It works natively and effectively on:
- Mini Index (index contracts) and Mini Dollar (dollar futures).
- Forex: major pairs such as XAUUSD (gold) and EURUSD, as well as other
currencies a

SMC Pro Suite is the ultimate all-in-one tool designed specifically for institutional traders and Smart Money Concepts (SMC) enthusiasts. Forget about cluttering your chart with multiple overlapping and confusing indicators. SMC Pro Suite mathematically analyzes price action to draw real-time market structure, map key institutional zones, and issue highly accurate signals filtered by a sophisticated discount and premium algorithm. Whether you are a Scalper, Day Trader, or Swing Trader,

BjKeyLevels.mq5 is a key levels indicator (Bjorgum Key Levels, version 1.60) for MetaTrader 5, built on pivot logic based on higher price extremes.
Purpose and operating principle:
Key zone search — using pivots (swing high/low with leverage setting InpPivotLeft/Right = 7), it finds support and resistance levels. Each level is converted into a zone with a width dependent on the ATR (14) and a multiplier (InpAtrMultiplier = 0.5). Zone merging — close levels are merged into a single zone (displ

Pro_Multi_Timeframe_SR_Zones.mq5 — Description A multi-timeframe support/resistance (S/R) indicator for MetaTrader 5. The name is Pro_Multi_Timeframe_SR_Zones. It draws support and resistance price zones (rectangles) on the chart, found on 8 higher timeframes, with lines in the center of the zone, strength labels (hits), and control buttons. The file header states "Version 6.02 (Enhanced)," and #property version states 6.07.
What the indicator does Scans 8 higher timeframes: M5, M15, M30, H1,

General Overview This is a manual trading panel Expert Advisor for MetaTrader 5. It does not trade automatically based on signals; instead, it provides the trader with a convenient graphical interface for manual control, including opening market trades and pending orders, managing SL/TP, trailing stops, break-even settings, position monitoring, and statistics.
The panel consists of two windows:
Main Panel (212×372 px) — for entering and executing trades. Position Monitor (350×372 px) — for man

Account Stats Desk Account Stats Desk is a MetaTrader 5 chart indicator that visualizes closed-trade performance as an equity curve, account statistics, and a scrollable trade history table. It is an analytical display tool only. It does not open, modify, or close orders. Overview The indicator rebuilds a cumulative equity series from deal history available in the terminal, filtered by magic number and symbol when required. The layout places the equity graph on the left, live account figures on

Institutional Liquidity Panel Pro MT5
Overview Institutional Liquidity Panel Pro MT5 is an advanced, institutional-grade trading dashboard and execution assistant built specifically for traders utilizing Smart Money Concepts (SMC), ICT, and Order Flow dynamics.
Instead of relying on lagging retail indicators, this tool tracks real-time Buy-Side Liquidity (BSL), Sell-Side Liquidity (SSL), and Fair Value Gaps (FVG). Designed for high-precision manual and semi-automated execution, it provides in

SimpleTerminal — a professional manual trading panel for MetaTrader 5
SimpleTerminal transforms the terminal into a convenient trading control panel. All essential actions—market entry, position management, and profit protection—are performed in one click from a compact panel directly on the chart.
Quick market entry
One-click Buy/Sell market orders; Pending orders: Buy Stop, Sell Stop, Buy Limit, Sell Limit; Fixed lot or automatic volume calculation based on the risk percentage of the balan
Savez-vous pourquoi MetaTrader Market est le meilleur endroit pour vendre des stratégies de trading et des indicateurs techniques ? Pas besoin de publicité ou de protection logicielle, pas de problèmes de paiement. Tout est fourni dans le MetaTrader Market.

Vous manquez des opportunités de trading :
- Applications de trading gratuites
- Plus de 8 000 signaux à copier
- Actualités économiques pour explorer les marchés financiers
Inscription
Se connecter
Vous acceptez la politique du site Web et les conditions d'utilisation
Si vous n'avez pas de compte, veuillez vous inscrire