Regardez les tutoriels vidéo de Market sur YouTube
Comment acheter un robot de trading ou un indicateur
Exécutez votre EA sur
hébergement virtuel
hébergement virtuel
Test un indicateur/robot de trading avant d'acheter
Vous voulez gagner de l'argent sur Market ?
Comment présenter un produit pour qu'il se vende bien
Nouveaux indicateurs techniques pour MetaTrader 4

volatility level indicator is a volatility oscillator to see trend reversal points. price trends has reverese when volatility inreased . this indicator show trend reversal points volatility. mostly same level up and down volatility is reversal points. red colour shows up points of volatilty.and probably trend will down. blue colour oscillator shows deep point of price when increased volatiliyty. on pictures horizontal lines on oscillator has drawed by hand.to see the before level and compare now
L'indicateur RSI Pro Analyser est un outil puissant conçu pour les traders cherchant à prendre des décisions éclairées sur plusieurs unités de temps simultanément. Cet indicateur utilise le RSI pour fournir des signaux de surachat, de survente et de tendance , facilitant ainsi l'identification des opportunités d'entrée sur le marché. Son principal atout est sa facilité de lecture grâce à son code couleur clairs et distincts pour indiquer différentes conditions de marché. L'indicateur affiche le

You can visually backtest Elliot Wave Impulse to see how it behaved in the past!
Manual guide: Click here Starting price of $55 for the first 25 copies ( 17 left)! -- Next price is $99 .
This indicator is unstoppable when combined with our other indicator called Katana . After purchase, send us a message and you could get it for FREE as a BONUS! The Elliot Wave Impulse is a pattern identified in the Elliott Wave Theory, a form of technical analysis used to an

The PERFECT TREND HIT creates BUY and SELL perfect trend arrow signals based on ADX EMA AND RSI And all filters inbuilt with accurate trend entries. Furthermore, the indicator and template display the trend direction, strength, and trade recommendation for independent price charts. ROCK WITH THE TREND Moreover, it shows the final trade recommendation to BUY or SELL with all filters and displays that information as arrow signals and pop up in the chart. The indicator works well for new and

Avec cet outil de trading, vous pouvez analyser 15 marchés simultanément.
Présentation du nouvel indicateur de trading 2024 :
️ Tableau de bord multi-devises multi-périodes Double CCI.
Il y a au moins deux raisons pour lesquelles j'ai créé cet outil de trading :
Premièrement, j'en ai marre de n'observer qu'un seul marché. Deuxièmement, je ne veux pas perdre le moment d’entrée sur un autre marché.
C'est pourquoi je souhaite connaître en même temps les autres conditions du marché.
Po

Introduction
The Price Action, styled as the "Smart Money Concept" or "SMC," was introduced by Mr. David J. Crouch in 2000 and is one of the most modern technical styles in the financial world. In financial markets, Smart Money refers to capital controlled by major market players (central banks, funds, etc.), and these traders can accurately predict market trends and achieve the highest profits.
In the "Smart Money" style, various types of "order blocks" can be traded. This indicator
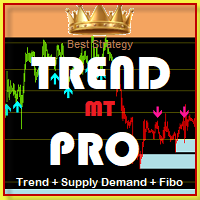
Please feel free to contact me if you need any further information.
Please let me know if you have any questions.
I hope the above is useful to you. MT Trend Pro: "Trade according to the trend and you will be a winner." There is Supply&Demand and Fibo to help set SL and TP.
TRADE: Forex
TIME FRAME: All Time Frame
SYMBOL PAIR: All Symbol
SETTINGS:
SIGNAL FOLLOW TREND: Input period (>1)
CANDLE MA FILTER TREND: Set MA to change the candle color and filter signals.
FIBO TREND:
Le Smart Volume Tracker est un indicateur conçu pour fournir un aperçu du sentiment du marché en présentant visuellement les données de volume acheteur et vendeur dans une fenêtre dédiée. Cet outil intuitif aide les traders à identifier rapidement où se concentre l'activité d'achat et de vente, leur permettant ainsi de prendre des décisions de trading plus éclairées.
Avec Smart Volume Tracker, vous pouvez facilement évaluer si le marché penche vers une tendance haussière ou baissière. Il mont

Titre : Guide de Structure BBMA - Guide de Structure BBMA
Description : Le Guide de Structure BBMA est un indicateur MQL4 spécialisé conçu pour aider les traders à comprendre plus facilement et efficacement l'évolution de la structure BBMA. BBMA, ou "Bollinger Bands Moving Average", est connu pour son slogan "Un Pas en Avant", soulignant l'importance de comprendre en profondeur la structure du marché.
Avec le Guide de Structure BBMA, vous pouvez rapidement identifier les motifs de base de l
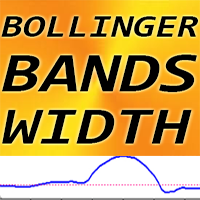
Forex Indicator Bollinger Bands Width for MT4, No Repaint. -BB Width indicator is applicable for using together with standard Bollinger Bands indicator. -This software is must have for every Bollinger Bands indicator fan, because their combination is very efficient to trade Breakouts -BB Width indicator shows the distance (span) between Bollinger Bands. HOW TO USE BB Width (See the example on the picture): 1) Find the lowest value of BB Width of the last 6 months and add 25% to this value
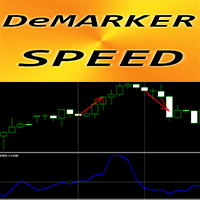
Forex Indicator " DeMarker Speed" for MT4 The calculation of this indicator is based on equations from physics. DeMarker Speed is the 1st derivative of DeMarker itself DeMarker oscillator curve indicates the current price position relative to previous highs and lows during the indicator calculation period
DeMarker Speed is good for scalping entries when standard DeMarker oscillator is in OverSold/OverBought zone (as on pictures) DeMarker Speed indicator shows how fast DeMarker itself
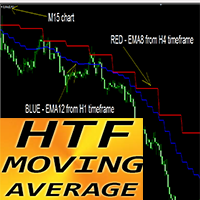
Forex Indicator HTF MOVING AVERAGE for MT4 Upgrade your trading methods with the professional HTF MA Indicator for MT4. H TF means - H igher Time Frame This indicator is excellent for Trend Traders with Price Action entries. HTF MA Indicator allows you to attach Moving Average from Higher time frame to your current chart. Indicator shows the trend from higher time frame --> this is always profitable method. HTF MA Indicator gives opportunity to get big profit with low risk. How to use
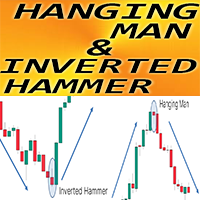
Forex Indicator " Hanging Man and Inverted Hammer pattern" for MT4 Indicator " Hanging Man and Inverted Hammer pattern " is very powerful indicator for Price Action trading : No repaint, No delays; Indicator detects bullish Inverted Hammer and bearish Hanging Man patterns on chart: Bullish Inverted Hammer - Blue arrow signal on chart (see pictures) Bearish Hanging Man - Red arrow signal on chart (see pictures) P C, Mobile & Email alerts are included Indicator " Hanging Man
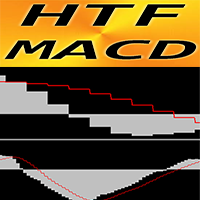
Forex Indicator HTF MACD Oscillator for MT4 HTF means - H igher Time Frame MACD indicator itself is one of the most popular indicators for trend trading This indicator is excellent for Multi-Time Frame trading systems with Price Action entries or in combination with other indicators HTF MACD Indicator allows you to attach MACD from Higher time frame to your current chart --> this is professional trading approach Indicator has built-in Mobile and PC alerts // More great Ex
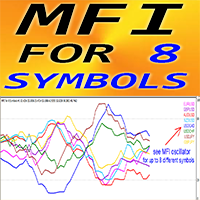
Forex Indicator "MFI for 8 Symbols" for MT4. M oney Flow Index (MFI) is a technical oscillator which uses price and volume data for identifying oversold and o verbought zones It is great to take Sell entries from Overbought when the MFI is above 80 and Buy entries from Oversold when it is below 2 0 MFI is very useful for divergence detection and it is great to combine with Price Action as well "MFI for 8 Symbols" gives opportunity to control MF I values of up to 8 diff
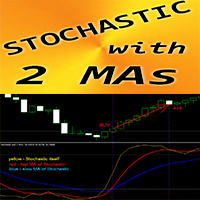
Forex Indicator " Stochastic and 2 Moving Averages" for MT4 Stochastic oscillator is one of the best indicators on the market - perfect tool for many traders. "S tochastic and 2 Moving Averages" Indicator allows you to see Fast and Slow Moving Averages of S tochastic oscillator OverBought zone - above 80; OverSold one - below 20 It is great to take Sell entries from above 80 zone and Buy entries from below 20 You can see Buy and Sell entry conditions on the pictures Con

In a departure from the conventional approach, traders can leverage the bearish engulfing candlestick pattern as a buy signal for short-term mean reversion trades. Here's how this alternative strategy unfolds: The bearish engulfing pattern, (typically signaling a reversal of bullish momentum) , is interpreted differently in this context. Instead of viewing it as a precursor to further downward movement, we perceive it as an indication of a potential short-term bounce or mean reversion in prices.
FREE

The Tripl indicator is designed to visually display the current trend in the market. One of the key aspects of currency market analysis is identifying a trend, which is a stable direction in which prices are moving. For this purpose, the Tripl indicator uses calculations that smooth out sharp fluctuations that do not have a significant impact on the overall trend of price movements.
A trend can be either upward (bullish) or downward (bearish). Most often, a trend develops for a long time befo

The Deep Space Divergence indicator carefully analyzes price dynamics, identifying temporary weakening of the trend or sharp changes in its direction. By monitoring the readings of this indicator, you can easily notice changes in the market and take appropriate action. Entering the market may be easy, but staying in it is much more difficult. With Deep Space Divergence, you will have a reliable base to successfully stay ahead of the trend. This indicator allows you to analyze historical data an

This trading system is based on mathematical probability. In this case, 5 consecutive candles are compared with each other. For a logical comparison, consider these 5 candles as 1 candle on the M5 timeframe. Therefore, the comparison begins with the opening of a candle on the M5 timeframe. The probability of a match is 50% in the 1st candle, 25% in the 2nd candle, 12.5% in the 3rd candle, 6.25% in the 4th candle, 3.125% in the 5th candle. Thus, the 5th candle has a probability of matching in 1

About Waddah Multimeter (free): This product is based on the WAExplosion Indicator. It helps identify explosive market trends and potential trading opportunities. Waddah Multi-meter (Multi-timeframe) Check out the detailed product post here: https://abiroid.com/product/simple-waddah-multimeter/
Features: Waddah Trend Direction Trend Strength (above/below explosion line or deadzone) Trend Explosion Alert Alignment alerts Multi-timeframe Custom currency Multi indicators on same chart (unique p
FREE
Dynamic Arc is a non-redrawing channel indicator based on the use of double smoothing moving averages. The difference between the Dynamic Arc indicator and other channel indicators such as Bollinger Band is that it uses double smoothed moving averages. This allows you to more accurately determine the direction of market movement, but makes the indicator less sensitive. However, thanks to double smoothing, it provides a clearer and more stable representation of channels on the chart, which helps

The indicator defines the buy and sell arrows with high performance and consistent results. Suitable for trend trading or following the trend. Automatic analysis of market opportunities ; Help traders earn more from their investments;
Never repaints, recalculates or backpaints signals; This is FREE demo version of the indicator and works only on "EUR USD M30" . The demo version does not work on SUFFIX OR PREFIX brokers ! Trend Reversing PRO All other details about the indicator her
FREE

Precision Pivot Points Yuri Congia Description: Precision Pivot Points is a sophisticated indicator designed to identify potential market reversal points with accuracy and precision. Utilizing advanced algorithms, this indicator automatically calculates key support and resistance levels based on pivot point analysis. Pivot points are essential tools used by traders worldwide to make informed trading decisions and optimize their trading strategies. Key Features: Automatic calculation of pivot po
FREE

The indicator defines the buy and sell arrows with high performance and consistent results. Suitable for trend trading or following the trend. Automatic analysis of market opportunities ; Help traders earn more from their investments;
Never repaints, recalculates or backpaints signals; This is FREE demo version of the indicator and works only on "GBP USD M5" . The demo version does not work on SUFFIX OR PREFIX brokers ! Forex Trend Commander All details about the indicator here :
FREE

TrendExpert TrendExpert is a sophisticated MQL trading strategy indicator developed by TradeAdviser LLC. It combines advanced technical indicators and risk management principles to deliver consistent and profitable trading outcomes in the financial markets. This strategy is designed to be robust, adaptable, and suitable for various market conditions. Key Features: Utilizes Moving Averages (MA) for trend identification and confirmation. Implements Stop Loss (SL) mechanisms for effective risk man
FREE
Working with the Channel Motion Tracker indicator is as simple as possible. Just react to the arrows that the indicator displays. Each arrow represents an explicit command to action. The signals generated by this indicator are accurate enough to allow you to trade based on this information.
One of the main advantages of the indicator is its ability to build high-quality channels and generate signals for entering the market. This is great for the trader who always finds it difficult to choose
AlphaTrend AM is an indicator that allows you to open a position at the very beginning of a significant price movement. The second most important quality of the indicator is the ability to follow the trend as long as possible in order to obtain all potential profits while minimizing potential losses. The indicator allows you to notify the user about your signals by sending messages to the terminal and e-mail. This indicator does not repaint or not recalculate.
The indicator is a synthesis of t

FREE DEMO ONLY WORK EURO USD PAIR
this indicator almost grail,no repaint and all pairs ,all timeframe indicator. there is red and blue histograms.if gold x sign comes on red histogram that is sell signal. if blue x sign comes on blue histogram that is buy signal. in thise indicator there is g1 value. this g1 value is wariable and use for to see the signals depending on which pair you are looking. this g1 value has benn setled default for euro usd pair. for different pairs it has to be changed.

The indicator defines the buy and sell arrows with high performance and consistent results. Suitable for trend trading or following the trend. Automatic analysis of market opportunities ; Help traders earn more from their investments;
Never repaints, recalculates or backpaints signals; This is FREE demo version of the indicator and works only on " USDJPY H1" . The demo version does not work on SUFFIX OR PREFIX brokers ! Forex Trend Commander All details about the indicator here :
FREE

With the growth of information technology and the increasing number of participants in financial markets, traditional analysis tools are becoming less effective. Conventional technical indicators, such as the moving average or stochastic, in their pure form are unable to accurately determine the direction of the trend or its reversal. Is it possible to find an indicator that remains effective for 14 years without changing its parameters, and at the same time adapts to market changes? Yes, such

Introducing the “Symbol Cost Info MT4” indicator – your ultimate tool for staying ahead in the forex market! This innovative indicator is designed to empower traders with real-time cost information, directly on their charts. Here’s why every trader needs the “Symbol Cost Info MT4” in their arsenal: Real-Time Spread Monitoring : Keep a close eye on the spread for any currency pair, ensuring you enter the market at the most cost-effective times. Pip Value at Your Fingertips : Instantly know t
FREE

Auto Multi Channels VT Ещё один технический индикатор в помощь трейдеру. Данный индикатор, автоматически показывает, наклонные каналы в восходящем,
нисходящем и боковом движении цены, т.е. тренды. (Внутри дня. Среднесрочные и долгосрочные, а также Восходящие, нисходящие и боковые).
О понятии Тренд. На бирже, трендом называется направленное движение ценового графика в одну из сторон (вверх или вниз) . То есть, тренд в трейдинге — это ситуация,
когда цена определенное время возрастает или
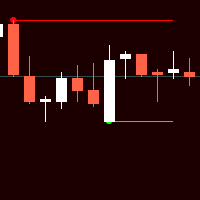
Индикатор Форекс и бинарных опционов основан на простых паттернах из двух свечей. Стрелки вообще не рисуют. Даже при смене таймфреймов.
В настройках можно включить или отключить линию уровня.
Также в настройках можно менять коды стрел, их цвета (также цвета линии уровней), Размер и расстояние от свечи (баров).
Индикатор прост в применении. А настройки тоже не сложные. Единственно не рекомендуется увеличивать период (step). По умолчанию прописано 500. Больше этого уже загружает терминал.
FREE

Yuri Congia Market Info Indicator
Description: The Yuri Congia Market Info Indicator is a powerful tool for traders, providing a wide range of key data directly on the chart. Developed by Yuri Congia, this indicator offers detailed information on the current price, spread, daily highs and lows, remaining time before candle close, and more. It's an essential tool for traders who want immediate access to crucial information during their trading operations. Key Features: Display of the current p
FREE

Safe Trade Indicator MT4
The Safe Trade indicator is an analytical and technical tool that has different features and very accurate signals. This indicator can be used in various markets such as the stock market and the forex market. It states and also provides buy and sell signals.
Features of the Safe Trade indicator
Receiving signals as notifications on the Metatrader mobile application. Receive signals by email. Receiving signals in the form of warning messages or alarms on Metatrader.

Unveil the Secret to Trading with Joker's TrendMaster!
Ready to outperform the markets with a proven and reliable strategy? Look no further! Introducing Joker's TrendMaster, the revolutionary indicator crafted by Yuri Congia! With Joker's TrendMaster, you'll gain access to a powerful combination of advanced technical analysis and unique strategic insights.
Limited-time Special Opportunity: Seize the moment! Be among the first 10 (Purchasing 1/10) to seize this unique opportunity, and not

MACD is probably one of the most popular technical indicators out there. When the market is trending, it actually does a pretty good job, but when the market starts consolidating and moving sideways, the MACD performs not so well. SX Impulse MACD for MT5 is available here . Impulse MACD is a modified version of MACD that works very well for trading Forex, stocks, and cryptocurrencies. It has its own unique feature which perfectly filters out the values in a moving average range and enables it t

The indicator show Higher timeframe candles for ICT technical analisys Higher time frames reduce the 'noise' inherent in lower time frames, providing a clearer, more accurate picture of the market's movements.
By examining higher time frames, you can better identify trends, reversals, and key areas of support and resistance.
The Higher Time Frame Candles indicator overlays higher time frame data directly onto your current chart.
You can easily specify the higher time frame candles yo

With one click open any pair any timeframe directly from dashboard The MA Speedometer Dashboard is a highly functional MetaTrader 4 (MT4) indicator designed to enhance trading strategies through dynamic market analysis. It offers robust features for identifying market trends, trading in sideways markets, and exiting flat market conditions, all based on moving average angles. As a special bonus, customers also receive a special version of the MA Speedometer indicator, which serves as the foundati

TrendWave Oscillator is an advanced MT4 oscillator that not only identifies the trend direction but also provides visual and audio alerts to enhance trading strategies.
Key Features: - Color-coded trend indication: - Blue : Indicates an uptrend, signaling potential price growth. - Orange : Indicates a downtrend, suggesting possible price decline. - Gray : Represents a flat market or lack of clear entry signals.
- Graphical signals on the chart : - Aqua : Highlights an uptrend, empha

TLBD Chart Indicator MT4
Drawing a trend line in price charts is one of the most important methods to identify the market trend, many traders use the trend line break for positioning because they believe that the trend line break means changing the trend and creating a new trend. As a result, the breaking of the trend line is an important sign for traders to open their positions in the direction of the trend. The TLBD indicator is a very suitable tool for detecting the breaking of dynamic tren
123456789101112131415161718192021222324252627282930313233343536373839404142434445464748495051525354555657585960616263646566676869707172737475767778798081828384858687888990919293949596979899100101102103104105106107108109110111112113114115116117118119120121122123124125126127128129130131132133134135136137138139140141142143144145146147148149150151152153154155156157158159160161162163164165166167168169170171172173174175176177178179180181182183184185186187188189190191192193194195196197198199200201202203204205206207208209210211212213214215216217218219220221222223224225226227228
Le MetaTrader Market est le meilleur endroit pour vendre des robots de trading et des indicateurs techniques.
Il vous suffit de développer une application pour la plateforme MetaTrader avec un design attrayant et une bonne description. Nous vous expliquerons comment publier votre produit sur Market pour le proposer à des millions d'utilisateurs de MetaTrader.
Vous manquez des opportunités de trading :
- Applications de trading gratuites
- Plus de 8 000 signaux à copier
- Actualités économiques pour explorer les marchés financiers
Inscription
Se connecter
Si vous n'avez pas de compte, veuillez vous inscrire
Autorisez l'utilisation de cookies pour vous connecter au site Web MQL5.com.
Veuillez activer les paramètres nécessaires dans votre navigateur, sinon vous ne pourrez pas vous connecter.