Regardez les tutoriels vidéo de Market sur YouTube
Comment acheter un robot de trading ou un indicateur
Exécutez votre EA sur
hébergement virtuel
hébergement virtuel
Test un indicateur/robot de trading avant d'acheter
Vous voulez gagner de l'argent sur Market ?
Comment présenter un produit pour qu'il se vende bien
Nouveaux indicateurs techniques pour MetaTrader 4

74% discount for the next 10 buyers (original price $605): 1 left
Get a 50% bonus by buying (or even renting) any of our products. After buying (or renting), send a message for more information. 3 Indicators in 1 indicator
Strategy based on price action
Made specifically for the best forex currency pairs
Can be used in the best time frame of the market
at a very reasonable price This indicator is basically 3 different indicatos . But we have combined these 3 indicators in 1 indicator so th

Graf Mason is a tool that will make you a professional analyst! The method of determining wave movements using inclined channels qualitatively conveys the schematics of the movement of any instrument, showing not only possible reversals in the market, but also the goals of further movements!Destroys the myth that the market is alive , clearly showing the schematics of movements from one range to another! A professional tool, suitable for the medium term with the definition of the current trend!

Best strategy,
Easy trade ,
Support of version update in the future MT My Way: develop for new traders with no experience It is a very simple trade. Open the order when there is signal
and close the order when there is exit or found the next opposite signal. For experienced traders, It will be very easy to trade.
TRADE: Forex
TIME FRAME: All Time Frame
SYMBOL PAIR: All Symbol
SETTINGS:
CALCULATE BARS: Value or bars used must be large enough to calculate the formula. Fo
"NEXT GENERATION ARROWS INDICATOR, SMALL LOSSES BIG PROFITS!" Buy Infinity Trend Commander MT4 Indicator And You Will Get Trends Reversing PRO Indicator for FREE !
Trading is not a simple job. To the uninitiated, trading is an expensive endeavour. Many beginning Traders make one basic mistake: they start their business without a clear vision; without a clear idea of how to achieve what they want. However, we should not forget that Your winning trades should always be bigger than the losin
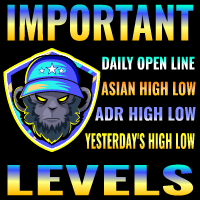
Cet indicateur vous dessinera les niveaux suivants :
Ligne ouverte quotidienne : le marché ci-dessous est baissier, le marché ci-dessus est haussier. Plage quotidienne moyenne haute et basse Marché asiatique haut et bas Hier, les hauts et les bas Ces niveaux sont des niveaux de support et de résistance forts auxquels tout le monde doit prêter attention.
Si vous n'avez pas utilisé le temps pour commencer ! Vous devez faire attention lorsque le prix est proche de ces niveaux !
Profitez du t
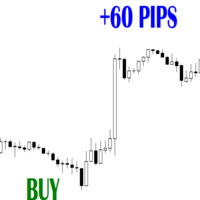
Autres outils de volume à combiner: https://www.mql5.com/en/market/product/72744 Identification des extrêmes de volume élevé : positionnez l'indicateur comme un outil puissant permettant aux traders d'identifier les périodes de pression d'achat ou de vente intense. Soulignez comment le tampon principal de l'indicateur, qui utilise le volume, aide les traders à identifier les pics de volume qui indiquent une activité accrue du marché. Insistez sur l’importance de ces volumes extrêmes pour signa

Contact me after payment to send you the user manual PDF file. Introduction Introducing the Wolfe Pattern Indicator, a powerful tool designed to help traders identify and capitalize on the elusive Wolfe Pattern in financial markets. This innovative indicator uses advanced algorithms to scan for the Wolfe Pattern in all symbols and time frames, providing traders with a unique edge in the market. How to trade with the Wolfe Pattern The Wolf Pattern is a rare and lucrative trading opportunity that
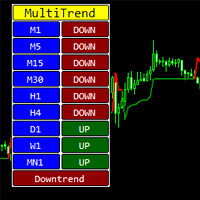
The indicator shows the direction of the trend on different timeframes.
Timeframes can be disabled in the settings.
The bottom line of the indicator reports the prevailing trend - up or down.
The indicator can be used on any trading instruments - currencies, stocks, futures, indices, metals, cryptocurrencies.
This indicator can be used as an independent trading system or as an addition to another system.

- It is 30$ now - 50% Discount (Real price is 60$) Contact me for instruction, any questions! Introduction Triangle chart patterns are used in technical analysis , which is a trading strategy that involves charts and patterns that help traders identify trends in the market to make predictions about future performance.
Triangle Pattern Scanner Indicator It is usually difficult for a trader to recognize classic patterns on a chart, as well as searching for dozens of charts and time frames w
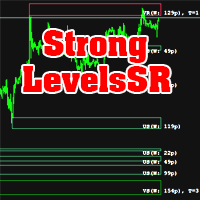
The indicator calculates support and resistance levels. There is a hint in the upper left corner. This hint can be removed. Hint in two languages (English and Russian). The width of support and resistance levels is shown. The number of levels touched is displayed. Works on all timeframes. Can be used as an independent trading system, and as an addition to another system. Download the demo version of the indicator right now and try it in the strategy tester!
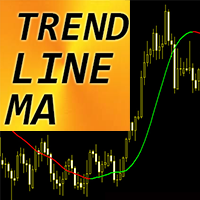
Forex Indicator "Trend Line Moving Average" for MT4 Trend Line MA - is the next generation of Moving Averages! Advanced new calculation method is used. Indicator shows trends without delays. It is much faster and clear than standard SMA, EMA and LWMA indicators. There are plenty of opportunities to upgrade even standard strategies with this indicator. Green color means Bullish trend. Red color - Bearish trend. // More great Expert Advisors and Indicators are availabl
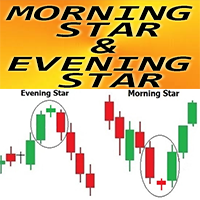
Forex Indicator " Morning Star and Evening Star pattern" for MT4 Indicator "Morning Star and Evening Star pattern" is very powerful indicator for Price Action trading: No repaint, No delays; Indicator detects Morning Star and Evening Star patterns on chart: Bullish Morning Star pattern - Blue arrow signal on chart (see pictures) Bearish Evening Star pattern - Red arrow signal on chart (see pictures) P C, Mobile & Email alerts are included Indicator " Morning Star and Evening Star
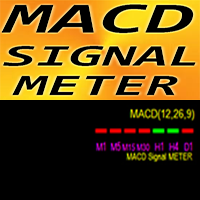
Forex Indicator MACD Signal METER for MT4 Very useful MACD Signal METER indicator is showing current MACD value (above/below Signal) for 7 time frames simultaneously Green box - MACD is above Signal Red box - MACD is below Signal Forex Indicator MACD Signal METER can be used as trade entry filter for Multi Time Frame trading
// More great Expert Advisors and Indicators are available here: https://www.mql5.com/en/users/def1380/seller // Also you are welcome to join to profitable
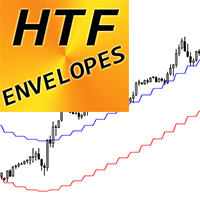
Forex Indicator "HTF Envelopes" for MT4 Upgrade your trading methods with the professional HTF Envelopes for MT4. H TF means - H igher Time Frame Envelopes is one of the best trend indicator on the market - perfect tool for trading It is used to help traders to identify extreme overbought and oversold conditions as well as trading ranges. HTF Envelopes indicator is excellent for Multi-Time Frame trading systems with Price Action entries or in combination with other indicators. I

Precision Trend Signals is an indicator that shows price reversal points on the chart using arrows. A green arrow indicates when the price will reverse upward, and a red arrow indicates when the price will reverse downward. The indicator can be used on any timeframes and any currency pairs. Trading Strategy with this Indicator: Green Arrow : When a green arrow appears, close any previously opened (if any) sell position and open a buy position. Red Arrow : When a red arrow appears, close any prev
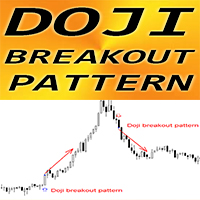
Forex Indicator " Doji Breakout pattern" for MT4 Indicator "Doji Breakout pattern" is pure Price Action trading: No repaint, No delays; Indicator detects breakout of Doji pattern into the trend direction where Doji candle is in the middle of the pattern and the last candle is breakout one: Bullish Doji Breakout pattern - Blue arrow signal on chart (see pictures) Bearish Doji Breakout pattern - Red arrow signal on chart (see pictures) P C, Mobile & Email alerts are included

The "M1 scalping signal" is a scalping indicator designed for the M1 timeframe. The indicator displays arrows on the chart indicating price reversal points. A red arrow indicates a price reversal to a sell position, while a green arrow indicates a price reversal to a buy position. It can be used on all currency pairs. Advantages: No Redrawing: The indicator does not redraw signals on historical data, ensuring stable analysis. Ease of Use: It is easy to configure and visualizes important reversal

Forex Indicator "Trend Entry Histogram" for MT4 Trend Entry Histogram indicator can be used for search of entry signals into the trend direction once Entry bar appears This indicator has unique feature - it takes both: price and volume for calculations Trend Entry Histogram can be in 2 colors: red for bearish trend and blue for bullish one . Once you see steady trend (minimum 10 consecutive histogram bars of the same color) - wait for entry bar Entry signal is 1 column with oppos

We present you the indicator "Candle closing counter", which will become your indispensable assistant in the world of trading.
That’s why knowing when the candle will close can help:
If you like to trade using candle patterns, you will know when the candle will be closed. This indicator will allow you to check if a known pattern has formed and if there is a possibility of trading. The indicator will help you to prepare for market opening and market closure. You can set a timer to create a p

The Renko indicator is a technical analysis tool used in the forex market to visualize price movements and trends by eliminating market "noise." Unlike traditional candlestick or bar charts, Renko is built based on price changes of a specified number of points, called the "brick size." When the price moves by this amount of points, a new "brick" is added to the chart. This indicator ignores time and volume, focusing exclusively on price changes. The main features of the Renko indicator include:
This indicator is not an EA,so it does not have the 'ORDER' function. It only simulates placing orders, so please use it with confidence.
Instructions for use: |←:Choice Bar. →:Start.You can also press the 'X' key on the keyboard to go back and the 'Z' key to go forward. X1:Bar Speed. →|:Back to current time.
Note: If you pull too far forward in the big period, Bar in the small period may not read that far forward. At this time, you must first reduce the picture to the minimum, then press a
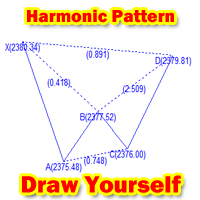
Are you a harmonic trader?
Are you still troubled by having to go to a T website to draw the harmonic index XABCD?
This tool for drawing harmonic indicators on MT4 is just for you!
Instructions: After loading the indicator on MT4, you can set the X postion and Y postion of the indicator. And the color of the line drawn by XABCD (default is blue) After loading the indicator, if postion have not changed, a "Draw" button will appear in the lower right corner by default. After the button
Confident trading with levels of support and resistance! We present to you the indicator " Levels of support and resistance ", which will become your indispensable assistant in the world of trading.
The indicator automatically identifies key levels of support and resistance , on the basis of which you can:
Make Exact Deals : Entering the market at levels of support and resistance greatly increases the chances of successful trading. Identify trend movements : A breakthrough or rebound from
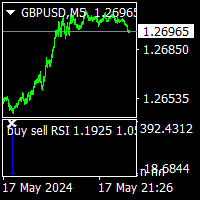
buy sell RSI is rsi wersion of buy sell star indicator. thise indicator no repaint and all pairs all timeframe indicator.
it need minimum 500 bars on charts. when the white x sign on the red histogram that is sell signals. when the white x sign on the blue histogram that is sell signals. this indicator does not guarantie the win.price can make mowement on direction opposite the signals. this is multi time frame indicator and need to look all time frames. sometimes after 1h buy signal ,sel

The indicator defines the buy and sell arrows with high performance and consistent results. Suitable for trend trading or following the trend. Automatic analysis of market opportunities ; Help traders earn more from their investments;
Never repaints, recalculates or backpaints signals; This is FREE demo version of the indicator and works only on " USDJPY M30" . The demo version does not work on SUFFIX OR PREFIX brokers ! ProTrading Arrow - All details about the indicator here : Wor
FREE

PrecisionWedge Detector X
Description: PrecisionWedge Detector X is an innovative indicator designed to identify and analyze wedge patterns on financial charts with unparalleled accuracy and precision. Developed using advanced algorithms, this indicator provides traders with a powerful tool to detect potential trading opportunities based on wedge formations. Key Features: Automatic Wedge Detection: Powered by sophisticated algorithms, PrecisionWedge Detector X automatically scans price data to
FREE

The indicator defines the buy and sell arrows with high performance and consistent results. Suitable for trend trading or following the trend. Automatic analysis of market opportunities ; Help traders earn more from their investments;
Never repaints, recalculates or backpaints signals; This is FREE demo version of the indicator and works only on "GBP USD H1" . The demo version does not work on SUFFIX OR PREFIX brokers ! ProTrading Arrow - All details about the indicator here : Work
FREE
The presented product is an effective trend indicator which, depending on the settings, can be used for both short-term trading (scalping) and medium/long-term trading strategies. The ease of use of the indicator makes it a good choice for both beginners and experienced traders. The essence of the NRTR (Nick Rypock Trailing Reverse) indicator is that it is always located at a constant distance from the reached price extremes - below the chart on uptrends and above the chart on downtrends. The fo

The presented indicator clearly and very accurately displays the current trend, its beginning and end. The indicator is also used to identify support/resistance levels. The operating principle of the indicator is based on another popular and time-tested indicator - Bollinger Bands. The indicator allows you to send notifications to a mobile terminal and email. Customizable parameters: Bollinger Bands Period; Bollinger Bands Deviation; Offset Factor; Alerts - displays a dialog box containing inf

Use GANN 369 to use a combination of 30's,60's,90's time to cross 3's,6's,9's. Any larger combination of these cross smaller combinations of these
Using GANN 369 Method for Trading Reversals The GANN 369 method, inspired by the works of W.D. Gann and Nikola Tesla's 3, 6, 9 numerical patterns, can be employed to identify potential reversals in financial markets. By combining specific periods (30, 60, and 90) with the numbers 3, 6, and 9, traders can seek opportunities for trend changes.
The Forex Trend Tracker is an advanced tool designed to enhance the trading capabilities of forex traders. This sophisticated indicator uses complex mathematical formulas alongside the Average True Range (ATR) to detect the beginnings of new upward and downward trends in the forex market. It offers visual cues and real-time alerts to give traders a competitive advantage in the fast-paced world of currency trading.
Key Features of Forex Trend Tracker:
Trend Detection: The indicator excels in

Overview
In the evolving landscape of trading and investment, the demand for sophisticated and reliable tools is ever-growing. The AI Trend Navigator is an indicator designed to meet this demand, providing valuable insights into market trends and potential future price movements. The AI Trend Navigator indicator is designed to predict market trends using the k-Nearest Neighbors (KNN) classifier.
By intelligently analyzing recent price actions and emphasizing similar values, it help
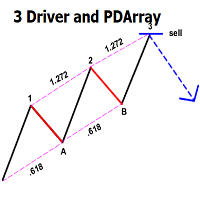
This indicator automatically identifies the SMC 3-Drive pattern and sends notifications to users when the pattern is detected. Additionally, the indicator identifies PDArray (including FVG and OB) and offers an option to combine the 3-Drive pattern with PDArray. This combination provides users with more reliable signals. What is the 3-Drive Pattern? This pattern is formed by three price pushes in one direction, providing a strong reversal signal (Figure 3). The key to identifying this pattern is

The Zigzag Indicator is a powerful tool, developed to assist traders in identifying market trends by highlighting significant highs and lows of a trade. It is designed with the flexibility to adjust to fluctuating market conditions and to filter the minor price fluctuations in the market to focus on substantial ones.
The Zigzag Indicator adheres only to movements that meet a specific percentage or a defined number of points, allowing it to weed out minor price movements and focus solely on

Indicator ini memudahkan kita untuk memantau Trend Aligator secara Multi Time Frame dalam 1 layar tanpa perlu berpindah pindah time frame pada mt4
Untuk cara penggunakan indicator ini sebagai berikut : 01. Cek Multi Time Frame Monitoring untuk Trade Harian ( Cek D1, H4 , H1 jika 1 arah buy kita Fokus pada pattren buyyer untuk follow tren Time Frame H1 ) 02. Cek Multi Time Frame Monitoring untuk Trade 4 Jam( Cek H4, H1 , M30 jika 1 arah buy kita Fokus pada pattren buyyer untuk follow tren Time
Indicator ini memudahkan kita untuk memantau Trend BBMA Multi Time Frame dalam 1 layar tanpa perlu berpindah time frame
Tentukan arah trading menggunakan indicator yang kami sedikan dengan cara : 01. Cek Multi Time Frame Monitoring untuk Trade Mingguan ( Cek W1, D1, H4 ) jika Time Frame H4 Membentuk Full Setup bbma Fokus Pada Reentry )
02. Cek Multi Time Frame Monitoring untuk Trade Harian ( Cek D1, H4, H1 ) jika Time Frame H1 Membentuk Full Setup bbma Fokus Pada Reentry )
03. Cek Mu

- It is 35$ now - 50% Discount (Real price is 70$) Contact me for instruction, any questions! Introduction Chart patterns are an essential tool traders and investors use to analyze the future price movements of securities. One such pattern is the triple bottom or the triple top pattern, which can provide valuable insights into potential price reversals. This pattern forms when a security reaches a low price level three times before reversing upward or reaches a high price level three time
Our custom Kalman Filter indicator is a sophisticated, adaptive tool designed for MetaTrader 4 (MT4), giving traders a dynamic approach to analyzing the financial markets. This indicator is based on the Kalman Filter algorithm, a powerful statistical method used to estimate linear dynamic systems. It is specifically designed for traders who need an advanced, responsive tool to monitor market trends and make informed decisions. We have slightly modified the algorithm for this filter to provide b

AdvaneZigZag Indicator
Are you tired of the limitations of the traditional ZigZag indicator? Meet AdvaneZigZag, the ultimate tool to simplify your market structure analysis and enhance your trading strategies. Designed with flexibility and precision in mind, AdvaneZigZag brings you advanced features to navigate the market with confidence.
Key Features:
1. Enhanced Flexibility:
- While maintaining the familiar simplicity of the conventional ZigZag indicator, AdvaneZigZag offers superi
FREE

You can visually backtest Elliot Wave Impulse to see how it behaved in the past!
Manual guide: Click here Starting price of $45 for the first 25 copies ( 4 left)! -- Next price is $99 .
This indicator is unstoppable when combined with our other indicator called Katana . After purchase, send us a message and you could get it for FREE as a BONUS! The Elliot Wave Impulse is a pattern identified in the Elliott Wave Theory, a form of technical analysis used to ana

on free demo press zoom out button to see back.. cnt number is bar numbers.you can change up to 3000 related to chart bars numbers. minimum value is 500. there is g value set to 1.01. no need to change it.
this indicator almost grail,no repaint and all pairs ,all timeframe indicator. there is red and blue histograms. if gold x sign comes on red histogram that is sell signal. if blue x sign comes on blue histogram that is buy signal. this indicator on thise version works all pairs.al timeframes
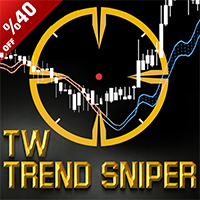
Présentation de l'indicateur "TW Trend Sniper" , un indicateur puissant utilisé pour identifier les principales tendances en utilisant la formule d'indicateur exclusive "Trade Wizards" ainsi que l'utilisation de l'action des prix, la détection des séances de trading de devises, Fibonacci et les fonctions de détection et méthodes de suppression du bruit de l'intelligence artificielle avec une grande précision. cette stratégie conçue par le « groupe Trade Wizards » composé de traders

Avec cet outil de trading, vous pouvez analyser 15 marchés simultanément.
Présentation du nouvel indicateur de trading 2024 :
️ Tableau de bord multi-devises multi-périodes Double CCI.
Il y a au moins deux raisons pour lesquelles j'ai créé cet outil de trading :
Premièrement, j'en ai marre de n'observer qu'un seul marché. Deuxièmement, je ne veux pas perdre le moment d’entrée sur un autre marché.
C'est pourquoi je souhaite connaître en même temps les autres conditions du marché.
Po

Avec cet outil de trading, vous pouvez analyser 15 marchés simultanément.
Présentation du nouvel indicateur de trading 2024 :
️ Tableau de bord multi-devises multi-périodes Double RSI.
Il y a au moins deux raisons pour lesquelles j'ai créé cet outil de trading :
Premièrement, j'en ai marre de n'observer qu'un seul marché. Deuxièmement, je ne veux pas perdre le moment d’entrée sur un autre marché.
C'est pourquoi je souhaite connaître en même temps les autres conditions du marché.
Po
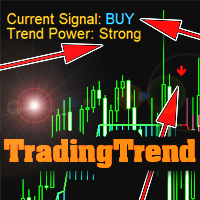
The indicator is not redrawn.
Can be used as a ready-made trading strategy.
Shows: Trend direction; Trend strength; Points of trend reversal or fading. Settings: Trend sensitivity (the lower, the more accurate) - operating sensitivity (the higher, the more accurate); Calculation method - calculation method; Info position - angle of location of the info label (or remove); Text Color - text color; Trend Color Buy - color of the BUY text; Trend Color Sell - SELL text color; Sound Alert - Pop-up

Introduction
The Price Action, styled as the "Smart Money Concept" or "SMC," was introduced by Mr. David J. Crouch in 2000 and is one of the most modern technical styles in the financial world. In financial markets, Smart Money refers to capital controlled by major market players (central banks, funds, etc.), and these traders can accurately predict market trends and achieve the highest profits.
In the "Smart Money" style, various types of "order blocks" can be traded. This indicator
Introduction
The "Smart Money Concept" transcends mere technical trading strategies; it embodies a comprehensive philosophy elucidating market dynamics. Central to this concept is the acknowledgment that influential market participants manipulate price actions, presenting challenges for retail traders.
As a "retail trader", aligning your strategy with the behavior of "Smart Money," primarily market makers, is paramount. Understanding their trading patterns, which revolve around supply

Introduction
"Smart money" is money invested by knowledgeable individuals at the right time, and this investment can yield the highest returns.
The concept we focus on in this indicator is whether the market is in an uptrend or downtrend. The market briefly takes a weak and reversal trend with "Minor BoS" without being able to break the major pivot.
In the next step, it returns to its main trend with a strong bullish move and continues its trend with a "Major BoS". The "order bloc

hint: my basic indicators are used like that KingLevel combind with KingSequence will provides basic insights of the price action of the markets and KingSequenceSgn is just for the convienent for watching. And plus with Forex Trading mentor subsccription I will assist you to win the market at first later if it's great will be upgraded to King Forex trading mentor.
It just the main chart sign of the "KingSequence" indicator.
Here is the detals from the "KingSequence" indicator
Slide 1: Ti

Titre : Guide de Structure BBMA - Guide de Structure BBMA
Description : Le Guide de Structure BBMA est un indicateur MQL4 spécialisé conçu pour aider les traders à comprendre plus facilement et efficacement l'évolution de la structure BBMA. BBMA, ou "Bollinger Bands Moving Average", est connu pour son slogan "Un Pas en Avant", soulignant l'importance de comprendre en profondeur la structure du marché.
Avec le Guide de Structure BBMA, vous pouvez rapidement identifier les motifs de base de l
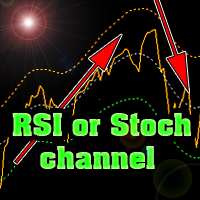
The indicator plots Stochastic or RSI levels in the price channel of a trading instrument.
Download the indicator for FREE right now and test it in the strategy tester.
It is easy to determine the trend direction and overbought or oversold levels.
The settings are standard for any of these indicators.
It is possible to change settings for each trading instrument separately.
You can use currencies, stock markets, futures or cryptocurrencies.
The indicator can be used as an independen
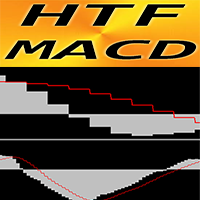
Forex Indicator HTF MACD Oscillator for MT4 HTF means - H igher Time Frame MACD indicator itself is one of the most popular indicators for trend trading This indicator is excellent for Multi-Time Frame trading systems with Price Action entries or in combination with other indicators HTF MACD Indicator allows you to attach MACD from Higher time frame to your current chart --> this is professional trading approach Indicator has built-in Mobile and PC alerts // More great Ex
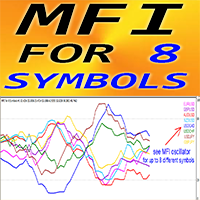
Forex Indicator "MFI for 8 Symbols" for MT4. M oney Flow Index (MFI) is a technical oscillator which uses price and volume data for identifying oversold and o verbought zones It is great to take Sell entries from Overbought when the MFI is above 80 and Buy entries from Oversold when it is below 2 0 MFI is very useful for divergence detection and it is great to combine with Price Action as well "MFI for 8 Symbols" gives opportunity to control MF I values of up to 8 diff
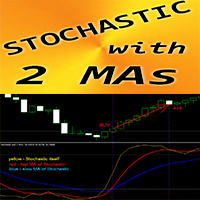
Forex Indicator " Stochastic and 2 Moving Averages" for MT4 Stochastic oscillator is one of the best indicators on the market - perfect tool for many traders. "S tochastic and 2 Moving Averages" Indicator allows you to see Fast and Slow Moving Averages of S tochastic oscillator OverBought zone - above 80; OverSold one - below 20 It is great to take Sell entries from above 80 zone and Buy entries from below 20 You can see Buy and Sell entry conditions on the pictures Con

Présentation de l'indicateur MT4 : Indicateur de niveau K-line, aide les traders à identifier les opportunités de trading à 100 % Résumé: L'indicateur de niveau K-line est un outil d'analyse technique puissant qui aide les traders à identifier des opportunités de trading à forte probabilité. En analysant les plus hauts, les plus bas, les ouvertures et les fermetures des K-lines, cet indicateur révèle des niveaux cachés de support et de résistance qui agissent comme des aimants pour l'action du p
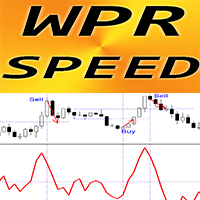
Forex Indicator "WPR SPEED" for MT4 - great predictive tool! The calculation of this indicator is based on equations from physics . WPR SPEED is the 1st derivative of WPR oscillator itself WPR SPEED is good for scalping entries on sideways and flat markets WPR SPEED indicator shows how fast WPR itself changes its direction - it is very sensitive It is recommended to use WPR SPEED indicator for momentum scalping trading strategies: find big size peaks of indicator - open scalping t
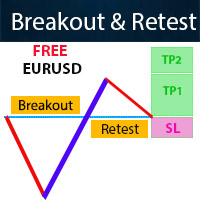
Contact me for any questions All Symbols version! It is free on EURUSD chart. Introduction The breakout and retest strategy is traded support and resistance levels. it involves price breaking through a previous level. The strategy is designed to help traders do two main things, the first is to avoid false breakouts. Many false breakouts start with a candlestick that breaks out of a level but ends with an immediate candlestick that brings the price back into the level. The second thing that the
FREE

The Deep Space Divergence indicator carefully analyzes price dynamics, identifying temporary weakening of the trend or sharp changes in its direction. By monitoring the readings of this indicator, you can easily notice changes in the market and take appropriate action. Entering the market may be easy, but staying in it is much more difficult. With Deep Space Divergence, you will have a reliable base to successfully stay ahead of the trend. This indicator allows you to analyze historical data an

Market Magnet - This is not just a convenient tool, but rather an indispensable assistant for those who prefer to analyze the market using a clean chart. Sometimes even experienced traders need an additional analytical tool to identify key entry and exit points for trades. That's where Market Magnet comes in.
This indicator is ideal for those who often have difficulty identifying trend inflection points or drawing trend lines on a chart. It offers a visual representation of key market moments
The indicator determines the ATR value (points) in a classic way (taking into calculation paranormal bars/candles) and more correctly - ignoring paranormal movements of the Instrument. Correctly it is excluding paranormal bars from the calculation, extremely small bars (less than 5% of the standard ATR) and extremely large bars (more than 150% of the standard ATR) are ignored. The Extended version - allows you to set calculation parameters and a lot of other input parameters Ver
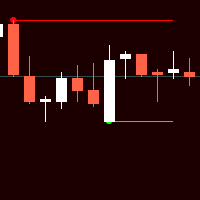
Индикатор Форекс и бинарных опционов основан на простых паттернах из двух свечей. Стрелки вообще не рисуют. Даже при смене таймфреймов.
В настройках можно включить или отключить линию уровня.
Также в настройках можно менять коды стрел, их цвета (также цвета линии уровней), Размер и расстояние от свечи (баров).
Индикатор прост в применении. А настройки тоже не сложные. Единственно не рекомендуется увеличивать период (step). По умолчанию прописано 500. Больше этого уже загружает терминал.
FREE

EMA Above Below Bid price Технический индикатор в помощь трейдеру. Данный индикатор, показывает расположение пяти ЕМА,
пяти средних скользящих, относительно цены формирующей японские свечи или бары (цена Bid ).
О понятии ЕМА.
Скользящая средняя (moving average, MA) — это дополнительная линия на графике цены актива.
Внешне она повторяет график цены, но с небольшим запозданием и более гладко, без колебаний. Основные характеристики:
1. Показывает тренды. Если скользящая устрем
FREE

This indicator will show week and monthhigh low, very useful to understand the market sentiment. To trade within the range/ break out. Low- can act as support- can used for pull back or break out High- can act as resistance- can used for pull back or break out Breakout strategy refers to the day trading technique that provides traders with multiple opportunities to go either long or short . The main idea is to identify the trend in its most juicy state followed by a trending move.
FREE
Highly configurable Trader Dynamic Index (TDI) indicator.
Features: Highly customizable alert functions (at levels, crosses, direction changes via email, push, sound, popup) Multi timeframe ability (higher and lower timeframes also) Color customization (at levels, crosses, direction changes) Linear interpolation and histogram mode options Works on strategy tester in multi timeframe mode (at weekend without ticks also) Adjustable Levels Parameters:
TDI Timeframe: You can set the lower/higher
FREE
AlphaTrend AM is an indicator that allows you to open a position at the very beginning of a significant price movement. The second most important quality of the indicator is the ability to follow the trend as long as possible in order to obtain all potential profits while minimizing potential losses. The indicator allows you to notify the user about your signals by sending messages to the terminal and e-mail. This indicator does not repaint or not recalculate.
The indicator is a synthesis of t

The indicator defines the buy and sell arrows with high performance and consistent results. Suitable for trend trading or following the trend. Automatic analysis of market opportunities ; Help traders earn more from their investments;
Never repaints, recalculates or backpaints signals; This is FREE demo version of the indicator and works only on "EUR USD M5" . The demo version does not work on SUFFIX OR PREFIX brokers ! Forex Trend Commander All details about the indicator here :
FREE

High and Low Levels EMA Технический индикатор в помощь трейдеру. Однажды пришла идея при изучении индикатора Moving A verage ( MA ).
Так как мувинги эти сглаженное, среднее значения цены за выбранный период, то как и у обычной цены и у мувинга
должны быть «хаи и лои».
Данный индикатор, показывает уровни High и Low . Динамических уровней поддержки и сопротивления.
О понятии High и Low .
Хай — от английского high — обозначает наиболее высокую цену («рынок на хаях » — капитализ
FREE

Safe Trade Indicator MT4
The Safe Trade indicator is an analytical and technical tool that has different features and very accurate signals. This indicator can be used in various markets such as the stock market and the forex market. It states and also provides buy and sell signals.
Features of the Safe Trade indicator
Receiving signals as notifications on the Metatrader mobile application. Receive signals by email. Receiving signals in the form of warning messages or alarms on Metatrader.

TrendWave Oscillator is an advanced MT4 oscillator that not only identifies the trend direction but also provides visual and audio alerts to enhance trading strategies.
Key Features: - Color-coded trend indication: - Blue : Indicates an uptrend, signaling potential price growth. - Orange : Indicates a downtrend, suggesting possible price decline. - Gray : Represents a flat market or lack of clear entry signals.
- Graphical signals on the chart : - Aqua : Highlights an uptrend, empha

TLBD Chart Indicator MT4
Drawing a trend line in price charts is one of the most important methods to identify the market trend, many traders use the trend line break for positioning because they believe that the trend line break means changing the trend and creating a new trend. As a result, the breaking of the trend line is an important sign for traders to open their positions in the direction of the trend. The TLBD indicator is a very suitable tool for detecting the breaking of dynamic tren
123456789101112131415161718192021222324252627282930313233343536373839404142434445464748495051525354555657585960616263646566676869707172737475767778798081828384858687888990919293949596979899100101102103104105106107108109110111112113114115116117118119120121122123124125126127128129130131132133134135136137138
MetaTrader Market - les robots de trading et les indicateurs techniques pour les traders sont disponibles directement dans votre terminal de trading.
Le système de paiement MQL5.community est disponible pour tous les utilisateurs enregistrés du site MQL5.com pour les transactions sur les Services MetaTrader. Vous pouvez déposer et retirer de l'argent en utilisant WebMoney, PayPal ou une carte bancaire.
Vous manquez des opportunités de trading :
- Applications de trading gratuites
- Plus de 8 000 signaux à copier
- Actualités économiques pour explorer les marchés financiers
Inscription
Se connecter
Si vous n'avez pas de compte, veuillez vous inscrire
Autorisez l'utilisation de cookies pour vous connecter au site Web MQL5.com.
Veuillez activer les paramètres nécessaires dans votre navigateur, sinon vous ne pourrez pas vous connecter.