Regardez les tutoriels vidéo de Market sur YouTube
Comment acheter un robot de trading ou un indicateur
Exécutez votre EA sur
hébergement virtuel
hébergement virtuel
Test un indicateur/robot de trading avant d'acheter
Vous voulez gagner de l'argent sur Market ?
Comment présenter un produit pour qu'il se vende bien
Nouveaux indicateurs techniques pour MetaTrader 4 - 42
The R[2] Gold Indicator is a complete Trading System working on GOLD (XAUUSD) on 5 Minutes time frame, and it draws: Low Dot / High Dot to spot potential turning points Buy Arrows and Sell Arrows to help you enter the trades with the perfect timing A two colors dotted line to show the trend in action and the target for reversal signals
I invite you to watch my Videos on YouTube where I show the R[2] Strategy and how I personally trade with it, and also to join m

L'indicateur Promining Trade Signal complètera n'importe quelle stratégie et peut également être utilisé comme un outil indépendant. Avantages Calendrier du premier semestre recommandé Facile à utiliser; ne surcharge pas le graphique avec des informations inutiles. La possibilité d'utiliser comme filtre pour n'importe quelle stratégie. L'indicateur ne change pas de couleur après la fermeture de la bougie. Il fonctionne sur les actions, les indices, le pétrole, l'or et sur toutes les périodes. Il
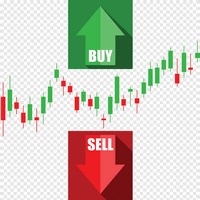
Cet indicateur utilise les hauts et les bas locaux de la série de prix. Après avoir mis en évidence les extrema, leurs valeurs sont lissées. Grâce à cela, deux canaux sont construits - externe et interne. Le canal interne montre les limites si le mouvement des prix suit strictement une tendance linéaire. Le canal externe montre les limites du mouvement des prix avec une tendance logarithmique. Après avoir calculé les canaux, l'indicateur analyse le mouvement des prix réels et propose des recomm

L'indicateur d'alarme d'inversion de la structure du marché détecte lorsqu'une tendance ou un mouvement de prix atteint la fin de son cycle de vie et est sur le point de s'inverser. Il vous avertit lorsque la structure du marché change, ce qui se produit généralement lorsqu'un renversement ou un ralentissement important est susceptible de se produire. Lorsqu'un nouveau haut ou bas est atteint autour d'un point d'épuisement possible, l'indicateur détecte les cassures et la dynamique des prix. L'i
Apollo Binary Options Indicator est un indicateur de signal pour le trading d'options binaires. Le signal arrive à l'ouverture de la bougie actuelle et est valable jusqu'à sa fermeture. Le signal est accompagné d'une flèche ainsi que d'un message de signal directement sur votre carte. Le délai d'expiration de l'option recommandé est d'une bougie. Autrement dit, si le graphique est H1, le délai d'expiration sera de 1 heure. Si le graphique est M5, le délai d'expiration de l'option sera de 5 minut

MetaBands uses powerful and unique algorithms to draw channels and detect trends so that it can provide traders with potential points for entering and exiting trades. It’s a channel indicator plus a powerful trend indicator. It includes different types of channels which can be merged to create new channels simply by using the input parameters. MetaBands uses all types of alerts to notify users about market events. Features Supports most of the channel algorithms Powerful trend detection algorith

40% off. Original price: $50 (Ends in May 15th) Advanced Bollinger Bands Scanner is a multi symbol multi timeframe Bollinger bands dashboard that monitors and analyzes the Bollinger Bands indicator from one chart. This panel monitors the Bollinger bands indicator in up to 28 configurable instruments and 9 timeframes for price overbought/oversold, price consolidation (Bollinger bands squeeze), and consolidation breakout (squeeze break) with a deep scan feature to scan all market watch symbols (

" Scalping saham " is a unique, turnkey scalping trading system. It shows the trader when and where to open and close trades. Scalping trading is one of the most effective, but at the same time, the most complex trading systems. Therefore, if you don’t have your own strategy yet, you’d better take a ready-made scalping strategy and work with it. The scalping strategy of this indicator is to determine the direction of the trend with high accuracy, then determine the price reversal points and giv

40% off. Original price: $50 (Ends in May 15th) Moving Average Trend Scanner is a multi symbol multi timeframe triple MA crossover dashboard that helps traders to monitor, and identify potential market trends from one chart. This panel scans 3 moving averages in up to 28 configurable instruments and 9 timeframes for triple moving average alignment and moving average crossover with a deep scan feature to scan all market watch symbols (up to 1000 instruments!).
Download Demo here (Scans only

Cyclical indicator for trading and predicting the direction of the market. Shows the cyclical behavior of the price in the form of an oscillator.
Gives signals for opening deals when rebounding from the upper and lower boundaries of the oscillator. In the form of a histogram, it shows the smoothed strength of the trend.
Will complement any trading strategy, from scalping to intraday. The indicator does not redraw. Suitable for use on all symbols/instruments. Suitable time frames for short-term

Horizontal tick volumes (HTV) Horizontal tick volumes - an easy and convenient indicator of a horizontal market profile in a user-selected time. Produces a visual image of strong trading levels by maximum peaks past volumes and trading direction by color (sell or buy), and also allows you to detect smaller trading levels by differentiating past volumes. In the "Optimal" mode, when displayed on chart periods up to and including "M30", the data of one-minute bars are used, on H1 and H4 - five-minu
Great indicator for binary options!
Try what he can do!
Alert is arranged in it so that you are not late with the signal!
You can also customize the periods that suit you! (it is configured for currency pairs)
If you want more, you can always reconfigure and use more!
arrow indicator that works on several indicators, in the settings you can change the color of the arrows and the period! (repeat)
Test it and see it in action!

This indicator has as many dots as a Rollex watch..
Also in the kit we have 3 built-in indicators that are combined and configured in such a way that would give you a profit of 75% and that's not all
for your convenience, you can reconfigure it! Initially, it is configured for currency pairs, but if necessary, we can reconfigure it for cryptocurrency and also raw gold, whatever you want!
Not just an arrow indicator, but an Alligator in the world of the Market, then you will like how it sh
PROFITABLE TRADER is an interesting name for this indicator... And all because it is for a true trader who values his time. It has a built-in Alert and parameters that will make your work easier. Open settings will allow you to set the indicator to any cryptocurrency or just currency. It's better to test and then draw a conclusion .. screenshots will show everything.. good bidding my friend.

This indicator is named so for a reason, because it will show the reverse side of the market.
It has several math indicators built in that are tuned to show the best signals for currency pairs!
Ideally proved to be in work on the M5-M15 no more and no less!
Only at the same time it shows up to 86.5% of correct signals!
The settings include the colors of the arrows, the alert, and the same parameters so that you can reconfigure the indicator and trade on cryptocurrency and raw materials!

An excellent indicator for those who like fast binary options trading!
It works great on m1-m5 timeframes!
The periods are customizable, so you can even set up for cryptocurrency, and trade on weekends!
You can also customize the color of the arrows!
Works on all timeframes!
But as stated above, it's better on m1 - m5!
Whatever you forget about the signal, it has an alert!
Test and try this indicator! If I have questions write, I will gladly listen to suggestions and errors!

By TFT Professional - One of our best MT4 products
which does not draw or change the positions of the arrows.
an arrow appears on the current candle.
periods are customizable as well as the color of the arrows.
with this indicator you will feel what you need from the market,
This is the stability and openness of the market.
Multi-timeframe and multi-currency indicator!
Test and try it in action!
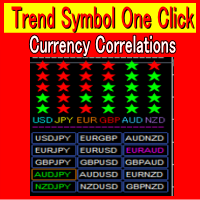
Currency Strength Meter 1:Correctly identifying trends in foreign exchange investments is critical. 2:TrendSymbolOneClick quickly detects and displays trends that have just begun and those that have already been in place for an extended period of time. 3:There is also a USD JPY EUR GBP AUD NZD strength function. 4:Volatility allows you to know exactly when there is a major market move. 5:You can save time in your market analysis by using Trend Symbol One Click. 6:Analysis available from 1 minut

It is a very simple and useful micro indicator. Shows the current ask price, and the maximum relative ask price up to the current moment, on the chart, in the first N candles. It facilitates quick decision making by offering a visual reference. Likewise, when we position ourselves with the cursor over it, it shows us the maximum spread since the indicator is applied, until the current moment. It is perfect for scalping . By default, the parameter N has the value 4.
Especially recommended ind
FREE

Pipsurfer Tide Meter is a Momentum Indicator that is designed to help trades know which way the "Tide" is turning. This indicator is a great supporting indicator to the pipsurfer main indicator that is listed in MQL5 under "Pipsurfer Indicator"
The Strategy Behind the Tide Meter is that youll see the blue bars and the red bars. Blue bars are for bullish momentum Red bars are for bearish momentum Use price action to find a trading zone then wait for the tide meter to change color then you en
FREE

Overview: With so much noise and distraction in the markets I wanted to create clarity for traders to have a simple, efficient, and fun trading experience. This is why I created Pipsurfer. Pipsurfer is an trend following indicator that visually shows you important Institutional Smart Money levels in the market and helps you to trace Market Structure in the markets. Most traders find it difficult to visually see trading elements such as trend, structure and momentum which are key for understandin
Всем привет. Представляю Вашему вниманию Индикатор TRUE ATR для mt4 Так же есть данный индикатор для mt5 https://www.mql5.com/ru/market/product/82319 Данный индикатор работает на всех рынках. TRUE ATR высчитывает среднестатистическое движение инструмента за 1 день и показывает сколько в инструменте осталось энергии внутри дня. В отличие от классического индикатора АТР которые без разбора учитывает все бары(свечи), TRUE ATR при расчете среднестатистического движения инструмента исполь

Pipsurfer Dashboard is a multi-currency multi-timeframe dashboard designed to alert you to where the action is happening in the forex markets. The software trades a trend based price action and market structure strategy. Assets Supported: All Forex Metals Indices Major Crypto
Major Input Settings: Timeframe Filters - Choose which timeframe you want the Pipsurfer Dashboard to signal you on. Pair Selection - Choose To Follow All Major Pairs And Crosses or have a custom list of your choice Aler

L'indicateur affiche la bougie motif Pin Bar. Les paramètres de rapport permettent d'ajuster facilement le rapport entre ombre, corps et taille. Il est possible de filtrer par tendance (2 moyennes mobiles) et par inversion (RSI et bandes de Bollinger). C'est le modèle le plus populaire de Price action. En présence d'un tableau de bord multi-devises. Avec elle, vous pouvez facilement basculer entre les graphiques.
Modèles commerciaux: Retest sur la tendance. Fausse panne. Autrui.
EURUSD, GBP
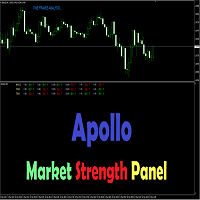
Apollo Market Strength Panel est un indicateur multi-période qui peut être utile aux traders de forex et d'options binaires. Le panel représente les conditions du marché sur plusieurs périodes allant de M1 à H4. L'indicateur fournit des informations sur trois aspects importants du marché. Ce sont la tendance, la force et l'impulsion. Si tous ces 3 composants s'alignent, l'indicateur vous fournira un signal d'ACHAT ou de VENTE en fonction de la direction du marché. L'indicateur trace les signaux

Un indicateur de trading professionnel avec des options en partie double. De précieuses lignes de canal lisses sur la fenêtre séparée, des lignes de tendance sur la fenêtre principale et des flèches de fenêtre et d'entrée séparées. Bon pour le trading de scalping dans les délais les plus courts. Même cela peut également fonctionner et fournir des signaux dans des délais plus longs pour des périodes de négociation à plus long terme.
RÉGLAGES DES INDICATEURS :
1. Mode signal. Il existe 2 opti
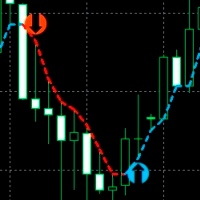
An indicator for accurately determining price reversal points on all timeframes and all currency pairs. With the help of technical analysis of the market and mathematical diagnostic models, this indicator determines the price reversal points and the current trend direction with great efficiency. The indicator displays this information on the chart in the form of arrows and lines. The arrows show the trend reversal points and the lines show the current trend direction. INDICATOR trades in real ti

Price pivot point indicator. The indicator shows with points on the chart the places where the price can turn in the opposite direction. When the indicator draws a red dot, it means that the price can turn its movement down. When the indicator draws a blue dot, then the price can turn its move up. This indicator can be used for both manual trading and automated trading by integrating it into your robot. To do this, the indicator has data exchange buffers.
Recommended currency pairs: XAUUSD EU
The Breakeven levels indicator is an indicator that, according to its algorithm of work, determines the number of open orders on a certain instrument finds the level at which all orders go from loss to profit. Separately, for sell and buy orders, the general level of the beginning of profit is found. In the lower left or right corner, information is displayed on three buttons to choose from. When you press the button, a horizontal line of a certain level is displayed on the screen. On the right

The Market Sessions Indicator for MT5 helps you predict market turnarounds by detecting major supply and demand areas. These pivot points tend to occur after a new session has started and the previous one is still open. It is also used to gauge how many points or pips the market moves on average during a session. This helps us to place better our take profits and stop losses. The indicator works on all forex pairs, gold, silver, commodities, stocks, indices and any other instrument that your

Resistance and Support is an easy to use indicator to apply horizontal lines of resistance and support. There are two windows for adding levels. When you press the button, a line appears on the price chart. It is possible to double-click this line with the mouse to activate and move it, thereby changing the indicator readings. In the indicator menu there is a choice of possible alerts - no alert, alert on touching the level an alert for closing the candle after the level.
FREE

50% off. Original price: $60 (Ends in May 15th) Support and Resistance zones indicator for MT4 is a multi-timeframe panel and alert that finds support and resistance zones and pivot points for all timeframes of MetaTrader 4 and gives alert when price has interaction with them. Download demo version (works on GBPUSD, EURJPY and NZDUSD symbols) Read the full description of scanner parameters in the blog page . Many unique features in one indicator:
Integrating support and resistance zones and p
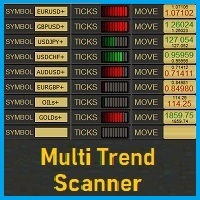
MultiTrend_Scanner is an indicator for the MT4 platform that is used to review trends on multiple symbols. We turn it on on any symbol, on any TF and we have a preview of the entire market. The current symbol is permanently assigned in the first segment of scanner. When adding another segment, you can manually enter any symbol. The quantity of added segments is unlimited. In each segment of a given symbol displayed are trends on different TFs. To calculate the strength of these trends are used
This indicator is based on the same famous fractal indicator with a slight difference:
MetaTrader version 5 click here
Advantages:
Works on all instruments and time series,
Does not redraw its results,
Comparison depth is adjustable,
Works well with any popular strategy,
Adjust the power of fractals
Input settings:
Number of comparisons - The number of candles that each side selects for comparison.
Marker distance from the candlestick
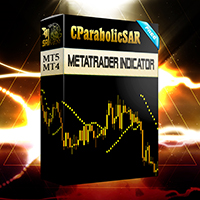
This indicator is based on ParabolicSAR. This indicator does not change the trend easily and does not change the trend until it receives a clause and approval. This indicator can be used for trail stop or trend detection.
MT5 Version
benefits:
Works on all instruments and time series,
Does not redraw its results,
Comparison depth is adjustable,
Works well with any popular strategy,
The power of the areas is adjustable,
We assure you that we we
The Market Sessions Indicator for MT5 helps you predict market turnarounds by detecting major supply and demand areas. These pivot points tend to occur after a new session has started and the previous one is still open. It is also used to gauge how many points or pips the market moves on average during a session. This helps us to place better our take profits and stop losses. The indicator works on all forex pairs, gold, silver, commodities, stocks, indices and any other instrument that yo
MT5 Version A versatile tool
You do not need any other tools with this tool.
You can enable or disable all indicators.
Their values are adjustable.
In the first line you will see a summary of your account status.
p: The amount of your profit or loss
BP: The amount of your daily profit based on the balance
EP: Equity daily earnings
WP: Your weekly profit
MP: Your monthly profit
The next line shows each of the time frames you selected.
Chikou: The Chikou process
KT: The trend of t
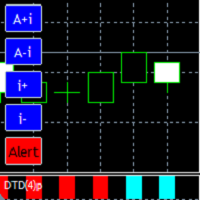
It is a very comfortable and easy to use indicator, as well as very powerful and precise. It is a digitalization of the Oscillometer indicator. Detects and visually shows us the beginning of a new trend . The way to present it, is by means of a two-color bar graph , one for the start of the uptrend, and one for the start of the downtrend . The parameter with which the indicator is built, is the maximum allowed amplitude of price oscillation. The indicator will follow the price checking its

NOTE!: The trend vote and the buy sell option shall match to the same direction before you put a trade!!
Indicator that uses Kalman filters (same as used on autonomous vehicles for data fusion between different sensors / technologies such as RADAR, LIDAR and Camera with Artificial Intelligence for object detection) by using the high and low price in order to identify buy and sell signals as indicated on the graph.
This indicator can be used on any timeframe with any currency or symbol.
Thi
FREE

Indicator MT4 : DXMA(Direction index moving average)
Objective: To track price trends and price reversals.
How to set up Indicator DXMA : 1. The standard value is EMA 12 and EMA 26, you can set it as you like. 2. UTBx 14 is Universal Trend Boundary Index, standard value 14. 3. UTBx Method is a method for calculating the standard value is Exponential.
Meaning of symbols in indicators : 1. The line of the green group means the trend is up. 2. The line of the red group represents a down trend
The Stochastic Dashboard is multi currencies and multi timeframes dashboards. It shows the Stochastic direction for the chosen pairs/timeframes. For the Stochastic lovers and manual trader this indicator is a most indicator which can be used to determine the market direction for the pair(s) you are trading. Set it to one chart only and monitor from one place all the charts you want.
PAX Simple Trend Signals for MT4
Самый простой и лёгкий в работе индикатор для торговли по сигналам разворота тренда. Зелёными и красными линиями на ценовом графике отображаются направления тренда — растущий и падающий соответственно. Стрелка вначале линии тренда сигнализирует о развороте тренда.
Если на трендовой линии появилась стрелка такого же цвета — это сигнал на открытие нового ордера. Если на трендовой линии появилась стрелка противоположного цвета — это сигнал на закрытия всех орде
L'indicateur recherche et affiche automatiquement de grandes ombres sur le graphique en fonction de la volatilité. Les ombres sont en outre filtrées par la taille de l'onde. L'algorithme analyse la répartition de la fractale avec une ombre dans une plage spécifiée et affiche le niveau. Dans les paramètres, vous pouvez activer le tableau de bord multi-devises. Alert est sélectionné entre le graphique actuel ou toute la feuille de tableau de bord. Les signaux sur les grandes ombres et ceux qui on
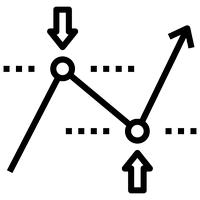
Cet indicateur affiche les niveaux optimaux de take profit et de stop loss. Ces niveaux sont calculés sur la base de données historiques. Au premier démarrage, l'indicateur est entraîné sur l'historique. Après cela, il évalue la probabilité que le prix dépasse tel ou tel niveau à l'avenir et sélectionne les options les plus optimales pour passer des ordres stop. Par exemple, les valeurs de take profit sont sélectionnées pour que le profit soit maximum et que la probabilité que le prix atteigne
La série hypergéométrique est utilisée pour calculer les coefficients de poids de ce filtre. Cette approche permet d'obtenir un lissage assez intéressant de la série temporelle. Les poids de filtre hypergéométriques ne décroissent pas aussi vite que les moyennes mobiles pondérées exponentielles et linéaires, mais plus rapidement que les moyennes mobiles lissées. Pour cette raison, le comportement de ce filtre est à bien des égards similaire au comportement des moyennes mobiles. Cependant, il pr

RSI divergence indicator finds divergences between price chart and RSI indicator and informs you with alerts (popup, mobile notification or email). Its main use is to find trend reversals in the chart. Always use the divergence indicators with other technical assets like support resistance zones, candlestick patterns and price action to have a higher possibility to find trend reversals. Three confirmation type for RSI divergences: RSI line cross 50 level Price returns to previous H/L Creat
FREE
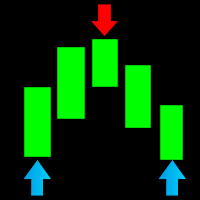
An indicator that shows price reversal points on the chart. Using RSI and other standard indicators, the indicator determines the price reversal points and shows them on the chart with arrows. The indicator does not redraw its values and in 95% of cases it shows accurate signals. This indicator works on all currency pairs and all timeframes.
How to trade with this indicator (recommendations): We recommend opening trades in the direction of the arrow that appears. If a blue arrow appears, op
Multi-timeframe signal trend indicator.
Detects the trend direction and is colored in the corresponding color.
It has three different sensitivity options
Can show trend direction on other timeframes
Has embedded audible and visual alerts on trend reversals.
Can send notifications to your phone or email.
Allows trend and counter-trend trading.
Works on all timeframes, all currency pairs, metals, indices and cryptocurrency.
It can be used for binary options.
Distinctive feature

[75% OFF! - SALE ENDS SOON] - RevCan Trend Entry Point is a trend based trade alert indicator for serious traders. It does all the price and chart analysis all by itself, and whenever it finds any potential high quality trading opportunity(Buy or Sell) using its revolutionized price prediction algorithms, it sends instant trade alert directly on the chart, MT4 terminal and on the mobile device. The trade signals will be visible on the chart as Up and Down arrows, while the instant audible aler

Developed methods for trading collected in one indicator. In the form of arrows, it defines entries in the direction of the trend.
It has 2 types of arrows - trend and signal guides, informing about the potential movement in the direction of the trend.
Works without redrawing, ready for use on all symbols/tools.
The most suitable time frames to use are M15, M30, H1, H4.
How to use
The indicator finds the direction of the trend in the form of a signal arrow, a graphic rectangle stretches

RSI Signals is a simple dashboard type indicator that displays the values of the RSI (Relative Strength Index) oscillator on various instruments and time frames chosen by the user. In addition, it can be configured by the trader to show signals when the RSI is in an overbought/oversold condition, when it crosses these levels or when it crosses the 50 level, which is important in some strategies. It is simple and easy to set up. By itself, it should not be used as a trading system since RSI signa

. Simple Trading System Update !!! Follow this link to see our Strategy !!! (With auto trade indicator)
Description This is an indicator Free Version and showing only history signals, Not real time. Binary Deal Trading Indicator is an indicator on MT4 for Binary Option Trading. It forecasts the overbought / oversold level, Reversal and Fractal point. This indicator will help you to decide a reversal price on any time frame (Recommend M1, M5 and M15). The expiry time is 5-15 minutes after re
FREE
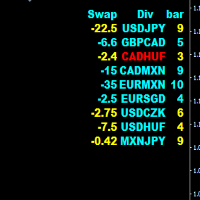
Divergence HiLo scaner is a good tool for market analysis. The indicator looks through all currency pairs and finds those that meet the selection conditions, where corrections or reversals to the main movements are supposed to begin. The indicator values are entered in the final table. 1 value is swap 2 Currency pair. 3 The number of bars after finding the selection conditions. The bar color blue is used for the buy signal. The bar color yellow is used for the sell signal. The color of the
Would you like to learn a technical system refined by centuries of use, but virtually unknown here? A system so versatile that it can be fused with any other indicator/technical tool? A system as pleasurable to use as it is powerful? If so, this indicator which scans candlestick charting techniques is for you. You should find it valuable no matter what your background in technical analysis. This trading system has been designed after years of hard work and back testing. Indicator will find stro
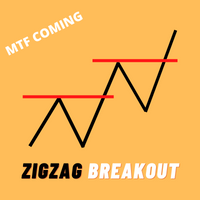
MTF Update will be soon
Price Increase Soon, It just Off price only for first 10 copies. ZigZag Breakout Arrow Very high accurate buy and sell signals provide , you can also use as market reverse signal or Trend change alert Features. ZigZag Parameters changeable. Alerts. Buy and Sell Signal. ZigZag Breakout on candle close or candle high price. and MTF Update will coming soon.

This is a multi time frame demand and supply indicator for MT4 platform. You can use multi time frame demand and supply levels on smaller time frames. Additionally you can choose to kill every level has has been tested. you have narrow bands that is you can select the whole demand and supply level or just a narrow section Finally, you also get price range for the zones. Awesome
FREE

Scalping Code is for trend scalping. It is simple to use and is profitable. It can work on any time frame and any asset. This indicator can be used on it's own or together with another system. The arrow does not repaint or recalculate.
The rules are as follows: A blue arrow above the moving average is a buy. An exit for the buy above the moving average is a red arrow or target. A red arrow below the moving average is a sell. An exit for the red below the moving average is a blue arro

Fibonacci retracements are trend lines drawn between two significant points, usually between absolute lows and absolute highs, plotted on a chart. Intersecting horizontal lines are placed at the Fibonacci levels. Fibonacci retracements are useful tools that help traders identify support and resistance levels. With the information gathered, they can place orders, identify stop-loss levels, and set price targets. Although useful, traders often use other indicators to make more accurate assessments
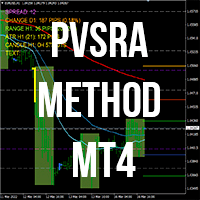
Méthode de négociation PVSRA. Le système est basé sur le calcul de la direction des positions des grands joueurs, dans laquelle ils gagnent des positions.
PVSRA est une abréviation : P - Prix (Prix), V - Volume (Volume), S - Support (Support), R - Résistance (Résistance), A - Analyse (Analyse).
La méthode PVSRA utilise des niveaux de prix ronds (par exemple 1,2000) et des niveaux intermédiaires (par exemple 1,2250, 1,2750). La consolidation en dessous du niveau rond est la préparation des p

Avec cet indicateur, vous vous sentirez en totale liberté, vous n'aurez plus à chercher de l'eau dans un trade pendant des heures et à deviner les niveaux de stop loss et de take profit. Maintenant, tout est devenu simple. Ce système s'inspire de deux stratégies en vogue à l'époque : le Turtle System et le PVRSA. J'ai pris le meilleur des deux mondes et j'ai créé ce merveilleux indicateur.
Règles de négociation : Une barre rouge signifie un volume accru et vous devez rechercher une opportunit
FREE
Speed Trade - Un excellent outil entre de bonnes mains!
Ce qui vous permettra de regarder le marché de l'autre côté !
Tous les signaux et impulsions cachés que vous n'avez pas vus seront affichés par ce produit !
Indicateur multidevise qui vous permet de négocier sur toutes les paires de devises.
Le produit est également testé sur les matières premières et la crypto-monnaie.
Il est conseillé d'utiliser des délais ne dépassant pas 1 à 5 mois, c'est un trading rapide et intelligent.

Cet indicateur analyse plusieurs paires sur plusieurs périodes pour les valeurs RSI et dessine des flèches vertes vers le haut pour les valeurs de surachat RSI et des flèches rouges vers le bas pour les valeurs RSI survendues en temps réel.
Caractéristiques • Tracé de lignes animées • Redimensionnable • Repositionnable • Minimisable • Plusieurs thèmes de tableau de bord • Plusieurs délais • Vous pouvez ouvrir une paire en cliquant dessus • Paire de graphiques actuelle marquée par une couleur
FREE

Scalping indicator. Points show the price reversal places on the chart. Not redrawn. Minimum delay. Works on M1, M5, M30, H1, H4 timeframes. You can work on all currency pairs. The indicator can also work on gold, silver and cryptocurrencies. This indicator can also be used for binary options.
How to trade (an example of a strategy for GBPUSD)? When a blue dot appears, buy. When a red dot appears, sell. TakeProfit set to 25 points. StopLoss set 35 points. TrelingStop is set at 15 pips. Benefi

Ready trading system. The indicator arrow shows when and in what direction you need to open an order. At the end of the blue rectangle we put TakeProfit, and at the end of the red rectangle we put StopLoss. The indicator calculates the size of TakeProfit and StopLoss automatically, depending on the market volatility and the probability of price direction. Therefore, the indicator does all the work instead of the trader. He analyzes the market himself, determines the distance for TakeProfit and

The "Spread Monitor" indicator allows you to analyze the spread change during the day, control the expansion of the spread by your broker and has a number of interesting additional features Choosing a broker with a minimum spread value is very important for the work of night advisors, scalping and intraday trading.
However, the MT4 terminal does not store spread data, so the multifunctional "Spread Monitor" indicator will be useful for any intraday trader. Features:
The indicator shows the cu

About Scanner:
Detailed blog post is here: https://www.mql5.com/en/blogs/post/749119
BB Squeeze Scanner uses bbsqueeze.ex4 in background to calculate when BB Squeeze (Bollinger Bands Squeeze) happens and when BBands expand. It is attached with the above blog post.
What is Bollinger Bands Squeeze:
The Bollinger bands squeeze is a special pattern when the volatility of a market decreases after trending periods. It is generally observed the price is ranging during this period until a

Trend indicator Trend Esay MTF is an indicator that draws arrows directly on the price chart. Like every trend indicator, it works well with good price movement and worse in a flat. A feature of this indicator is the ability to send alerts both in the terminal and on a smartphone. The indicator menu contains the number of bars in the history of the indicator and period value for determining the trend. The "trend" function has been added to the indicator menu, which filters the indicator signals
FREE

Target Striking - One of the best binary options trading tools!
It is set up so powerfully that you can trade not only on currency pairs, but also on raw gold oil!
You can also try on cryptocurrency!
Ideal for trading on currency pairs, the percentage of reliable transactions is more than + 75%
The trading tool is already set for the best profit!
Only Target Striking can unlock the potential of the trading market for you!
With it, the signals are even and accurate without redrawing,

CHART OBJECTS: Blue box : Bullish Order Blocks (OB) Red box : Bearish OB Orange box : Mitigated OB. Price bounce from this area the made a new high/low Light gray box : Price bounced from this area but did not made a new high/low Dark gray box : Broken OB. Filled boxes : TimeFrame 1 Order Blocks
Unfilled boxes : TimeFrame 2 Order Blocks
INDICATOR SETTINGS: Order Block Required Length: Required number of subsequent candles in the same direction to identify Order Block. Default value: 5 Im
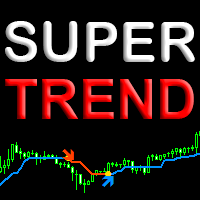
В Super Trend Line реализован один из лучших "price action" алгоритмов трендового индикатора. В связке с авторской фильтрацией это дает максимально точное определения тренда на любых трендовых валютных парах, акциях, криптовалюте без перерисовки результата. Индикатор легко настраивается и станет дополнительным помошником в вашей торговой системе. Подходит как новичкам так и профессионалам для всех видов трендовой торговли.
Как выбрать прибыльный таймфрейм и оптимизировать индикатор под валютну
Le MetaTrader Market est la seule boutique où vous pouvez télécharger un robot de trading de démonstration gratuit pour le tester et l'optimiser à l'aide de données historiques.
Lisez l’aperçu de l'application et les avis d'autres clients, téléchargez-la directement sur votre terminal et testez un robot de trading avant de l'acheter. Seul MetaTrader Market vous permet de tester gratuitement une application.
Vous manquez des opportunités de trading :
- Applications de trading gratuites
- Plus de 8 000 signaux à copier
- Actualités économiques pour explorer les marchés financiers
Inscription
Se connecter
Si vous n'avez pas de compte, veuillez vous inscrire
Autorisez l'utilisation de cookies pour vous connecter au site Web MQL5.com.
Veuillez activer les paramètres nécessaires dans votre navigateur, sinon vous ne pourrez pas vous connecter.