 MetaTrader 5
 Experts
 Indicateurs
 Bibliothèque
 Utilitaires
 Widgets
 Règles
Regardez les tutoriels vidéo de Market sur YouTube
Comment acheter un robot de trading ou un indicateur
Exécutez votre EA sur
hébergement virtuel
hébergement virtuel
Test un indicateur/robot de trading avant d'acheter
Vous voulez gagner de l'argent sur Market ?
Comment présenter un produit pour qu'il se vende bien
Nouveaux indicateurs techniques pour MetaTrader 4
 Les signaux des indicateurs techniques énumérés ci-dessous jouent un rôle crucial dans l'ouverture et la clôture des transactions sur la plateforme MetaTrader 4. La nature des indicateurs est une transformation mathématique du prix d'un symbole financier visant à prévoir les variations de prix.

QUANTUM BINARY SNIPER MT4 Moteur d’IA spécialisé | Action des prix sur trois bougies | Momentum CCI sur plusieurs unités de temps | Quantum Binary Sniper MT4 réunit plusieurs niveaux d’analyse graphique dans un espace de travail MetaTrader 4 unique et coordonné. Il associe le composant AI Special Engine / Prediction Engine, un algorithme défini sur trois bougies, des flèches directionnelles en temps réel, des rectangles de momentum CCI sur plusieurs unités de temps, l’affichage rétrospectif des

SPIDER X MT4 — INDICATEUR AVANCÉ DE SIGNAUX FONDÉ SUR L’ACTION DES PRIX Détection intelligente des signaux | Technologie Spider Chain | Alertes en temps réel SPIDER X MT4 est un indicateur fondé sur l’action des prix, conçu pour identifier des opportunités potentielles d’ACHAT et de VENTE grâce à une analyse structurée des chandeliers. Avec ses signaux distinctifs en forme d’araignée, la visualisation historique sur le graphique, ses alertes en temps réel et son interface Chain exclusive, Spide

Heatmap Volume vous montre d'un coup d'œil quand le volume est vraiment inhabituel. Chaque barre de volume est colorée selon le nombre d'écarts-types qui la séparent de sa moyenne mobile, de Low à Extra High , et la même couleur est appliquée aux bougies du graphique principal. Pics de participation, climax et phases calmes apparaissent directement sur le prix, sans avoir à lire de chiffres. Fonctionnement L'indicateur calcule la moyenne mobile et l'écart-type du volume (610 barres par défaut) e
FREE

Aurex Structure Breakout est un indicateur MT4 gratuit conçu pour identifier les zones importantes de support et de résistance, détecter les cassures et générer automatiquement un plan de trading complet directement sur le graphique. L’indicateur fonctionne sur toutes les unités de temps et sur tous les instruments pris en charge par MetaTrader 4, notamment : • Forex
• Or
• Indices
• CFD Lorsqu’une cassure valide est détectée, l’indicateur peut afficher automatiquement : • Prix d’entrée
• St
FREE

Multi Timeframe Indicator Suite affiche des moyennes mobiles, des bandes, l'Ichimoku, le VWAP et des oscillateurs d'unités de temps supérieures sur le graphique MetaTrader 4 sur lequel vous tradez. Un nuage Ichimoku H4, une moyenne mobile journalière et un stochastique quadruple (quad stochastic) tiennent sur un seul graphique M15, chacun calculé sur sa propre unité de temps : vous gardez la vue d'ensemble sans changer de graphique. Les oscillateurs s'affichent dans des zones en bas du graphique
FREE

LIGHTHOUSE — la structure du marché en un coup d'œil. Sans repaint. LIGHTHOUSE lit la structure du prix à partir de points de swing confirmés et l'affiche sur le graphique de façon claire et simple. Il répond à trois questions que tout trader discrétionnaire se pose avant d'entrer : où va l'unité de temps supérieure ? Où va le graphique actuel ? Où sont les niveaux de prix importants ?
C'est un outil d'aide à la décision. Il ne passe pas d'ordres et ne prédit pas les prix. Pourquoi « LIGHTHOUSE

BOA Swing Levels trouve les plus hauts et plus bas de swing sur l'unité de temps choisie et montre où la prochaine cassure peut commencer, où se trouvent ses objectifs et son stop, et à quelle fréquence ces objectifs ont été atteints dans l'historique de votre symbole. NIVEAUX Les niveaux sont trouvés sur les barres clôturées de l'unité de temps des niveaux (M15 par défaut) par un canal de prix de N barres : un swing se termine quand le prix sort du canal de l'autre côté, et son extrême devie
FREE

Inversion FVG détecte les Fair Value Gaps (déséquilibres de 3 bougies) et trade le moment où ils échouent. Lorsque le corps d'une bougie clôture à travers le gap, celui-ci est "inversé" et devient un support ou une résistance. Quand le prix le retest et est rejeté, l'indicateur affiche une flèche avec des niveaux prêts d'entrée, de Stop Loss, de TP1 et de TP2.
Fonctionnement 1. Un FVG haussier ou baissier est détecté et dessiné comme zone brute. 2. Une clôture du corps d'une bougie à travers l

Indicateur Crypto_Forex "Relative Drawdown Display" pour MT4, outil de trading utile. C'est un indicateur INDISPENSABLE pour les traders qui utilisent des systèmes de trading en grille !!! - L'indicateur Relative Drawdown Display affiche le DD relatif actuel ou le profit flottant en % sur votre compte. - Les alertes PC et mobiles sont intégrées avec un niveau de déclenchement réglable. - L'indicateur indique également le solde et les capitaux propres du compte. - Il est possible de localiser l

TrendLadder — indicateur de tendance adaptatif avec panneau multi-unités de temps
OBJECTIF TrendLadder affiche la direction de la tendance sous la forme d'une « ligne en escalier » épurée. Tant que le marché ne fait que du bruit, la ligne reste immobile ; elle ne bouge que lorsque le prix effectue un mouvement significatif et confirmé. Vous voyez ainsi d'un coup d'œil qui contrôle le marché — acheteurs ou vendeurs — et quand la tendance a réellement changé. MT5-version: https://www.mql5.com/en

Indicateur Crypto_Forex « Modèle de marteau inversé » pour MT4, sans modification, sans délai. - L'indicateur « Modèle de marteau inversé » est un indicateur très performant pour le trading basé sur les prix. - L'indicateur détecte un marteau inversé haussier sur le graphique : signal de flèche bleue sur le graphique (voir images). - Alertes PC, mobile et e-mail. - L'indicateur « Modèle de marteau inversé » est idéal pour combiner les niveaux de support et de résistance. Click here to see high

Indicateur Forex « Zones clés rondes » pour MT4. - L'indicateur « Zones clés rondes » est un indicateur auxiliaire indispensable pour les traders qui prennent en compte les supports et résistances. - Les niveaux de 1 000 et 500 ronds sont respectés par le cours ; il rebondit très souvent à partir de ces niveaux. - Les niveaux majeurs de 1 000 sont également entourés de fortes zones de support et de résistance (100 points de chaque côté). - Les niveaux de 1 000 et 500 ronds sont également idéaux

REBOUND CORRIDOR — indicateur pour MetaTrader 4 Rebound Corridor construit un corridor adaptatif autour du prix et signale les moments où le prix dépasse son bord puis revient vers le centre. Il convient au trading des retracements et du retour à la moyenne. MT5-version: https://www.mql5.com/en/market/product/203386 CE QUE VOUS VOYEZ SUR LE GRAPHIQUE Ligne centrale (axe du corridor). Sa couleur indique le biais actuel du marché : cyan — haussier, rose — baissier, violet — neutre. Bandes intérie

FalconRidge est un indicateur de superposition tout-en-un pour MetaTrader 4. Il réunit sur un seul graphique la structure des oscillations, les niveaux de prix clés, les zones de volatilité, un canal de prix et un panneau de tendance, afin de lire le contexte du marché d'un coup d'œil, sans jongler avec de nombreux outils séparés. MT5-version: https://www.mql5.com/en/market/product/203426 CE QUE L'ON VOIT SUR LE GRAPHIQUE Oscillations (swings) : des flèches signalent les sommets confirmés (rouge

Profit Stats Panel : statistiques de profit par paires et Magic Number À quoi ça sert L'indicateur montre directement sur le graphique comment votre compte ou un conseiller expert spécifique trade. Il prend l'historique des trades fermés et le rassemble dans un panneau : profit par chaque paire, pourcentage de trades rentables, Profit Factor, résultat d'aujourd'hui, d'hier, du mois et de l'année, drawdown maximal. À côté, un tableau des profits par heures du serveur est affiché. Il montre

Indicateur Crypto_Forex « Consolidation Bar Pro » pour MT4. Sans repeint, sans délai. - L'indicateur « Consolidation Bar Pro » est un indicateur de cassure très puissant pour le trading Price Action. - Il détecte les phases de consolidation des prix dans une zone étroite sur une seule barre et affiche : la direction de la cassure, l'emplacement des ordres en attente et l'emplacement du stop loss. - Barre de consolidation haussière : signal par flèche bleue sur le graphique (voir images). - Barr

Indicateur Crypto_Forex « HTF Moving Averages Cross » pour MT4. - Améliorez vos méthodes de trading avec le puissant indicateur HTF Moving Averages Cross pour MT4. HTF signifie « période de temps supérieure ». - Cet indicateur est idéal pour les traders de tendance avec des entrées d'action de prix. - Il vous permet d'associer des moyennes mobiles rapides et lentes d'une période de temps supérieure à votre graphique actuel - une méthode professionnelle. - HTF Moving Averages Cross intègre des a

IMD Triangles – scanner de triangles et de canaux sur lignes de tendance Chat pour discuter des robots de l'équipe: rejoindre
IMD Triangles est un indicateur qui recherche, sur une liste de symboles, des triangles et des canaux horizontaux formés par des lignes de tendance et calcule les niveaux Buy Stop et Sell Stop pour la cassure.
L'indicateur n'ouvre pas de positions et ne prend pas de décisions de trading. Il affiche la figure et les niveaux, et le trader décide de placer ou non les ordr

Votre lot peut risquer plus que le pourcentage que vous avez fixé. True Risk affiche le risque réel de votre prochain trade avant que vous ne l'ouvriez. Le problème Les courtiers arrondissent chaque lot à l'inférieur selon un pas et ne descendent jamais sous le lot minimum. Sur un petit compte, le lot minimum à lui seul peut représenter plusieurs fois votre plan. Avec 300 dollars et un stop sur l'or à 25 dollars, 0.01 lot risque déjà 25 dollars, soit 8.3 pour cent et non le 1 pour cent que vous
FREE

See which fair value gaps flipped sides. This indicator marks every inversion fair value gap (IFVG) - a gap that a candle closed straight through - signals and alerts when price comes back to it and respects it, and checks on your own chart what price did next. ICT Inversion Fair Value Gap IFVG Honest Stats finds fair value gaps, waits for a candle to close through one and turns it into an inversion gap on the other side: a bearish gap closed above becomes bullish support, a bullish gap closed b
FREE

MD Gold Miner Pro .System For serious Traders
Market, Specially Gold (XAUUSD)is known for its Volatility and Liquidity. Good thing is it can be Trade Easily if you know its Behaviours and Imbalance Shift. Gold Miner indicator is Based on Imbalance and Shift Strategy. No Repaint/Replace.
Pleas Get Template File, APB and Risk Tool Get Strategy Guide PDF When SmartMoney(Big Investors)Creat the Move , Market always show some Imbalance and then Reverse. Gold Miner Pro Trace it and Create the St

TIRED OF FALSE SIGNALS AND DISAPPEARING ARROWS?
Test the logic of Trend Reverting PRO MT5 completely for FREE on EURUSD (M5 & M15) and see the accuracy for yourself!
Hey trader, I know how frustrating it is to look at a beautiful chart history, only to realize the indicator changes its mind during live trading. That’s why I want you to test my algorithm completely risk-free. This is a fully functional free/demo version designed specifically for EURUSD on the M5 and M15 timeframes (works with
FREE

Smart Trade Entry MT5 Discount: The price is $200$, But now it is just $45 for one purchase, next price is 80$. - New Scanner Panel *** Contact me to send you instruction and add you in group for sharing or seeing experiences with other users. + FREE Trading Utility MT5 Description: Smart Trade Entry indicator entries with Entry, Stop Loss and Take Profit levels, a professional panel and a multi symbol, multi timeframe scanner. Smart Trade Entry finds the moments when the market goes quiet a

A Candle Range Theory (CRT) indicator for MetaTrader that marks each CRT setup at the candle close and keeps a record of how those setups played out on your symbol. Every setup is tracked until price reaches the middle of the range, crosses to its opposite edge or fails, and the outcome is written on the chart. A statistics panel counts the recent CRT buys, CRT sells and all setups together, with the share that got to the 50% line and the share that got to the opposite edge. You see what the las

Elliott Wave Auto Count labels Elliott waves automatically on four degrees at the same time: the base degree and the three degrees above it. It follows the rules and guidelines of "Elliott Wave Principle" (Frost & Prechter). For the current wave it also shows a price x time target zone and an invalidation level. This is the MetaTrader 4 version; the counting logic is the same as in the MetaTrader 5 version (sold separately).
HOW IT WORKS 1. Swings: five ATR(100)-based zigzags. Each higher degr

Dow Structure MTF shows the Dow theory trend structure of five timeframes at the same time, using the pullback low / rally high approach that is common among Japanese traders. For each timeframe you see whether the trend is up, down or range, which price would change it, and how far the current price is from that level. Only closed bars are used, so a confirmed result never changes afterwards (no repaint). This is the MetaTrader 4 version; the logic, inputs, display and alerts are the same as i

Fibo Price Time Zones combines Fibonacci price levels with Fibonacci time targets and draws them on the chart as boxes (price x time zones). It helps you organize which price areas to watch and roughly when. Where boxes from several waves and from higher timeframes overlap, the area is emphasized in three levels. Base waves are built only from confirmed swings, so a confirmed box does not move afterwards (see the conditions below). This is the MetaTrader 4 version; the calculation, inputs, defa

Time Average Lines draws four averages that are measured by time, not by the number of bars. When you switch timeframes, each line still averages the same length of time. The main line (3) averages how far price had moved from the day's open at the same clock time on past days, and the rest of today is shown as a dotted path that joins those past averages. The path is a summary of the past, not a forecast.
THE FOUR LINES - (1) Time MA: average close of the bars that started within the last N m

Auto Trendline Channel MTF draws trendlines, parallel channels and horizontal support / resistance automatically from confirmed swing highs and lows. For each line it records the touch count, close breaks, wick breaks and retests. A table shows, for the chart timeframe and two higher timeframes, the nearest line above and below the price, the distance to it and the Dow theory direction. Touch counts and break records describe what happened on the past chart. They do not tell whether price will

Sign@l12 : one indicator, many signals, your settings.
Sign@l12 puts the levels smart money traders usually mark by hand on one clean MT4 chart: liquidity, market structure, fair value gaps, supply and demand, sessions and VWAP. It keeps them on the chart while they matter, shows clearly when one is filled or swept, and alerts you when enough of them line up. It has many signals, and each one can be switched on or off and fine tuned to the way you trade.
The default settings are built for sc

Overview This indicator marks market structure on the chart of any symbol and timeframe. It finds swing highs and swing lows, labels each swing, connects the swings with a line, and marks when price closes beyond the last swing. Each event can trigger its own alert, and each alert can be switched on or off in the inputs. The indicator is a charting and analysis tool. It does not open or close trades, and it does not predict price. What is drawn on the chart Each confirmed swing receives one of
FREE

Pulse Trade Indicator MT4 Intelligent Trading. Disciplined Management. See where Pulse Trade detects a qualifying opportunity and how its initial stop reference is positioned. See signal timing and the initial stop-loss reference directly on the chart. Pulse Trade Indicator is a free MetaTrader 4 chart indicator built on the proprietary Pulse Trade research framework. Once a qualifying candle closes, it displays a clear LONG <price> or SHORT <price> label with a short entry-price reference line.
FREE

Goldcrest Indicator MT4 — Free BUY, SELL and Initial SL Levels Goldcrest Indicator MT4 is a free, standalone MetaTrader 4 indicator that marks qualifying BUY and SELL signals with their entry prices and initial stop-loss (SL) reference levels. It brings Goldcrest's multi-timeframe structural signal framework to a clean, easy-to-read MT4 chart, without executing trades. Key Features Live entry signals: clear BUY and SELL chart labels with the observed broker Ask price for BUY and Bid price for SE
FREE

The MTF Trend Dashboard indicator is a visual technical analysis tool designed for MetaTrader 4 that centralizes the trend status of all timeframes into a single separate window below the main chart. Instead of forcing you to constantly switch charts (from M5 to H4, D1, etc.) to check the macro trend, the indicator calculates real-time crossovers and maps the situation as a graphical matrix of colored bars.
Here is a detailed description of its operation and structure: Visual Structure and O

Footprint Engine MT4 is a synthetic technical analysis tool that provides an "X-ray vision" look inside a standard candlestick dataset.
Three Visualization Modes Bid/Ask (Classic): A two-sided profile displaying estimated buy and sell tick-volume distribution at each price level, reconstructed from 1-minute OHLC and tick-volume bars. Delta (Net Aggression): A focused one-sided profile highlighting the Net Delta (market buys minus market sells) reconstructed from 1-minute OHLC and tick-volu
FREE

A line-by-line port of "Range Filter Buy and Sell 5min" : original Range Filter by DonovanWall simplified version by guikroth Pine v5 update by tvenn It is published as open source on TradingView. All credit goes to those authors. The logic is exactly the original's: Smoothed range = EMA(EMA(|close − close[1]|, period), 2 × period − 1) × multiplier. Each EMA is seeded with an SMA, the same as ta.ema . Range filter: the line stays put until price moves beyond it by more than the smoothed range, t
FREE

A line-by-line port of "Chandelier Exit" , 2019-present Alex Orekhov ( everget ), distributed under the GPL-3.0 license. The original is published on TradingView. This port is released under the same license. The logic is exactly the original's: ATR = multiplier × ta.atr(length) (Wilder RMA, seeded with an SMA). Long stop = highest(close or high, length) − ATR. It only moves up while the previous close stays above the previous stop. Short stop = lowest(close or low, length) + ATR. It moves sym
FREE

Dual Scale Candles MT4 draws a second symbol's candles over your chart, with the second symbol's own prices on a separate left scale. Compare two instruments on one chart. The overlay uses a linear price mapping to fit the second symbol to the chart. Choose alignment at the first available bar of the current day or week, at the oldest drawn bar, or choose Range Fit. Day and week modes show a vertical anchor line. If the beginning of the period is not loaded, the label identifies the partial peri
FREE

Adaptive EMA Envelope
Adaptive EMA Envelope draws an exponential moving average and two symmetrical volatility bands on the main MetaTrader 5 chart. It uses the chart symbol and timeframe without symbol-specific presets.
The center line is an EMA of closing prices. The band distance uses Wilder-smoothed Average True Range. A separate True Range component allows the envelope to respond to sudden changes in a candle's range. Expansion response and contraction smoothing can be adjusted independe
FREE

A line-by-line port of "UT Bot Alerts" by QuantNomad (Pine v4, 2020). The idea is by HPotter and the first version by Yo_adriiiiaan. The original is published as open source on TradingView. All credit goes to those authors. The logic is exactly the original's: ATR is atr(c) = Wilder RMA seeded with an SMA. The built-in iATR is not used. Trailing stop follows the original nested iff / nz recursion: It ratchets up while price stays above the stop. It ratchets down while price stays below the stop.
FREE

ATR Ratchet is an ATR-based indicator similar to the indicator commonly known as Supertrend. It uses adaptive price boundaries to calculate its plotted levels. Experimental indicator: This is a test version. The default parameters have not been optimized or validated, and no particular settings or performance results are implied. Use for testing and evaluation only.
FREE

Click Anchored VWAP An interactive multi-anchor VWAP indicator that lets you place anchors directly on the chart with a single click. The Volume Weighted Average Price is calculated and drawn from the selected candle forward in real time. Click any existing VWAP line to remove it instantly. You can place multiple independent VWAPs at the same time, each with its own color, line width and style.
FREE

Matrix Trend Pro (Free Edition) Matrix Trend Pro Free is a clean, reliable, and powerful trend-following indicator designed for MetaTrader 4. Built around a customized multi-period logic and institutional volatility channels, this free edition helps you instantly identify market direction and key operational zones without cluttering your workspace. Key Features Dynamic Trend Line: Powered by a customized moving-average algorithm that tracks primary market dynamics and automatically changes st
FREE

Pattern Oracle is an all-in-one chart pattern engine for MetaTrader. It scans three zigzag levels at once, finds more than 30 harmonic, chart, continuation and reversal patterns, scores every setup and draws a complete trade plan with entry, stop-loss and two take-profit levels. A built-in teaching mode explains every pattern right on the chart. Pivots are only used once they are confirmed and every decision is made on a closed bar, so signals do not repaint . Patterns detected Reversal : Double

Quantum Edge is a machine-learning trend and signal indicator for MetaTrader. It combines a Lorentzian-distance k-nearest-neighbours classifier, a rational-quadratic kernel regression cloud and a multi-timeframe trend filter into one clean chart tool, then turns the result into clear, tiered BUY and SELL setups with ready-made stop-loss and three take-profit levels. Every signal is calculated on closed bars only . Once a label appears on the chart it stays exactly where it is: no repainting, no

MNFM Gold Conditions MT4
A read-only Gold/USD technical context indicator. It combines completed H1 and M15 candle readings with live spread information in one chart panel. It does not execute trades or estimate a probability of profit.
Dashboard - H1 direction from close versus EMA50, EMA50 versus EMA200, EMA50 slope and directional movement (+DI/-DI). - H1 ADX14 strength and whether the reading is rising or falling. - M15 momentum: three-bar close change normalized by ATR14, confirmed by RSI

Rocket Two – Entry Point Indicator for MT4 Identify Market Direction. Track Dynamic Stops. Recognize Potential Entry Opportunities. Rocket Two is a technical analysis indicator for MetaTrader 4 designed to help traders identify potential changes in market direction through dynamic stop levels and visual Buy/Sell signals. With a clear chart display and configurable parameters, Rocket Two helps traders monitor market trends and evaluate potential trading opportunities across different financial in

Velocitra Aurum Signal Pro - Gold Signals and Dashboard Non-repainting BUY/SELL signals for XAUUSD with a 6-factor confluence score, ATR-based stop loss, three take-profit targets, a multi-timeframe trend matrix and a live trade-advisor dashboard. Velocitra Aurum Signal Pro is a signal and dashboard indicator built specifically for Gold (XAUUSD). It combines trend, momentum and higher-timeframe structure into one confluence score, then gives clear BUY / SELL signals with ready-made stop loss and

The indicator provides fast and reliable alerts whenever price reaches your selected levels. Ideal for scalping,swing or day trading. It provides for multiple Support & Resistance Price Levels (Horizontal Lines) and also multiple manually drawn diagonal trendlines. Provides time delay for next alert when price level hit. Prevents repeating alerts if price moves quickly. Optional Email and push alerts to mobile phone. Excellent for monitoring direction of Live Trades. Installation.
Features:

Aurex Automatic S/R Cleaner Charts. Smarter Levels. Automatic Support & Resistance. Aurex Automatic S/R is a custom MetaTrader 4 indicator designed to automatically identify and display significant support and resistance zones directly on your trading chart. Instead of manually searching through historical price action and drawing levels yourself, Aurex Automatic S/R analyses confirmed swing highs and swing lows, groups nearby price levels together and displays the most relevant areas as clearly

Quantum MTF target indicator based on Tukey distribution. Scans M1, M15, H1 with zero lag. Projects precise reversal and Take Profit levels directly on your chart.
TimeFrame Radar — Multi-Timeframe Target Radar TimeFrame Radar is a professional indicator that builds mathematically sound volatility target zones in real time, projecting them into the future chart space. The indicator is based on non-parametric statistical analysis of price distribution. The Radar completely abandons classic avera

Follow Arrow Signals: Follow Arrow Signals plots two smoothed trend lines on the chart and marks each crossover between them with an arrow. The two lines EMAs. It is smooth and reacts quickly, with very little lag for its smoothness. It can optionally be calculated on a higher timeframe and shown on the current chart. centred triangular moving average of the weighted price (2×Close + High + Low) / 4. It gives a clean, flowing read of the price swings. The live bar uses a short weighted average,

Matrix Trend Pro Suite Matrix Trend Pro Suite is a cutting-edge, all-in-one trading system designed for MetaTrader 4. It combines multi-timeframe trend analysis, volatility channels, and automated risk management into a single, clean workspace. Whether you are looking to capture strong market trends or optimize your risk-to-reward ratio, this suite provides institutional-grade insights directly on your chart. Key Features & Capabilities Dynamic Trend Line: Powered by a customized moving-avera

Wolfram is a mathematical indicator built on the basis of discrete cellular automata. The product is designed specifically for traders seeking to completely eliminate the lag of standard indicators and detect the moments when major impulses originate before they are displayed on the price chart. Fundamental Logic and Operating Principle The algorithm is based on a byte-by-byte analysis of the local market structure without using classic moving averages and oscillators. The indicator operates
FREE

Short description Set your risk as % of balance, % of equity or a fixed amount, drag the Stop Loss / Take Profit lines (or type the SL in points), and read the correct lot size for the symbol, the money at risk, the reward, R:R and the margin needed. Calculator only: it never places orders. Full description Sizing every trade by hand is slow and easy to get wrong, especially on gold, indices and JPY pairs where a point is worth different amounts. ClearSpec Risk & Lot Size Calculator does the mat

FVG DGT Panel [TMT] — Fair Value Gap and Inverse FVG Indicator with Live "% Left" Fill Tracking for MetaTrader 4 Version for MT4 | Non-repainting zone logic | BUY / SELL / NEUTRAL bias panel | FVG + IFVG | Optional second timeframe 1. Overview FVG DGT Panel [TMT] is a chart-window indicator for MetaTrader 4 that finds, draws and tracks Fair Value Gaps (FVG) and Inverse Fair Value Gaps (IFVG) directly on your price chart. It is a MetaTrader 4 port of the popular "Fair Value Gaps by DGT" concept

Zero Lag Real Trend Signals (MTF) — Zero-Lag Trend Line, Volatility Bands, Entry Arrows, Alerts and a 9-Timeframe Trend Panel for MetaTrader 4 Zero-lag basis | ATR deviation bands | Trend flip arrows | Pullback entry arrows | Popup alerts | Multi-timeframe panel 1. Overview Zero Lag Real Trend Signals (MTF) is a chart-window indicator for MetaTrader 4. It draws a zero-lag moving average (the "basis") surrounded by volatility bands, colors the chart according to the current trend, marks trend cha

Dual Slope Moving Averages & Support | Resistance Dashboard
Professional Institutional-Grade Indicator for MetaTrader 4 (MT4)
Transform your chart analysis with Trend Bars With Moving Averages, an elite institutional utility engineered by a professional C++ systems programmer. Designed for high-speed MQL4 execution, this indicator blends multi-slope Moving Average color-coding with a built-in, interactive Support & Resistance Reversal Dashboard.
Whether you trade Forex majors or index futures,
FREE
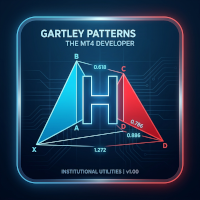
Gartley Patterns (Harmonic Scanner)
Gartley Patterns is an institutional-grade technical overlay engineered to automatically map complex harmonic price structures and swing imbalances across active execution cycles. By processing market geometry dynamically through strict multi-timeframe swing filters, this utility completely eliminates manual calculation errors and gives traders an instant visual panel of high-probability reversal zones on a single chart window.
Utilizing specialized sing
FREE

Introducing EB&SS for MetaTrader 4
MT4 Version = https://www.mql5.com/en/market/product/204221 MT5 Version = https://www.mql5.com/en/market/product/204207
Accurate and non-repainting BUY & SELL signals based on Moving Average activity. Featuring ENMA, a custom MA developed by Encrypted Eyes.
How it works: Select your MA Type: This indicator features an extensive list of Moving Averages that suits every trader. Define the MA Length: The quantity of signal diminishes as the length is increa
FREE

MTF Simple Moving Average (Free Institutional Moving Average Overlay)
The Multi-Timeframe Simple Moving Average (MTF SMA) is an institutional-grade technical utility designed to project higher-timeframe trend baselines directly onto your lower-timeframe execution charts. Developed by a C++ systems programmer specializing in high-speed MQL4 architecture, this indicator provides traders with seamless market structure visibility without requiring multiple open windows or manual chart toggling.
FREE

The EMA Trader System is a technical overlay designed to isolate trend continuation and structural balance across active execution cycles. By processing price action dynamically through multi-timeframe moving average thresholds and robust slope filters, this utility completely eliminates calculation delay and gives traders an instant visual HUD dashboard of live trade signals on a single window.
Utilizing specialized single-pass memory arrays, this system tracks multi-period EMA loops and highe
FREE

TPO Session Letters MS draws a classic Market Profile with letters (A, B, C …) for one cash session per day, directly on the MetaTrader 5 chart. By default it is set up for the Xetra session of the German index (09:00–17:30 Frankfurt time); any other session can be configured in the inputs. You enter the session in its own time zone (Frankfurt, London or New York). The indicator converts it to your broker's server time separately for every day, including the weeks when Europe and the USA change

Votre indicateur fonctionne-t-il vraiment, ou est-il seulement beau sur l'historique ? Version 1.10 : nouvelle courbe de résultats sur le panneau Courbe de résultats en R après coûts, verte quand l'indicateur gagne et rouge quand il perd, avec total, nombre de trades et dates. La version Pro montre aussi la courbe avant coûts, le pire drawdown et le test hors échantillon. TravaRisco Signal Checker est un test gratuit et honnête pour tout indicateur MT4 qui dessine des flèches d'achat/vente. Plac
FREE

Ribbon Pilot — Ruban de tendance avec zones de trade, historique des signaux et liste de surveillance À quoi il sert Ribbon Pilot est un indicateur de graphique pour MetaTrader 4 qui montre la direction de la tendance d'un coup d'œil, marque les signaux d'entrée par des flèches et trace immédiatement un plan de trade complet : entrée, stop et jusqu'à quatre objectifs de profit. Il tient aussi des statistiques sur les signaux récents et permet de parcourir d'autres instruments sans quitter le gra

Fulcrum Value Profile est un indicateur MetaTrader 4 qui construit un profil de volume en ticks pour chaque session, marque son Point of Control (POC) et sa zone de valeur, trace les POC/VAH/VAL en développement sous forme de lignes, suit les POC vierges (naked POC) et signale deux configurations sur bougies clôturées : retour dans la zone de valeur précédente (règle des 80%) et acceptation hors de celle-ci (cassure). Il n'ouvre, ne modifie et ne ferme jamais de positions. Démarrage rapide Place

Arrêtez de deviner la taille de lot. TravaRisco Lot Calculator affiche directement sur le graphique le lot exact pour le risque choisi. Fonctionnement : Saisissez votre risque en % et le stop loss en points dans le panneau. L'indicateur calcule instantanément : Montant risqué (dans la devise du compte) Perte pour 1 lot avec ce stop loss Lot exact, arrondi au pas de volume de votre courtier Risque réel après arrondi Fonctionne sur le forex, l'or, les indices et les cryptos, avec les valeurs de ti
FREE

Votre compte démo vous ment. Sur un compte démo, vos ordres sont exécutés exactement au prix demandé. Sur un compte réel, non. Le spread s'élargit pendant les annonces, les commissions s'accumulent et le slippage grignote chaque trade - et rien de tout cela n'apparaît clairement dans l'historique de MetaTrader. TravaRisco Real Cost Monitor vous montre, sur le graphique, ce que vous coûte réellement le trading de ce symbole. CE QU'IL AFFICHE 1. Spread Spread actuel, en points, en prix et en argen
FREE

Break and Retest Hunter MT4 is a powerful MetaTrader 5 indicator designed to automatically identify support and resistance levels, breakout structures, and potential retest opportunities in real time. Bonus Indicator: After purchasing Break and Retest Hunter , contact me to receive Trade Indicator Assistant EA completely free as a bonus utility.
$65 for the next 10 copies . Next price is $120. Combining adaptive market analysis, clear BUY/SELL signals, Fibonacci-based profit targets, and a pre

Apex Patterns PRO Achetez l'indicateur - Obtenez GRATUITEMENT l'Expert Advisor basé sur celui-ci. Intelligence auto-optimisée des figures chartistes et des cassures Les scanners de figures traditionnels s'appuient sur des paramètres fixes, sous-performant souvent lorsque la volatilité et les structures du marché changent. Apex Patterns PRO est conçu pour s'adapter aux conditions changeantes du marché en combinant la reconnaissance des figures chartistes structurelles, le filtrage du momentum et
123456789101112131415161718192021222324252627282930313233343536373839404142434445464748495051525354555657585960616263646566676869707172737475767778798081828384858687888990919293949596979899100101102103104105106107108109110111112113114115116117118119120121122123124125126127128129130131132133134135136137138139140141142143144145146147148149150151152153154155156157158159160161162163164165166167168169170171172173174175176177
Le MetaTrader Market est le meilleur endroit pour vendre des robots de trading et des indicateurs techniques.
Il vous suffit de développer une application pour la plateforme MetaTrader avec un design attrayant et une bonne description. Nous vous expliquerons comment publier votre produit sur Market pour le proposer à des millions d'utilisateurs de MetaTrader.

Vous manquez des opportunités de trading :
- Applications de trading gratuites
- Plus de 8 000 signaux à copier
- Actualités économiques pour explorer les marchés financiers
Inscription
Se connecter
Vous acceptez la politique du site Web et les conditions d'utilisation
Si vous n'avez pas de compte, veuillez vous inscrire