 MetaTrader 5
 Experts
 Indicateurs
 Bibliothèque
 Utilitaires
 Widgets
 Règles
Regardez les tutoriels vidéo de Market sur YouTube
Comment acheter un robot de trading ou un indicateur
Exécutez votre EA sur
hébergement virtuel
hébergement virtuel
Test un indicateur/robot de trading avant d'acheter
Vous voulez gagner de l'argent sur Market ?
Comment présenter un produit pour qu'il se vende bien
Expert Advisors et indicateurs gratuits pour MetaTrader 4 - 43
 Les robots de trading effectuent automatiquement les transactions sur le marché, tandis que les indicateurs vous permettent de mieux analyser les cotations et de prédire le comportement des prix. Grâce à ces applications, vous serez en mesure d'effectuer des transactions dans MetaTrader 4 de manière plus avisée, tout en saisissant davantage d'opportunités.
This simple but useful script calculates the lot in % of the deposit. It is indispensable for risk management. There is only one customizable parameter: MaxRisk - risk in % for lot calculation. The product works as a standard script. Launch it once on an appropriate chart and start trading using the calculated lot value. Genious is simplicity! Happy trading!
FREE

IceFX Heatmap is a special indicator that shows the places where the price has been staying and ranging over the past few days. These sites will be displayed in a "Heatmap style", with which you can clearly see the main formed bands. The main rates (where the price has "lingered/stayed" much) are indicated in bright colors (in case of black-and-white view) or red color (in case of color view).
Settings Days - the number of days the heat(map) is calculated for. Resolution - resolution rate. 10 =
FREE
Chart Link MT4 allows you to control multiple charts from one chart or multiple charts from multiple charts. Features 1. Synchronised Scrolling : Scrolling the master chart also scrolls all linked sub charts to the same position. Sub charts inherit offset and auto-scroll settings from the master chart. 2. Synchronised Timeframe : Switching the master chart timeframe also switches all linked sub charts. 3. Synchronised Symbol : Switching the master chart symbo
FREE

A Moving Average (MA) Trading Expert Advisor (EA) for MetaTrader 4 (MT4) is an automated trading system designed to execute trades based on signals generated by one or multiple moving averages. Moving averages are a popular technical analysis tool used to smooth out price data and identify trends. Here's a description of how a Moving Average Trading EA typically operates: Moving Averages Used : The EA utilizes one or more moving averages to generate buy or sell signals. Common choices include t
FREE
Indicateur Average Directional Movement Index (ADX) avec support multi-timeframe, signaux visuels personnalisables et système d'alertes configurable.
Les services de programmation freelance, les mises à jour et autres produits TrueTL sont disponibles sur mon profil MQL5 .
Les retours et avis sont très appréciés !
Qu'est-ce que l'ADX ? L'Average Directional Movement Index (ADX), développé par J. Welles Wilder, est un indicateur technique utilisé pour mesurer la force d'une tendance, quelle que
FREE

RSI based trend strategy for EURUSD. EA use both 5 minutes and 15 minutes time frames to find trends. Please use 15m timeframe for best optimization in EURUSD pair. Inside EA, we have 10 another variables and all of them are optimized for EURUSD even starting StopLoss, Take Profit and Trailing Stop Loss values. StopLoss = 57 Take Profit = 0 TrailingStop = 0 are best optimized values. You can edit these values if they're not suitable. Invisible variables will be updated every month to
FREE
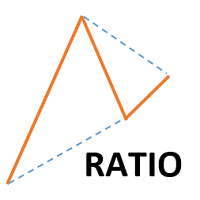
This indicator shows ratios between extremes on the chart. You can specify your own ratios (e.g. Fibonacci).
Parameters Most important Density - how much in details to search ratios in extremes. Bigger number means less details, smaller number means more details. Base unit is 1 bar on the chart. History - how far to go in history while searching. When you set -1, the indicator processes all bars from history. Base unit is 1 bar on the chart. Range - how far search ratios from given extreme. Bas
FREE

Après 7 ans, j'ai décidé de mettre gratuitement à disposition certains de mes propres indicateurs et Expert Advisors (EA).
Si vous les trouvez utiles, merci de soutenir avec une évaluation à 5 étoiles ! Vos retours encouragent la continuation des outils gratuits. Découvrez mes autres outils gratuits ici
_________________________________ Indicateur ATR avec Bandes pour une Analyse Avancée de la Volatilité du Marché Forex Présentation de l'indicateur ATR avec Bandes, développé avec
FREE

L'indicateur R Wavy Dash transforme les données de prix en un excellent indicateur de signaux de suivi de tendance qui fonctionne pour l'entrée et la sortie des échanges. Il apparaît dans le graphique principal sous la forme d'une ligne de signaux colorée et peut être utilisé comme un outil de trading autonome.
L'indicateur R Wavy Dash est très fiable, léger et ne ralentira pas votre plateforme de trading.
Points clés Indicateur de signal de tendance Convivial pour les débutants Non-repeint C
FREE

This EA trades the forex markets by a specific combination of ATR and parabolic SAR indicator signals and transaction management. the EA has stop loss and take profit. minimum trading account 500.
default settings for GBPUSD 1h. settings for optimization: ATRperiod lot sarStep sarMaximum tpFactor slFactor this EA(){ operates once per bar; fast methods of optimization are valid(){ user can optimize by model (control point); || (open prices only); }}
developed, tested and optimi
FREE

Vitals shows the state of your trading account on a single screen: balance and margin, current risk, open positions, market ranges, results by period, and a statistics panel, arranged on one grid so the figures can be read at a glance rather than gathered from several terminal windows. Vitals is a display panel. It does not place, modify or close orders. Floating drawdown A history report records what a position earned. It does not record how far the account moved below its balance while that po
FREE
MQLTA Support Resistance Lines is an indicator that calculates the historical levels of Support and Resistance and display them as Lines on chart. It will also Alert you if the price is in a Safe or Dangerous zone to trade and show you the distance to the next level. The indicator is ideal to be used in other Expert Advisor through the iCustom function. This DEMO only works with AUDNZD, the full product can be found at https://www.mql5.com/en/market/product/26328
How does it work? The indicator
FREE
[Deviation of each indicator MT4] is a collection of 18 indicators, and one of them can be arbitrarily selected to participate in the calculation. It can calculate the deviation form of each indicator and can prompt an alarm.
Parameter setting description:
[indicators] is to choose one of the 18 indicators to participate in the calculation (this parameter is very important) .
[period] is a common cycle for each indicator.
[Method] is the MA mode of some indicators.
[Apply_to] is the applic
FREE

The presented product is a trend indicator of technical analysis that allows you to open a position at the very beginning of a significant price movement. The most important qualities of the presented indicator are: The ability to follow the trend for as long as possible to get all the potential profit; Minimization of potential losses in case of a trend reversal or significant correction. The indicator has a wide range of customizable parameters allowing it to be used effectively in any market.
FREE
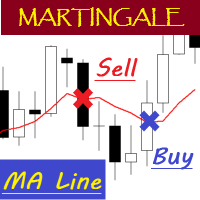
EA "MA Line" with martingale feature
To see how EA works, please watch the video below. In the video, I perform parameter optimization and do a backtest. The parameters that are optimized are: - MA Period - Stop Loss - Take Profit
For the future, I will try to optimize and test EA, especially the expert advisors in the mql5 community. hopefully it can be useful for colleagues in the mql5 community.
FREE

Entry logic The EA, called EA_BreakTheBox, creates a rectangle BOX based on the highest and lowest price within a certain time period. Once the BOX is formed, the EA is ready for entry. It allows you to input the time period for forming the BOX, and you can set a time filter for the EA. The default setting for EntryPips is 2 pips, but this can be changed. If the price breaks the upper price of the BOX by 2 pips, then a BUY Entry is placed (if Reverse mode=true). If the price breaks the lower pri
FREE

Trading information panel with risk calculator, order management, fractal trend indicator, and customizable keyboard shortcuts for quick trading.
Features: Real-time trading information display (spread, ATR, swap, price levels, etc.) Integrated risk calculator with three modes (lot size, money risk, point distance) Quick order management with keyboard shortcuts (buy, sell, close, half close) Multi-timeframe fractal trend indicator (shows price position relative to fractal high/low) Adjustable
FREE
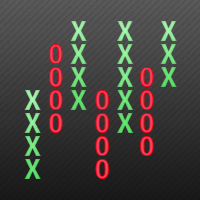
This indicator displays Point & Figure charts (PnF charts) in the indicator window. PnF charts show only price movements that are bigger than the specified box size. It helps to eliminate noise and allows focusing on main trends. Time is not a factor here. Only price movements are taken into account. That is why PnF chart is not synchronized with the main chart it is attached to. More about PnF charts: http://stockcharts.com/school/doku.php?id=chart_school:chart_analysis:pnf_charts Indicator wor
FREE

AutoOrderModify Free is a supporting tool for all Manual and System Forex Traders. It works perfectly for situations like: “I have a nice EA but lacks the Trailing and/or Break Even.” “I’m lazy to calculate SL and TP every time I open a position.” “I want to control all of my manual trades with Trailing/Break even” Anyone interested in this tool but want more function, please try the “ AutoOrderModifyEA Pro ”. The freeware version can’t manage positions by Magic Number but manage ALL positions.
FREE

RSIBandsTREND is a custom trend-focused indicator that enhances the classic RSI approach by visualizing dynamic upper and lower bands based on RSI calculations.
It plots three clean bands (upper, lower, and midline) directly on the chart, helping traders identify overbought and oversold zones with precision. Features: Three-band system: upper, lower, and center RSI lines EMA-smoothed RSI band calculation Clear trend zone visualization on chart Works on all timeframes (M1 to Monthly) Fully opt
FREE
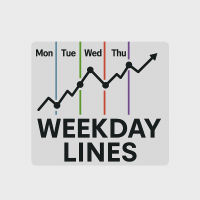
Boost your technical analysis with our Weekday Lines Indicator — a powerful yet lightweight tool designed for traders who want to clearly visualize daily market structure.
Key Features: Auto Draws Vertical Lines for each trading day: Monday through Friday
Customizable Colors & Styles to match your chart theme
Day Labels (Mon, Tue, etc.) appear next to lines for easy tracking
Works in All Timeframes — especially useful in intraday and swing trading
No Lag, No Clutter – just clean, prec
FREE

SAYON Trade Copier copie les trades entre comptes MetaTrader sur le même ordinateur ou VPS : MT5 → MT5, MT4 → MT4, MT4 → MT5 et MT5 → MT4 .
Un seul EA pour les deux rôles : réglez-le en Master sur le compte qui envoie les trades et en Slave sur les comptes qui les copient. Le rôle se change aussi depuis le panneau. GRATUIT et complet. Toutes les fonctions incluses, sans limite de symboles ni de durée.
Pour copier vers ou depuis des comptes MT5 , il faut aussi SAYON Trade Copier MT5 sur les termi
FREE

See Your Key Trading Measurements at a Glance Smart Pips Meter is a free utility that displays important market measurements directly on your chart—so you can make faster trading decisions without manually calculating pip distances. WHAT IT SHOWS ADR (Average Daily Range)
See the current ADR pip value directly on your chart. Current Candle Size
Instantly see the size of the current candle in pips. Previous Candle Size
Quickly check the size of the last completed candle. Spread
FREE

The tool that will help you calculate the lot accurately for the risk you need, if you want to risk 1% of your account, just enter the entry, target and stop values and you will have the lot size to use and only lose the chosen percentage. You can also choose a fixed value. This tool will help you with consistency, because you can only be consistent if you operate consistently and enter with fixed loss values, it is an INFALLIBLE way to be consistent!!!!
FREE
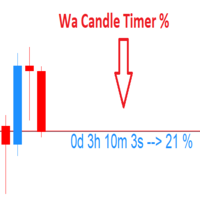
Wa Candle Timer Percentage MT4 est un indicateur qui montre à l'utilisateur combien de temps il reste avant l'ouverture de la prochaine bougie. Le pourcentage d'évolution de la bougie actuelle est aussi montré sur l'écran. L'utilisateur peut configurer le pourcentage auquel le candle timer changera de couleur. Voici les paramètres: 1 - Le pourcentage auquel le candle timer changera de couleur. 2 - couleur de la minuterie de la bougie, quand le pourcentage d'évolution de la bougie actuelle est
FREE

Description:
EquityStop UAP is the solution designed to optimize the management of your forex operations securely and efficiently. Our software provides a superior level of control and protection for every trade.
*Key Features:*
1. **Equity Protection:** Preserve your capital with our advanced Equity Stop feature, applying an automatic safety barrier to limit losses.
2. **Percentage Trailing Stop:** Maximize your profits and minimize losses with the Percentage Trailing Stop feature, dynam
FREE

# FORBEX Market Watch Trading Hours
## Professional Market Session Monitoring for MetaTrader 4
FORBEX Market Watch Trading Hours is a powerful MT4 dashboard EA, designed to provide traders with a complete real-time overview of market opening and closing schedules across Forex pairs, Indices, Commodities, Metals, Cryptocurrencies, and other broker-supported instruments.
The dashboard automatically scans all symbols available in Market Watch and displays their current trading status, live sess
FREE

This MQL4 indicator creates a customizable grid of horizontal lines on your trading chart. Here's what it does:
**Main Functions:** - Draws equally spaced horizontal lines across the visible price range - Supports two line types: horizontal lines or trend lines with forward projection - Automatically adjusts to price scale changes
**Key Features:** 1. **Customizable Spacing**: Set grid distance in pips (20 pips by default) 2. **Flexible Starting Point**: Auto-calculates starting price or lets
FREE
The Symbol Changer Indicator for MT4 is an amazing tool to switch and display any desired currency pair chart and any time frame. Forex traders can display the desired charts with the click of a mouse directly from any open chart. The symbol changer indicator for Metatrader is an essential tool for trend traders working with a top-down approach.
The symbol changer indicator shows all the available trading instruments in the market watch window. It also displays all the currency pairs as buttons
FREE
Индикатор предназначен для разметки ,фибо уровней и фибо зон.Также есть возможность удаления и редактирования уровней на текущем графике. При установке нескольких индикаторов (FIBO-ZONES)на график,не забывайте менять имя в поле (NAME).В утилите также есть возможность менять цвет зон, толщину линий и стиль линий уровней фибо. При установке индикатора ,зоны выстраиваются автоматически.
FREE
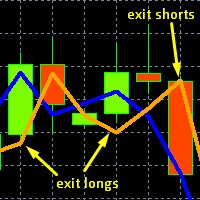
This is the original, simpler version of our core EURUSD algorithm (it calculates and displays 2 lines rather than 3), but it is still capable of detecting levels in the market where EURUSD will likely move to. These levels are indicated by unusual large gaps, formed by the two lines. Detailed guidance is given to users. All in all it works on the very short term, and more importantly on the daily chart. The differences between this and our top EURUSD indicator, is that this one only displays
FREE

Harami is a two candle pattern with recent candle formed inside the previous candle's high and low . It represents indecision in the market and is used for breakout price action trading strategy. This indi fires all signals to a dashboard on the chart including pop_up alert, push to phone notification and email. Harami has two types, bullish and bearish pattern. Enter long for bullish Harami and enter short for bearish Harami. Inputs : Currency Symbols: EURUSD,GBPJPY,USDJPY,USDCAD (default) , u
FREE

In FX, signals from doji patterns can be effective in capturing potential trend developments. Therefore, setting pending orders simultaneously after the appearance of a doji can make it easier to capture the onset of a trend.
Setting stop-loss (SL) and take-profit (TP) levels more widely can enhance the probability of success, but it also increases the associated risk.
In the event of a loss, it is possible to recover by increasing the next position size through multi-lot trading, but this str
FREE

The indicator looks for market Highs and Lows. They are defined by fractals, i.e. the market creates the indicator algorithm and structure, unlike ZigZag having a rigid algorithm that affects the final result. This indicator provides a different view of the price series and detects patterns that are difficult to find on standard charts and timeframes. The indicator does not repaint but works with a small delay. The first fractal level is based on the price, the second fractal level is based on t
FREE
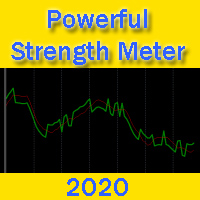
Powerful Strength Meter - a trend direction indicator. The indicator measures the strength of the trend and shows the trader signals in the form of two lines: red and green. Indicator signals are very easy to read. If the green line crosses the red line up - this is a buy signal. This means that now the price will go up. If the green line crosses the red line from top to bottom - this is a sell signal. The larger the time frame, the more accurate the indicator signals. You can also, for example
FREE

The indicator draws two types of Bill Williams' fractals: Broken fractals – the price has been at least once above or below these fractals. Unbroken fractals – new fractals where the price has not yet moved above or below them. You can configure the color of the fractals, as well as the number of bars used for the indicator's display.
фрактал Вильямса фрактал БВ фракталы Вильямса пробой фрактала пробитый фрактал Торговый хаос broken fractal unbroken fractal Williams fractal Trading Haos
FREE

Features at a Glance Multi-Band System: 4 bands above and below a center line, creating 9 distinct layers ALMA-Based Center Line: Smooth, responsive moving average that filters noise effectively Volatility Bands: Automatically adjusts to market volatility using Standard Deviation Keltner Channel Integration: Blends ATR-based channels with standard deviation for robust band placement Alert System: Get notified when price crosses key band levels
Read in detail with screenshots in blogpost: https
FREE

Standard RSI uses a fixed smoothing factor. Every bar gets the same weight whether the market is trending cleanly or chopping sideways. That is why most RSI signals fail during consolidation. Mystical RSI measures how chaotic price action is on every bar using the Fractal Dimension Index and dynamically adjusts its smoothing in real time. When the market trends, it reacts fast. When the market chops, it slows down and filters out noise. No manual adjustment needed. How It Works The indicator
FREE
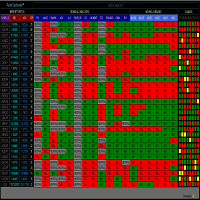
RADAR DASHBOARD
The Radar Dashboard shows the current "Trend Feeling" of each symbol based on the key indicators from the Classic Technical Analysis. As more indicators shift from Sell to Buy, it is suggested that the Trend is now Up (buy). As more indicators change from Buy to Sell, it is suggested that the Trend is now Bearish (sell). The interpretation by the columns of "CANDLES" can also show us possible reversals or pullbacks. For example: A large amount of red squares in H4 (bear candle)
FREE
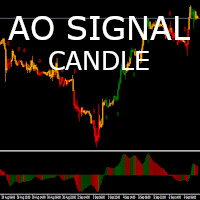
The Awesome Oscillator (AO) Signal Candle Indicator is an indicator used to measure market momentum. Awesome Oscillator (AO) Signal Candle Indicator will change bar's color when set overbought or oversold levels reach. Colored Candles, based on Awesome Oscillator (AO) Signal.
-If the indicator is above zero, the market is bullish. -If the indicator is below zero, the market is bearish. -If the market is bullish, you can take a stand with green candle signals. -If the market is bearish,
FREE
A free program for copying orders between terminals on the same computer.
Any orders are copied in any direction, between any accounts.
The principle of operation:
On the terminal from which you want to copy, the "Server" parameter is set. On the terminal or terminals where the copied positions need to be opened, the "Client" parameter is set. It is also necessary to enter the account number of the "Server" terminal on the client.
In the future, it is planned to increase the functionality
FREE

T I P T O P
Tiptop is a trend following Expert Advisor that runs its own proprietary analysis and algorithm. No indicator is used to analyze the entry point. It based it only with each price bar movement and closing price. Same logic with "Volatility Watcher". For the exit plan, it uses the proprietary Sequence Method and implement the cut-losses-and-let-the-profit-run strategy. You will be surprised that at the closing of all trades, almost most of them are having a positive p
FREE

A Market Watch multi-timeframe ATR dashboard that turns a chart into a full-screen table showing each selected symbol’s recent volatility across multiple timeframes. It calculates ATR for the symbols visible in Market Watch, then displays the result in pips, points, or raw price units. Its practical use is volatility scanning, quickly finding instruments and timeframes that are moving enough—or quietly enough—for your trading style. Period that is worth using Sty
FREE
This trading advisor works with strong movements of currency pairs. He can use different indicators for trading, calculate and draw trend lines according to the extremes of the price movement. It is a free, simplified version of ColdStream Expert Advisor, it has enough customizable parameters for optimization, but a little less than in the full version. Also, the maximum lot is limited to 0.1. Nevertheless, you can use almost any currency pairs and timeframes for trading. Do not forget to optimi
FREE

Indicateur Follow The Labels — C’est un indicateur MT4 multifonction conçu pour fournir aux traders une vue d’ensemble complète des conditions du marché à plusieurs dimensions. Il combine l’analyse de tendance, les niveaux du jour précédent, le momentum stochastique et les signaux de rejet dans une interface facile à lire. Fonctionnalités principales : Filtre de tendance MA200 multi-timeframe (H1→M15) Affiche l’alignement de la MA200 (LWMA) sur trois timeframes : H1, M30, M15. Affiche une étique
FREE
This indicator implements the logic behind Traders Dynamic Index to the classic MACD Indicator. It helps to find powerful trende changes and ignore meaningless ones. It is simply the classic MACD indicator plotted with volatility bands on top designed with the sole purpose of being able to ignore trend changes that do not follow an over-extension or over-contraction of the market. The indicator alerts on trend changes after the volatility bands have been breached and implements alerts of all ki
FREE
Trendy Stock is a price following indicator that uses Stochastic to show when the price is out of the oversold or overbought areas. The algorithm allows you to stay longer in a trend where the bulls or bears are in control. The indicator changes color immediately the price exits oversold/overbought state. In short, the downtrend [red] bars start to paint when the buying pressure decreases while the uptrend [green] bars form as the buy pressure kicks in. For MT5 version, follow :: https://w
FREE

[NEW RELEASE] Horse All in Signal – WinWiFi Robot Series ต้อนรับปีใหม่ 2026 ด้วยความมั่งคั่งและพลังที่คึกคักเหมือนม้าศึก! สัมผัสประสบการณ์การเทรดเหนือระดับกับอินดิเคเตอร์ตัวล่าสุดจาก WinWiFi Robot Series ในชื่อ "Horse All in Signal" เครื่องมือที่จะเปลี่ยนกราฟของคุณให้กลายเป็นสนามทำกำไร ด้วยระบบ AI อัจฉริยะที่สแกน Price Action ในทุกช่วงเวลา คุณสมบัติเด่น (Key Features): AI Price Action Engine: วิเคราะห์พฤติกรรมราคาแบบ Real-time แม่นยำทั้งในช่วงตลาดมีเทรนด์ (Trend) และช่วงพักตัว (Sideway)
FREE
This indicator filters the Zigzag indicator to calculate the main support and resistance
levels.
Variables
minimum gap between peaks : is the distance (GAP) between the peaks of
the Zigzag
peaks sensitivity : Minimum number of nearby peaks
look back: it means that it has to test the last 50 peaks in the Zigzag
object name perfix: a prefix for level’s line name on chart
FREE

Stochastic 3 Zonas Combina tres Stochastic configurables en una sola ventana para ofrecer una lectura rápida del momentum del mercado en diferentes velocidades ademas de poder configurar tus colores y periodos demanera mas rapida y configurables. El indicador muestra tres configuraciones principales: Stochastic rápido: 8,3,3 Stochastic medio: 21,10,10 Stochastic lento: 100,10,10 Cada Stochastic tiene sus propias zonas de color independientes, permitiendo detectar rápidamente cuándo el precio en
FREE
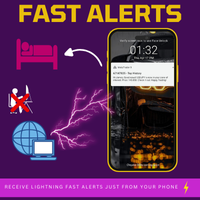
Fast Alerts MT4 — Achetez une fois. Soyez alerté pour toujours. Il fut un temps où être en avance sur les marchés signifiait s’abonner mensuellement à des plateformes coûteuses…
20 € ici, 50 € là — juste pour recevoir quelques alertes par jour. Vous ne payiez pas pour de la valeur — vous payiez parce qu’il n’y avait pas d’alternative.
Jusqu’à maintenant. Développé par un trader pour les traders, cet outil vous permet de définir des alertes sur n’importe quel prix qui vous intéresse — et vous ête
FREE

FORBEX Symbol Changer
One Click Away. If you experience any issues, have questions, or would like to learn more about the system and its methodology, please feel free to get in touch. Please contact me, and I will guide you through the entire installation process via AnyDesk to ensure everything is installed correctly and fully ready to use even before the purchase. FORBEX Philosophy Built by traders for traders, FORBEX tools focus on simplicity, efficiency, and practical workflow improvements
FREE
Trend indicator. The indicator identifies the major price movement trends and market them with different colors. It filters out and ignores the noise and short-term movements of the price against the main trend. This indicator is a tool that identifies the current trend in the market. With the default settings, the ascending ("bullish") trends are marked with green lines and the descending ("bearish") trends are marked with red lines. The indicator ignored sideways or flat movements, when the pr
FREE

This EA is a free version of Vino EA . Unlike the full version, the parameters cannot be changed and the lot size is set to 0.01.
Description Vino EA is a grid Expert Advisor using mainly customized oscillators to analyze the market prices and volatility in order to identify trend reversals. It uses a grid of orders which increases the lot size only after the stop loss is reached. It includes an automatic stop loss, which computes the stop loss value based on the volatility of prices.
Require
FREE

HIZOA Candle Statistics Objective Candle Structure, Market Activity and Pattern Recognition HIZOA Candle Statistics is a compact informational and educational indicator that provides a clear numerical view of the current candle and the most recently closed candle. Instead of producing buy or sell signals, the indicator helps traders understand the structure and relative activity of the candles currently shaping the market. By displaying the proportions of the candle body, upper wick and lower w
FREE

Effectue l'exportation de l'historique des transactions du compte de trading actuel. Le fichier est enregistré dans le dossier du terminal MQL4/Files ( qui peut être ouvert via le menu principal du terminal : Fichier -> Ouvrir le répertoire de données (Ctrl+Maj+D) et accédez au dossier MQL5/Fichiers) ou dans le dossier Common/Files du terminal. Le nom du fichier est généré automatiquement ou défini manuellement via les paramètres du script. Le fichier d'historiq
FREE

Trade Details Tracker is a lightweight yet powerful chart-panel designed to give traders instant visibility into their open positions. Instead of checking multiple terminal tabs, this indicator displays real-time trade statistics directly on the chart , helping you manage risk, monitor exposure, and make faster decisions. Key Features Real-Time Trade Overview
Instantly view Buy & Sell trade counts for the active symbol. Automatic Breakeven Calculation
Volume-weighted breakeven price for
FREE

Cherchez-vous à faire passer votre négociation d'actions au niveau supérieur?
Avec son algorithme intelligent et ses ordres d'experts, vous pouvez vous assurer d'avoir toujours une longueur d'avance. Réalisez des bénéfices sur les marchés haussiers et baissiers, prédisez facilement les tendances et restez au top de votre portefeuille d'investissement - avec Stock Flow, tout est possible !
Les ordres d'entrée et de sortie sont donnés par une combinaison de deux indicateurs que l'on peut trouve
FREE
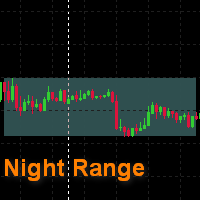
This is a simple indicator that draws a night range. The start and the end of a working day are specified in hours, color rectangles are adjusted as well. It helps to view the history in search for regularities , excluding unpredictable night time. It can be used to search for a breakthrough of the night range. It is drawn as a background , and does not cover a chart and other indicators .
FREE

MQLTA Candle Timer is an indicator that can show you the details about a symbol/pair and alert you before the close of a candle. Used in swing trading and not only, it can help your strategies knowing and be ready before the close of a candle.
How does it work Simply add the indicator to the chart and set the notifications options. You can load a minimalistic interface or a full interface. The alert will be sent once per candle.
Parameters All the parameters, that you can see in the picture, a
FREE

VolumEdge Pro Scanner: индикатор статистического анализа объёмов и волатильности
VolumEdge Pro Scanner — профессиональный инструмент количественного анализа для трейдеров, использующих статистические аномалии для поиска высоковероятных торговых сетапов. В отличие от стандартных индикаторов объёма, отображающих сырые значения или простые скользящие средние, данная утилита рассчитывает точные процентные распределения и отслеживает последовательности однонаправленных свечей для фильтрации рыночно
FREE
Altopium Trend is an indicator that identifies short-term trends. The signals it generates can be used to open long or short positions or can be integrated with other indicators/strategies. This is a trend indicator, be careful during narrow sideways phases. I recommend using it as a short-term trend indicator, complemented by other indicators that show the best times to enter the market.
Wait for the bar to close to confirm the signal.
FREE

This is a regression tree indicator for MT4/MT5.
This indicator classificate nodes on the time period so that the deviation becomes smaller,
and displays regression line and channel for each node.
It's free!
Attached CartDemo.ex4 and CartDemo.ex5 is a Demo version and has the following limitations:
Can't use HighSpeed method (default method is RandomForest)
Maximum number of bars is 260 (increase from 200)
There is no expiration date and can be started many times, but it stops after an hour.
FREE
This indicator is one of the useful tools for traders who trade on currency pairs and based on the strength of each currency they can make a correct decision or confirmation in the positions. It has been calculated for all the minor currency pairs supported by the broker and displays the values of the major currencies. These currencies are displayed horizontally or vertically according to the trader's config when executing the indicator. One of the trading strategies that can be used is to cho
FREE
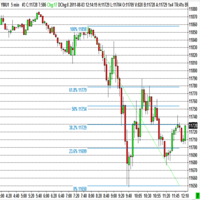
The program automatically draws fibonacci. This will save you a great deal of time in studying the chart. My intention is to facilitate those who carry out a study of the graph manually and use Fibonacci. In the screenshot you can see the result.The script applies to the chart of any currency pair or any stock. It will not open any purchase or sale operation because this program is limited only to drawing fibonacci.
FREE
Version History : Date Version Changes 6/20/2022 1.00 Initial release 6/21/2022 1.10 Add global variables for Minimum (SYMBOL_volume_min) and Maximum (SYMBOL_volume_max) History Volumes Description : RedeeCash Volumes Indicator is the Volumes indicator that you have come to trust for market entry and exit with the added benefit of exposing key metrics as global variables. Including global variables in an indicator permits easier interaction with expert advisors (EA) and scripts. When attaching
FREE
Check out other great products from https://www.mql5.com/en/users/augustinekamatu/seller
This indicator is the best so far at estimating reversal points especially on high time frames. It does not repaint and is based on a combination of moving averages computed using custom functions. No inputs required, it is simple plug and play. The principles used ensure that it can be used on CFDs, Commodities and Stock with incredibly great results. With proper money management and portfolio balancing
FREE

ForexFanclub(FFC) : For detailed instructions and our official website, please visit my profile !
PidPro is a fully-featured, professional bulk order closing tool provided by Forex Fanclub, designed to maximize the efficiency of position management. Whether you are a scalper needing lightning-fast exits or managing a basket of positions from an Expert Advisor, PidPro provides the ultimate control. [Key Features] 1. Flexible Target Selection:
Choose between "All Charts" to manage your entire
FREE

Session Killzone Indicator
Indicator that helps you to identify the killzone times of both London and NewYork sessions which usually is the most times for high volatility and taking liquidity from the market. Killzone times are configurable through indicator parameters. The indicator adjusts the range of the killzones based on the daily trading range.
FREE
The purpose of this new version of the MT4 standard indicator provided in your platform is to display in a sub-window multiple timeframes of the same indicator. See the example shown in the picture below. But the display isn’t like a simple MTF indicator. This is the real display of the indicator on its timeframe. Here's the options available in the FFx indicator: Select the timeframes to be displayed (M1 to Monthly) Define the width (number of bars) for each timeframe box Alert pop up/sound/ema
FREE
Le MetaTrader Market est le meilleur endroit pour vendre des robots de trading et des indicateurs techniques.
Il vous suffit de développer une application pour la plateforme MetaTrader avec un design attrayant et une bonne description. Nous vous expliquerons comment publier votre produit sur Market pour le proposer à des millions d'utilisateurs de MetaTrader.

Vous manquez des opportunités de trading :
- Applications de trading gratuites
- Plus de 8 000 signaux à copier
- Actualités économiques pour explorer les marchés financiers
Inscription
Se connecter
Vous acceptez la politique du site Web et les conditions d'utilisation
Si vous n'avez pas de compte, veuillez vous inscrire