 MetaTrader 5
 Experts
 Indicateurs
 Bibliothèque
 Utilitaires
 Widgets
 Règles
Regardez les tutoriels vidéo de Market sur YouTube
Comment acheter un robot de trading ou un indicateur
Exécutez votre EA sur
hébergement virtuel
hébergement virtuel
Test un indicateur/robot de trading avant d'acheter
Vous voulez gagner de l'argent sur Market ?
Comment présenter un produit pour qu'il se vende bien
Expert Advisors et indicateurs gratuits pour MetaTrader 4 - 30
 Les robots de trading effectuent automatiquement les transactions sur le marché, tandis que les indicateurs vous permettent de mieux analyser les cotations et de prédire le comportement des prix. Grâce à ces applications, vous serez en mesure d'effectuer des transactions dans MetaTrader 4 de manière plus avisée, tout en saisissant davantage d'opportunités.

THE_____ IIIREX_CLAW_vs_CLUSTER_EAIII______ Set1: Price Offset 100, Stopp Loss 100-1000, Take Profit 2000
Set2: Price Offset 200, Stopp Loss 100-1000, Take Profit 2000
Set3: Price Offset 100, Stopp Loss 100-1000, Take Profit 1000
Set4: Price Offset 200, Stopp Loss 100-1000, Take Profit 1000
Set5: PriceOffset 100-1000 (Recomment 200) higher is lower Risk, Stopp Loss 500 Take Profit 1000, 2000, or 3000 it is the same Target
Set it to your Moneymanagement
Indize: DE40
“IC Market” Recomment
FREE
The indicator shows the High and Low levels of candles for timeframes selected in the settings. It is recommended to use it on smaller timeframes to determine the levels of higher timeframes.
Parameters TYPE_LINE - type of the line (short based on the bar time, or long for the entire chart) ============= TF 1 ============= block of lines for the first timeframe TF_1 - timeframe of the first block of lines Bars_1_from=1 - Bar of the beginning of the line of the corresponding Timeframe. Bars_1_
FREE

Gina Dual TPO — Brief MQL4 indicator TPO + Volume profile overlaid on chart — fast, scalable, and beginner-friendly. Built for traders who read market structure by POC and Value Area. What it is An MQL4 indicator that overlays dual market profiles—Time-at-Price (TPO) and Volume-at-Price (VPO)—directly on your chart. It’s fast (pixel-based drawing), scalable, and beginner-friendly. Who it’s for Intraday and swing traders who read market structure via POC (Point of Control) and Value Area to spot
FREE
Concept:
This indicator will help you find Spike Bar. 1/ Check Yesterday Range (Open-Close ) 2/ Check Today pips: Price from Daily Open to current price (Bid/Ask) Then alert for you when the pips range of current candle is equal to or greater than the user defined minimum range. This indicator is related to Strategy: Daily Range Spike and Pull Back, you can find it on FFX forum
FREE

Precision Candle Timer is a must-have visual indicator that accurately displays the remaining time of the current candle on your chart. Perfect for traders who need precise timing for entries and exits , especially in scalping , day trading , or candle-formation-based strategies. Designed to be fully customizable, you can easily change its position, color, font, and size to match your trading layout. It adds clarity, control, and responsiveness to your trading routine. Key Features: Precise t
FREE
A free program for copying orders between terminals on the same computer.
Any orders are copied in any direction, between any accounts.
The principle of operation:
On the terminal from which you want to copy, the "Server" parameter is set. On the terminal or terminals where the copied positions need to be opened, the "Client" parameter is set. It is also necessary to enter the account number of the "Server" terminal on the client.
In the future, it is planned to increase the functionality
FREE

Medium-term trading system that tries to profit during the price rollbacks after significant movements. The system automatically determines the current trading range, the price rollback levels. This is a demonstration version of the Algorithmic EA, which is optimized over the year 2016 for trading the EURUSD currency pair. It is possible to trade in manual mode using a simple on-screen panel or in fully automatic mode. Amount of trades per month is from 5 to 18 in automatic mode. The recommended
FREE
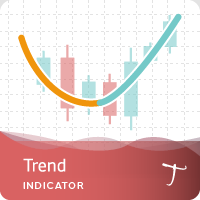
Tipu Trend is a non-lag, non-repaint, smart indicator, that shows the trend of selected time frames.
Features Customizable Buy/Sell alerts, push alerts, email alerts, or visual on-screen alerts. As easy to trade indicator that smooths the noise in the price action. Highlights ranging markets. Add Tipu Panel (found here ) and unlock the following additional features. An easy to use Panel that shows the trend + signal of the selected time frames. Customizable Panel. The panel can be moved to any
FREE

There are time periods in the market, when trading is highly likely to be unprofitable. This indicator warns you about such non-trading situations and helps you preserve your money and time.
Parameters Remind about non-trading periods: Expiration week - remind about the expiration week Consumer index day - remind a day before the release of Consumer index day NON FARM - remind a day before the release of NON FARM Christmas - remind a day before Christmas New Year Days 25.12 - 15.01 - remind abo
FREE

Multi Indicators Osw Description Commerciale Multi Indicators Osw est une station de travail technique définitive qui regroupe 8 des stratégies de trading classiques les plus puissantes dans un seul outil pour MetaTrader 5. Conçu pour simplifier l'analyse visuelle, cet indicateur permet de filtrer et de visualiser les confluences du RSI, du MACD, des moyennes mobiles, des bandes de Bollinger, du stochastique, du CCI, du Parabolic SAR et des Envelopes sans encombrer votre graphique. C'est la sol
FREE

Arrow Indicator (Buy/Sell Alerts) – Simple Yet Powerful Tool! Product Version: 1.01 Indicator Type: Trend Reversal Signals Timeframes Supported: All (Recommended: H1, H4, D1) Key Features: Buy Signal: Green upward arrow () appears below the candle Sell Signal : Red downward arrow () appears above the candle Accurate Trend Reversal Detection – Based on tried and tested SMA strategy. ️ Clean Chart View – Minimalist, non-i
FREE

This is an implementation of the market cycle indicator described by Raghee Horner in the book "Forex Trading for Maximum Profit" . The current state of the market can be determined by analyzing the inclination angle of the exponential moving average (EMA) running on a period of 34 bars. If the EMA inclination is defined as the direction of the hour hand on the dial from 12 to 2 hours, then an uptrend is considered to be present; from 2 to 4 hours, the market consolidates; from 4 to 6 hours, a d
FREE

Cet indicateur trace le Indice de force — la variation de prix de chaque barre multipliée par son volume — à l'intérieur de bandes d'écart type adaptatives. Là où le prix à lui seul vous indique qu'un marché a évolué, l'indice de force vous indique les efforts déployés pour le faire évoluer. Un changement de prix important sur un volume faible et un petit changement sur un volume important sont des événements très différents, même lorsque les bougies se ressemblent. L'indice de force les sépare
FREE

1. Make sure you trade only with GBP/USD on an 1h chart as this model is built specifically for the hourly Cable trading. 2. If you are backtesting the EA during weekends, make sure to specify a reasonable spread (such as 30 or 50) instead of using current spread because the market is not trading and the current spread may be some awkward number. During weekdays, feel free to use current spread as it is the correct current spread value. 3. If you want to have an even more stable-performing EA,
FREE

This EA helps traders in the following benefits : - show the entry point for sell or buy orders that you makes. -show the TP & SL levels on chart - control the lot size - control the TP & SL level in points - works on all chart period - rising algo trading rank in your signal - closing all deals in one click - closing only profitable deals - closing only losable traders enjoy
FREE

VisualRiskTool VisualRiskTool is a professional trade execution panel and risk management utility designed for MetaTrader. It streamlines the process of opening and managing positions by automating complex lot size calculations and providing a visual interface for setting stop-loss and take-profit levels directly on the chart. Core Functionality: Precision Risk Management The primary goal of VisualRiskTool is to eliminate manual calculation errors. By defining a fixed risk percentage (e.g., 0.5%
FREE

Our offer also includes a free panel — Indicator Panel — which allows you to show or hide indicators created by BOToBRACIA -> MT4 / MT5 Our offer also includes a version for MetaTrader 5 -> https://www.mql5.com/en/market/product/179251?source=Site+Market+Product+Page
Indicator Panel is a tool designed to manage the visibility of technical analysis objects generated by our indicators. Instead of enabling/disabling individual indicators or manually removing chart objects, a single checkbox
FREE
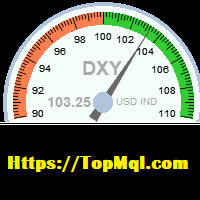
This indicator is used to calculate the dollar index according to the formula of currency pairs(EURUSD ,GBPUSD,USDJPY,USDSEK,USDCHF,USDCAD)Even if the broker does not have the dollar symbol. this Indicator displays the dollar index chart in a separate window at the bottom of the chart. It also displays the current dollar index graphically. In this indicator, it is possible to set the minimum and maximum value of the indicator as well as its size scale on the chart as an input parameter, and it
FREE
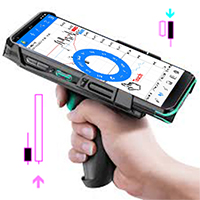
This is an indicator that helps you to scan the whole timeframe then informs you about the last candle position Engulfing Candlestick pattern was formed. The indicator also send alert to your mobile when a new engulfing candle is formed.
For the visual;
1. Green up arrow indicates a bullish engulfing candlestick pattern
2. Red down arrow indicates a bearish engulfing candlestick pattern
FREE

This is my First Project to create EA. Simple MA Cross Fast and Slow with additional High Time Frame Filter. You can set manually to get optimum Result. It's suit for swing Trader that Trade on High Time Frame. ex. H1 / H4 with D1 Filter. Or you can modify It that follow your strategy.
Give me good feedback to improve for better version. Cheers!!
Hurry up FREE download for Limited Time!!
Please test It on Demo account or strategy tester before applied on Live Account
FREE
If you are boring in repeatedly changing of trading symbol in every charts when use multiple charts to analyzing prices or trading. This indicator can help you. It will change the symbol of any other charts in the terminal to the same as in the chart you have attached this indicator to it whenever you add new symbol to the chart or click on the button. After finished the job it will sleep quietly waiting for new occasion in order to minimize resource usage of the computor.
FREE
Like most things that work in trading, it's really simple. However, it's one of the most powerful tools I have that makes entries of many systems much more precise.
In its essence, it measures the recent volatility against the medium-term average. How does it work? Markets tend to be prone to strong trending movements when relative volatility is low and tend to be mean-reverting when relative volatility is high.
It can be used with both mean-reversion systems (like the Golden Pickaxe) and mo
FREE
Индикатор предназначен для разметки ,фибо уровней и фибо зон.Также есть возможность удаления и редактирования уровней на текущем графике. При установке нескольких индикаторов (FIBO-ZONES)на график,не забывайте менять имя в поле (NAME).В утилите также есть возможность менять цвет зон, толщину линий и стиль линий уровней фибо. При установке индикатора ,зоны выстраиваются автоматически.
FREE

ADR 10 mostra l'intervallo medio di pips di una coppia Forex, misurato su un numero di 10 giorni . I traders possono utilizzarlo per visualizzare la potenziale azione dei prezzi al di fuori del movimento medio giornaliero.
Quando l'ADR è al di sopra della media, significa che la volatilità giornaliera è superiore al normale, il che implica che la coppia di valute potrebbe estendersi oltre la sua norma.
L'ADR è utile anche per il trading di inversioni intraday. Ad esempio, se una coppia di val
FREE
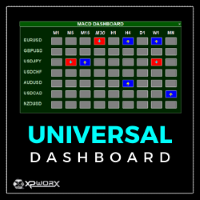
The UNIVERSAL DASHBOARD indicator will eliminate the need of using dozens of indicators on dozens of charts. From one place you can monitor all the pairs and all the timeframes for each of the following indicators: MACD STOCHASTIC WPR RSI CCI You can also use any Custom indicator in the dashboard as long as it has a readable buffer. With a single click you can quickly navigate between charts, pairs and timeframes. Alerts will provide clear indication about what happens for your favorite pairs on
FREE

Diversify the risk in your trading account by combining our Expert Advisors. Build your own custom trading system here: Simple Forex Trading Strategies
The expert advisor opens trades when the SMAs cross and when the WPR has left overbought/oversold areas. The SMAs are also programmed to close the trades if the trend changes. The Stop Loss, Take Profit, and Trailing Stop are calculated based on the ATR indicator. The recommended currency pair is NZDUSD and the recommended timeframe to operat
FREE

Current indicator shows the trading sessions for the major financial centres: London New York Tokyo Sydney There are available two types of displaying zones: in sub window below the chart and on the chart. When the subwindow is selected, the sessions are shown in the form of bars. If the sessions are shown on the main chart, they are displayed in the form of lines at the open price of the session that may also act as a support and resistance for further price action during the trading day. The
FREE
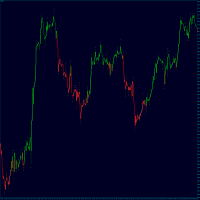
TrendFinder RSI are Colored candlesticks showing the trend based on The Relative Strength Index (RSI) This indicator will give you the color change on the next bar on the confirmation candle and will never repaint TrendFinder RSI is optimize to trade on any market and to be used trending and None trending markets. For best results use this indicator as an extra tools after you have completed your regular analysis and use it for alerts based on such analysis.
FREE
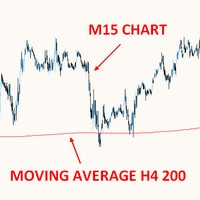
THIS FREE INDICATOR ALLOWS YOU TO SET THE TIMEFRAME OF THE MA YOU WANT ON YOUR CHART For example, it's very useful if you want to trade the H4 200 SMA using a lower timeframe chart, to identify price reactions such as reversals, Wyckoff schematics, etc. ***Please comment, rate and share it to your friends if you like it*** ------------------------------------------------------------------------- Moving averages are popular technical indicators used to identify trends, support and resistance leve
FREE
QuantumAlert RSI Navigator is a free indicator available for MT4/MT5 platforms, its work is to provide "alerts" when the market is inside "overbought and oversold" regions in the form of "buy or sell" signals. This indicator comes with many customization options mentioned in the parameter section below, user can customise these parameters as needful. Join our MQL5 group , where we share important news and updates. You are also welcome to join our private channel as well, contact me for the pri
FREE
A simple information indicator showing the time left before the opening of the next candlestick or bar.
About the concept of a timeframe A timeframe is the time interval considered in the technical analysis of free financial markets (the same applies to the global currency market), during which the price and other market data change. The smallest timeframe is the so-called tick. A timeframe is the time interval used to group quotes when drawing elements of a price chart (bars, Japanese candlest
FREE

This indicator is based on Zigzag. It shows the HH, HL, LL, LH counts. This helps in finding ongoing trends. Or ranges:
Features: Show symbols for: Higher-Highs, Higher-Lows Lower-Lows, Lower-Highs And show counter for each Non-repainting option Customize Color and horizontal/vertical labels Corresponding scanner dashboard: https://www.mql5.com/en/market/product/85346
Symbols Described: HH = Higher-Highs (Current price high is more than previous high) HL = Higher-Lows (Current price low is mo
FREE

This is the technical document for GTB (Grid Trader Brazil) for the Market version. It details the strategic operation and the complete dictionary of available parameters. DEFAULT SET.set - DEFAULT ENGLISH SET!
️ IMPORTANT: DEFAULT SETTINGS The default settings of this EA are calibrated to be Ultra-Conservative (Low Frequency) to strictly comply with MQL5 Market Validation rules. For Real Trading Results: You MUST load a valid .set file. Check the Comments Section for the
FREE

CDS SR Fractal Level: Enhance Your Trading Accuracy with Automatic Fractal-Based Support and Resistance Levels The CDS SR Fractal Level indicator is an advanced trading tool designed by CDS to automatically identify and visualize key Support and Resistance (SR) levels. This indicator utilizes the concept of fractals to present relevant SR levels for your trading decisions. Key Features: Automatic Fractal Level Identification: The indicator dynamically marks fractal levels as they form on the pri
FREE

STOCH AND RSI ALERT https://www.mql5.com/en/users/earobotkk/seller#products (I have created a dashboard from this product, please take a look by clicking here ) (I have also created an EA from this product, NOW user can go automation, click here ) P/S: If you like this indicator, please rate it with 5 stars in the review section, this will increase its popularity so that other users will be benefited from using it. This indicator notifies and draws an arrow on the chart whenever the main sto
FREE

An egg is the organic vessel containing the zygote in which an embryo develops until it can survive on its own, at which point the animal hatches. An egg results from fertilization of an egg cell . Most arthropods , vertebrates (excluding live-bearing mammals ), and mollusks lay eggs, although some, such as scorpions , do not. Reptile eggs, bird eggs , and monotreme eggs are laid out of water and are surrounded by a protective shell , either flexible or
FREE

Stratégie d'échange avec les bandes de Bollinger et l'oscillateur stochastique
Les bandes de Bollinger sont principalement utilisées pour suivre les tendances.
Utilisation de la ligne principale stochastique et de la ligne de signal pour l'achat ou la vente d'un ordre en attente ouvert
Le conseiller Auto3M Lite MT4 peut fonctionner sur un VPS.
Pro version MT4
Pro version MT5
Caractéristique
Pas de martingale
Stop loss et take profit pour chaque position
Arrêt de fuite
Supprimer autom
FREE

It's an expert to use prices action and trade level to open each order. Expert can to trade up 12 pairs, uses the corresponding default setting for each pair.
Default settings are good for EURUSD pair and IC Markets broker.
Time Frame: H1
Parameters
PresetsParameters = Uses prosets parameters (12 pairs). Broker GMT Offset = Set broker different time from GMT time. Time Frame Use = Time frame of chart to run expert. Type Of Signals = Mode of signals. Time Set Levels = Time set levels to trade.
FREE
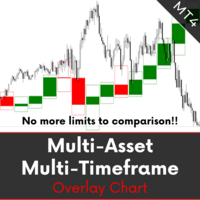
MA MTF Overlay Chart is software that allows you to overlay the candlestick chart of a financial instrument with a second candlestick chart of the same one, or of another, financial instrument, by setting a different timeframe from that of the basic chart. The software is very simple to use and the input parameters are listed below.
Input parameters: Overlay chart set-up Financial instrument : financial instrument that you want to overlay on the base chart Time period : secondary instrume
FREE

Genaral: Not martingale, not a grid; Use on EURUSD Use on M5
Signals: There is a good rational algorithm. Work of two indicators: 2 DeMarker (from 2 timeframes) (you can set a separate Timeframe for each indicator)
Stop Loss/Take Profit: There is a good money management system (there are several type for trailing stop loss); There is virtual levels of Stop Loss / Take Profit; There is smart lot (percent by risk) or fix lot
Important: EA can work on closed candles, and on current candles;
FREE
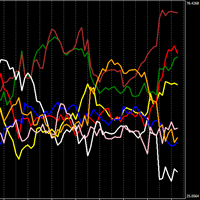
Indicateur puissant qui montre la force de la devise individuelle.
Plus elle est élevée, plus la monnaie est forte, et inversement, plus elle est basse, plus elle est faible.
Stratégie de trading N1 : Position ouverte sur les franchissements de lignes, si l'une croise à la hausse et l'autre à la baisse, position ouverte sur la devise qui monte.
Stratégie de trading N2 : position ouverte en achetant la devise la plus forte et en vendant la devise la plus faible.
Dans les paramètres, vous pou
FREE

L'indicateur R 2EMA Color pour MT4 fournit des signaux de trading solides basés sur le croisement de 2 EMA.
Points clés Lorsque le prix croise et clôture au-dessus des deux EMA vertes, cela crée un signal d'achat. Lorsque le prix croise et clôture au-dessus des deux EMA rouges, cela crée un signal commercial de vente. L'indicateur R 2EMA Color Forex permet de déterminer encore plus facilement quand il est temps d'acheter et de vendre
Un signal d'achat se produit lorsque les 2 lignes EMA devie
FREE

The script is based on the simulation of trade transactions using a random number generator. This allows you to get completely different results, even with the same input parameters. When you run the script, a dialog box opens in which you can set the desired values for external variables. In the Trading options block, the basic parameters that are necessary for trading modeling are defined. Start Balance - sets the initial size of the trade balance. Number Trade - sets the number of trade tr
FREE

The Zig-Zag based levels indicator is a highly accurate tool for Forex trading that will help you improve your strategy and make more precise decisions. It uses the Zig-Zag algorithm to identify various support and resistance levels on the market, based on which you can determine when it is best to enter or exit a trade.
This indicator has high performance and accuracy in calculating levels, which allows traders to gain maximum profits with minimal risks. Thanks to its intuitive interface, you
FREE

Le bot Trade Grid permet de simplifier le trading en exécutant plusieurs ordres en un seul clic, selon les spécifications de l'utilisateur. Ces ordres sont initiés instantanément à l'aide des boutons EA sur le graphique et peuvent être tous fermés simultanément à l'aide du bouton de fermeture également situé sur le graphique. De plus, Trade Grid gère efficacement les transactions en les fermant automatiquement dès qu'elles atteignent un seuil prédéfini de profit ou de perte.
FREE

Multi currency ai trading bot for mt4 it is rich of parameters like equity control , tp and sl in different option like money and pips also drawdown control risk control trading timing and lot size in detailed options also closing control for trades supported with nice control panel with many options you can make your parameters as you wish that ea work with any pair any frame also any equity you can adjust that in equity balance
FREE
Donchian channels are a tool in technical analysis used to determine the relative volatility of a market and the potential for price breakouts.
Can help identify potential breakouts and reversals in price, which are the moments when traders are called on to make strategic decisions. These strategies can help you capitalize on price trends while having pre-defined entry and exit points to secure gains or limit losses. Using the Donchian channel can thus be part of a disciplined approach to managi
FREE

Trading robot “Dolphins” (Version #8) Description: Trading robot “Dolphins” is an automated assistant for trading that has successfully passed verification in the prop company FTMO.COM , using the Relative Strength Index (RSI) and True Range (ATR) indicators to execute trades on the MetaTrader 4 platform. This version implements dynamic calculation of the lot size. Functionality: Strategy based on RSI and ATR: The robot uses RSI and ATR to determine entry and exit points. RSI periods can be adju
FREE

Use this indicator to ensure all your open charts are constantly displaying the same time frame. Change the time frame in any one chart and watch the others instantly change to the same time frame. Also allows scrolling of candles in one chart to be replicated in all other synchronized charts. Analyze correlation between different symbols by linking charts together on the same time frame Display a vertical marker move across all your open charts, so you can quickly compare price action at the sa
FREE

RaysFX Market Trend Histogram Il RaysFX Market Trend Histogram è un indicatore personalizzato per la piattaforma di trading MetaTrader 4. Utilizza il Commodity Channel Index (CCI) per identificare le tendenze del mercato e visualizza queste informazioni in un istogramma intuitivo. Caratteristiche principali: Identificazione delle tendenze: L’indicatore calcola il CCI per ogni periodo di tempo e lo utilizza per determinare se il mercato è in una tendenza al rialzo o al ribasso. Visualizzazione in
FREE

Pullback Viewer is designed to show valid pullback points in a bearish or bullish trend.
What is considered a valid pullback?
A valid pullback needs to have a body close outside the previous candle high (in a bearish trend ) or previous candle low (in a bullish trend ). If the candle wicks out the previous candle, it's not a valid pullback.
Pullback must liquidate the previous candle with a clean candle body close.
When is this indicator useful?
It's useful to understand and
FREE
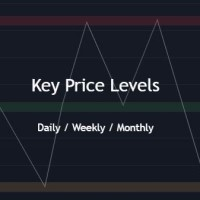
Key Price Levels Indicator Indicator that shows the highs and lows for the significant price levels for past periods that could be potentially considered as reaction levels. The indicator displays the following price levels: Yesterday high and low The day before yesterday high and low Two days back high and low Last week high and low Last month high and low Last three month high and low (Quarter) Last year high and low
FREE

*This is tradingview indicator converted to mql5*
The Trend Magic Indicator is a popular technical analysis tool used to identify the direction of a market trend and potential trend reversals. It is a versatile indicator that can be applied to various financial instruments and timeframes. The Trend Magic Indicator consists of a combination of moving averages and a volatility-based filter. It aims to smooth out price fluctuations and provide a clearer visualization of the underlying trend. Here
FREE
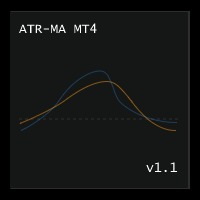
ATR Moving Average draws a moving average of the standard Average True Range( ATR ) in the same window.
Settings Name Description ATR period
Set Price per iod for ATR calculation
ATR level Set ATR value for thresholding( only whole number, ignore leading zeros e.g. 0.00089 = 89 ) MA Period Set moving Average Period MA Method Set moving average method( Simple, Exponential, Smoothed and Linear Weighted ) MA Shift
Set moving average shift
Enable Alerts ? Generate Alert when ATR Crosses
FREE
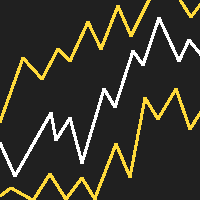
RSI Bands is a powerful indicator which displays an upper and lower band corresponding to the RSI overbought and oversold levels. The band shows what price must be reached during that specific candle in order for the RSI overbought/oversold level to be reached. This is an extremely useful tool for spotting when a trend has begun and when a trend is about to end. The indicator provides buffers, allowing you to use it in your own Expert Advisor. Please message me if you have any questions.
CURREN
FREE

Heiken Ashi Button Heiken-Ashi , often spelled Heikin-Ashi, is a Japanese word that means "Average Bar." The Heiken-Ashi approach can be used in conjunction with candlestick charts to spot market trends and forecast future prices. It's useful for making candlestick charts easier to read and analysing patterns. Traders can use Heiken-Ashi charts to determine when to stay in trades while the trend continues and close trades when the trend reverses. The majority of earnings are made when markets a
FREE

The indicator determines overbought/oversold zones on various timeframes. Arrows show market trend in various time sessions: if the market leaves the overbought zone, the arrow will indicate an ascending trend (arrow up), if the market leaves the oversold zone, the arrow will indicate a descending trend (arrow down). Situation on the timeframe, where the indicator is located, is displayed in the lower right window. Information on the market location (overbought or oversold zone), as well as the
FREE

The implementation of the impulse system described by Dr. Alexander Elder. The indicator generates signals according to the following pattern: Moving average and MACD histogram increase - green bar, it is forbidden to sell; Moving average and MACD histogram have different directions - gray (or empty) bar, the ban is removed; Moving average and MACD histogram decrease - red bar, it is forbidden to buy.
Indicator Parameters EMA - period of the indicator's moving average MACD Fast - period of the
FREE
An automatic trend trading advisor based on an analysis of the current market situation.
The adviser determines the direction of the market, monitors built-in indicators, builds breakdown levels and enters the market after they cross. In this case, irrelevant levels are deleted. Advisor is fully automated and ready to go. Please see all my products: https://www.mql5.com/en/users/en_coding/seller
Advantage: does not use locks, grids, sitouts, arbitrage and other risky trading strategies; high p
FREE
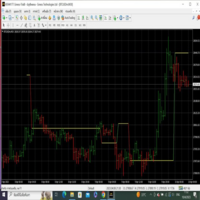
Key Features: Type of Indicator: Line Break Chart Indicator Usage: Identifying trend reversals and potential market turning points. Input Parameters: The primary input parameter is 'Lines_Break,' which represents the number of lines the price needs to move to create a new line in the opposite direction. How it works: The indicator draws green and red histogram bars to represent the line break chart. Green bars indicate an upward trend, and red bars indicate a downward trend. The indicator calcul
FREE

The Cat Trend VZ-un indicateur constamment amélioré avec des signaux d'entrée précis et rentables.
La ligne de l'indicateur The Cat Trend VZ change de couleur en fonction de la direction de la tendance, et aux points d'inversion des prix, l'indicateur dessine des flèches.
En outre, l'indicateur The Cat Trend VZ a mis en œuvre une alerte sonore et textuelle sur l'apparition d'une flèche.
IMPORTANT: L'INDICATEUR N'EST PAS REDESSINÉ.
Principales caractéristiques de The Cat Trend VZ: Fonct
FREE

Daily Trading Dashboard – MT4 Indicator A compact and efficient tool that displays your daily trading statistics directly on the chart. Designed for traders who need a clear overview of their performance without switching screens. Key Features Real-time calculation of today’s profit/loss (with green/red color coding) Display of trade count and total trading volume Lightweight 280×160 px panel with clean blue design Automatic updates every few seconds Optional filtering by Magic Number or Comment
FREE

Cherchez-vous à faire passer votre négociation d'actions au niveau supérieur?
Avec son algorithme intelligent et ses ordres d'experts, vous pouvez vous assurer d'avoir toujours une longueur d'avance. Réalisez des bénéfices sur les marchés haussiers et baissiers, prédisez facilement les tendances et restez au top de votre portefeuille d'investissement - avec Stock Flow, tout est possible !
Les ordres d'entrée et de sortie sont donnés par une combinaison de deux indicateurs que l'on peut trouve
FREE

Indicateur de couleur des chandeliers par jour de la semaine
Qu'est-ce que c'est ?
Un outil visuel simple qui colore les chandeliers d'un graphique en fonction du jour de la semaine. Lundi est associé à une couleur, mardi à une autre, et ainsi de suite. Vous êtes-vous déjà demandé à quelle fréquence les prix se comportent d'une certaine manière certains jours de la semaine ? Cet indicateur vous aide à identifier ces tendances.
À qui s'adresse-t-il ?
Aux traders qui :
Souhaitent déterminer
FREE

The Support & Resistance Breakout Indicator with Smart Alerts a utomatically identifies key support and resistance levels using fractal detection, and receive instant breakout signals enhanced by RSI/CCI confirmation filters. This versatile tool includes push notifications, email alerts, pop-up alerts, and sound alerts so you never miss a trading opportunity. Key Features:
Dynamic Level Detection – Draws real-time support and resistance based on market fractals. Breakout Arrows – Clear vis
FREE

Dynamic Trend Follower Main Chart Indicator Deep Analysis: Dual MA Color Change + Cross Markers + Buy/Sell Signals + Trend Reversal + Strong Cross Indicator Overview Dynamic Trend Follower is a premium main chart moving average crossover composite signal indicator designed exclusively for the MT4 platform . It breaks through the limitations of traditional single moving averages or simple crossovers by integrating a Dual MA Trend Color Change System , Cross "+" Markers with Spread Percenta
FREE
Découvrez IT Divergence EA, votre allié incontournable pour maximiser vos profits sur les marchés financiers. Notre Expert Advisor (EA) exploite les puissants indicateurs MACD et RSI pour automatiser le trading avec une précision inégalée.
Caractéristiques Clés :
Stratégie de Détection des Divergences : IT Divergence EA repose sur une stratégie solide qui tire parti des indicateurs MACD et RSI pour repérer des divergences sur les marchés. Les divergences sont de puissants signaux pour ident
FREE

Indicateur Chaikin Money Flow (CMF) avec support multi-timeframe, signaux visuels personnalisables et système d'alertes configurable.
Services de programmation freelance, mises à jour et autres produits TrueTL disponibles sur mon profil MQL5 .
Les retours et avis sont très appréciés !
Qu'est-ce que CMF ? Chaikin Money Flow (CMF) est un indicateur de momentum pondéré par le volume développé par Marc Chaikin qui mesure la pression d'achat et de vente sur une période déterminée. L'indicateur cal
FREE

EA SCALPER GHOST PRO
This is single Entry type EA. It use smart alghoritme to detect market movement. It also use Stop loss and take profit . EA will not use any dangerous system like martingale, grid, averaging etc which can cause account blown in a second Tis EA use More than one pair to reduce risk. Right now im using 13 pair at the same time PROMO SALE PRICE Only $99 For first 10 copies!! 4 copies left Next Price will be ====>> $xxxx UP
RAMADHAN KAREEM PROMO ONLY $55 FOR LIFE TIME.. GRAB
FREE
The volume weighted average price (VWAP) is a trading benchmark used by traders that gives the average price a security has traded at throughout the day, based on both volume and price. VWAP is calculated by adding up the dollars traded for every transaction (price multiplied by the number of shares traded) and then dividing by the total shares traded. You can see more of my publications here: https://www.mql5.com/en/users/joaquinmetayer/seller
FREE
Le MetaTrader Market est la seule boutique où vous pouvez télécharger un robot de trading de démonstration gratuit pour le tester et l'optimiser à l'aide de données historiques.
Lisez l’aperçu de l'application et les avis d'autres clients, téléchargez-la directement sur votre terminal et testez un robot de trading avant de l'acheter. Seul MetaTrader Market vous permet de tester gratuitement une application.

Vous manquez des opportunités de trading :
- Applications de trading gratuites
- Plus de 8 000 signaux à copier
- Actualités économiques pour explorer les marchés financiers
Inscription
Se connecter
Vous acceptez la politique du site Web et les conditions d'utilisation
Si vous n'avez pas de compte, veuillez vous inscrire