Rafael Barreto Haddad
  • Rafael Haddad → QuantMatrix → quantitative trading research en Quantitative Trading Systems Researcher
  • Brasil
  • 1456
  • Información
1 año
experiencia
11
productos
4
versiones demo
0
trabajos
0
señales
0
suscriptores
Rafael Haddad → QuantMatrix → quantitative trading research en Quantitative Trading Systems Researcher
X
Investigador de Sistemas Cuantitativos de Trading | Creador de QuantMatrix Research Series | MetaTrader 5

Creador de la serie de investigación QuantMatrix para MetaTrader 5.

Desarrollo sistemas cuantitativos de trading, Expert Advisors adaptativos y herramientas de análisis de mercado basadas en evidencia histórica, validación de estrategias y evaluación continua de modelos.

La investigación QuantMatrix explora el descubrimiento de estrategias, la competencia Champion/Challenger, los regímenes de mercado, el análisis probabilístico, la volatilidad, el momento adaptativo de entrada y salida, la robustez y la ejecución orientada al riesgo.

Investigar → Validar → Desafiar → Ejecutar → Supervisar → Adaptar.

Publico indicadores, Expert Advisors, herramientas de investigación y contenido técnico centrado en el trading sistemático y algorítmico.

Los resultados históricos, las probabilidades y los backtests no garantizan resultados futuros.

Rafael Haddad
Creador, QuantMatrix Research Series
Amigos

Si añade a sus amigos a través de sus perfiles o la búsqueda, podrá comunicarse y monitorear fácilmente su presencia en el sitio web.

Rafael Barreto Haddad
Candlestick patterns are among the most widely used tools in price action analysis. Patterns such as Hammer, Engulfing, Morning Star and Shooting Star are easy to recognize in theory, but manual identification can become subjective when dozens or hundreds of candles must be analyzed...
Rafael Barreto Haddad
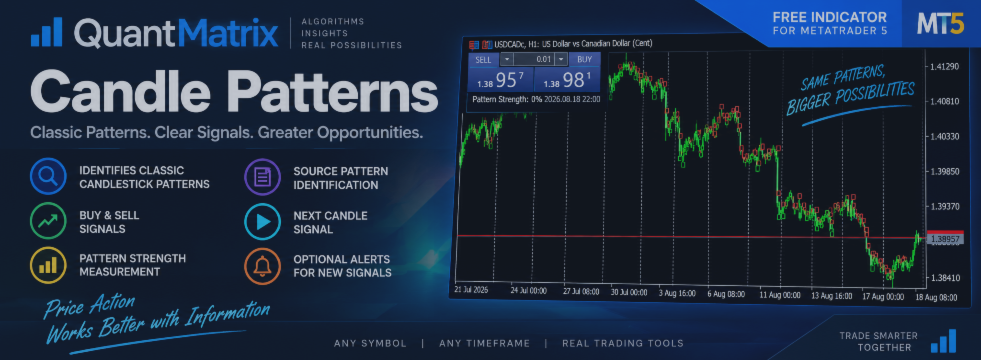
QuantMatrix Candle Patterns is now available for MetaTrader 5.

The indicator automatically identifies classic candlestick formations and displays the corresponding BUY or SELL signal on the following candle, only after the source pattern has been confirmed.

It includes:

• Bullish and bearish candlestick patterns
• BUY and SELL signals
• Pattern Strength measurement
• Source Pattern identification
• Next Candle Signal display
• Optional alerts
• Support for any symbol and timeframe

Pattern Strength represents the structural quality of the detected formation. It is not a historical probability of profit.

QuantMatrix Candle Patterns is available free on the MQL5 Market.

#MQL5 #MetaTrader5 #CandlestickPatterns #PriceAction #TradingIndicators #QuantMatrix
Rafael Barreto Haddad Ha publicado el producto

«QuantMatrix Candle Patterns» es un indicador gratuito para MetaTrader 5 diseñado para identificar formaciones clásicas de velas japonesas directamente en el gráfico. El indicador analiza las velas completadas y detecta patrones de comportamiento del precio alcistas, bajistas y neutros reconocidos. Cuando se confirma una formación alcista o bajista válida, se muestra la señal correspondiente de COMPRA o VENTA en la vela siguiente . Esto significa que la señal solo se genera una vez que se ha

Rafael Barreto Haddad Ha publicado el producto

QM Candle Timing Meter es un indicador gratuito para MetaTrader 5 diseñado para responder a una pregunta sencilla: ¿Cuánto me he retrasado en la vela actual? Una señal de trading puede seguir siendo técnicamente válida, aunque el momento de la entrada ya haya cambiado significativamente. Por ejemplo, entrar durante los primeros minutos de una vela H1 es muy diferente a entrar cuando ya ha transcurrido el 90 % de esa vela. QM Candle Timing Meter mide continuamente la posición temporal de la vela

Rafael Barreto Haddad
A valid signal does not always mean a valid entry

One detail can significantly change the behavior of a trading strategy:

the moment when the trade is actually entered.

Imagine an M15 strategy generates a BUY condition shortly after a new candle begins.

If the entry happens during the first 10% of the candle:

the movement may only be starting;
the entry may still be close to the original signal;
much of the candle's potential range may still be ahead;
the distance to invalidation may remain relatively small.

Now imagine taking exactly the same BUY condition when 85% of the candle has already elapsed.

The technical condition may still be true.

The moving average may still be bullish.
Momentum may still be positive.
Price may still be above the breakout level.

But the trade is no longer identical.

A large part of the current movement may already have happened.

This creates an important distinction:

Signal state ≠ entry event

A condition can remain active long after the event that originally created the opportunity.

Consider a moving-average crossover.

If the fast average crossed above the slow average 20 candles ago, the fast average may still be above the slow average today.

That tells us something about the current market state.

But it does not automatically mean that opening a new trade today is statistically equivalent to entering when the crossover happened.

The same problem exists inside a single candle.

An entry made during the first 10% of an M15 candle should not automatically be treated as equivalent to an entry made during its final 10%.

Possible differences include:

entry price;
remaining movement;
distance to invalidation;
short-term exhaustion;
available reward relative to risk;
volatility already consumed by the candle.

This is why timing deserves to be measured separately from direction.

A simple analytical framework is to divide the candle into temporal zones:

0–25% — Early
25–50% — Developing
50–75% — Late
75–100% — Very Late

These percentages are not universal trading rules.

They are measurement zones.

The more useful question is not simply:

“Is the BUY condition still true?”

It is:

“Is this still the same entry opportunity that produced the historical behavior of the strategy?”

This distinction is part of the research behind QuantMatrix.

It is also the idea behind the free QM Candle Timing Meter, a MetaTrader 5 tool designed to measure how much of the current candle has already elapsed.

The indicator does not predict direction and does not generate BUY or SELL signals.

Its purpose is simpler:

measure timing before timing becomes an unnoticed variable in the trade.

Research → Validate → Challenge → Execute → Monitor → Adapt

Rafael Haddad
QuantMatrix Research Lab

Historical observations, probabilities and analytical tools do not guarantee future trading performance.
Rafael Barreto Haddad Ha publicado el producto

QM FlowVision X1 Indicador visual de trading multifactorial con probabilidad histórica, flujo de mercado, impulso, divergencia y contexto en múltiples marcos temporales QM FlowVision X1 es un indicador visual de apoyo a la toma de decisiones para MetaTrader 5, diseñado para transformar múltiples condiciones de mercado en un estado de negociación sencillo y fácil de interpretar. En lugar de mostrar osciladores aislados sin interpretación, FlowVision combina el impulso, el flujo de dinero, el RSI

Rafael Barreto Haddad
**Introducing QuantMatrix Research Lab**

Over the past months, I have been developing different tools, indicators and Expert Advisors for MetaTrader 5.

What began as individual experiments is gradually becoming something more structured:

**QuantMatrix Research Lab.**

QuantMatrix is a research project focused on systematic and quantitative trading.

The central idea is not to build one strategy and assume it will work forever.

Instead, the research explores how trading systems can:

• discover strategies from historical data
• compare competing models
• identify different market regimes
• measure probabilities instead of relying only on binary signals
• improve entry and exit timing
• evaluate robustness and drawdown
• replace models when their statistical evidence deteriorates

The development philosophy can be summarized as:

**Research → Validate → Challenge → Execute → Monitor → Adapt**

The QuantMatrix ecosystem will include three main areas:

**QM Free Tools**
Free indicators and analytical tools for traders and developers.

**QuantMatrix Pro**
More advanced analytical tools and probability-based indicators.

**QuantMatrix Systems**
Adaptive Expert Advisors built around strategy research, competition and continuous evaluation.

There is also a fourth area:

**QuantMatrix Research**

This is where experimental architectures are tested, including ideas that may succeed, fail, evolve or eventually become new tools.

Not every experiment needs to become a product.

Sometimes discovering why an idea does not work is just as valuable as discovering one that does.

I will increasingly use this profile to share that development process, technical ideas, free tools and the evolution of the QuantMatrix architecture.

No trading model can eliminate uncertainty, and historical performance or backtests cannot guarantee future results.

The objective of QuantMatrix Research Lab is different:

**measure uncertainty, test ideas and make systematic decisions based on evidence.**

Rafael Haddad
Creator of QuantMatrix Research Lab
Rafael Barreto Haddad Ha publicado el producto

Probabilidad de movimiento histórico de QuantMatrix La probabilidad de movimiento histórico de QuantMatrix es un indicador estadístico para MetaTrader 5 que compara el movimiento actual del precio con movimientos similares encontrados en los datos históricos del símbolo y el marco temporal seleccionados. Los movimientos de precios se normalizan utilizando el Rango Verdadero Medio (ATR). Esto permite comparar movimientos de diferentes períodos históricos en relación con la volatilidad presente en

Rafael Barreto Haddad
**Why I prefer probabilities over simple BUY/SELL signals**

Markets rarely provide absolute answers.

A technical condition can be bullish while volatility is increasing, momentum is weakening and historical behavior suggests uncertainty. Reducing all of this information to a single arrow can hide useful context.

This is one of the ideas behind the **QuantMatrix Research Series**.

Instead of asking only:

**BUY or SELL?**

I prefer to ask:

• What is the current market regime?
• How strong is the directional evidence?
• What happened historically under similar conditions?
• Is the signal still timely?
• Is there enough evidence to trade at all?

Sometimes the most useful output is not BUY or SELL.

It is simply:

**NO TRADE.**

Quantitative analysis is not about predicting every market movement. It is about measuring available information, uncertainty and risk consistently.

**Rafael Haddad**
QuantMatrix Research Series
Rafael Barreto Haddad Ha publicado el producto

QuantMatrix Wick Pressure La presión de las mechas de QuantMatrix es un indicador técnico para MetaTrader 5 que mide la relación entre las mechas superiores e inferiores de las velas japonesas y convierte esta información en una medida numérica de presión. Las mechas de las velas japonesas representan el movimiento del precio que se produjo más allá del cuerpo de la vela antes de que el precio retrocediera desde esos niveles. El indicador mide este comportamiento de rechazo a lo largo de velas

Rafael Barreto Haddad Ha publicado el producto

QuantMatrix Probability AI PRO QuantMatrix Probability AI PRO es un indicador técnico para MetaTrader 5 diseñado para evaluar las condiciones actuales del mercado y presentarlas en forma de estimaciones porcentuales de COMPRA, VENTA y NEUTRO. El indicador combina varios parámetros de mercado, entre los que se incluyen la tendencia, el impulso, la volatilidad, la posición del precio, el comportamiento de las mechas de las velas japonesas y las condiciones de ruptura. Además, compara el estado

Rafael Barreto Haddad Ha publicado el producto

QuantMatrix Probability AI Gratis QuantMatrix Probability AI Free es un indicador técnico para MetaTrader 5 que combina varias mediciones de las condiciones actuales del mercado en tres estimaciones numéricas. El indicador utiliza medias móviles exponenciales, el índice de fuerza relativa (RSI), el rango verdadero medio (ATR) y la posición actual del precio en sus cálculos. Estas mediciones se combinan para obtener una puntuación de mercado normalizada. La información resultante se muestra en el

Rafael Barreto Haddad Ha publicado el producto

Detector de falsas rupturas de QuantMatrix El detector de falsas rupturas de QuantMatrix es un indicador técnico para MetaTrader 5 que identifica posibles rupturas fallidas de los rangos de precios recientes. El indicador calcula el máximo más alto y el mínimo más bajo dentro de un periodo histórico configurable. A continuación, evalúa si el precio actual se desplaza más allá de uno de estos niveles en una distancia mínima ajustada a la volatilidad y, posteriormente, vuelve a cerrar dentro del

Rafael Barreto Haddad Ha publicado el producto

QuantMatrix Candle Exhaustion El agotamiento de velas de QuantMatrix es un indicador técnico para MetaTrader 5 que identifica las velas que muestran características predefinidas de amplitud de precios y mechas. El indicador compara el rango de la vela actual con el rango medio de las velas anteriores. Cuando el rango de la vela supera el umbral del rango histórico configurado, se evalúan sus mechas superior e inferior. Se puede mostrar un marcador de agotamiento alcista cuando una vela alcista

Rafael Barreto Haddad Ha publicado el producto

Régimen de volatilidad de QuantMatrix El régimen de volatilidad de QuantMatrix es un indicador técnico para MetaTrader 5 que evalúa la volatilidad actual del símbolo y el marco temporal seleccionados. El indicador utiliza el Rango Verdadero Medio (ATR) para comparar la volatilidad actual con una referencia histórica calculada a partir de las barras anteriores. En función de esta comparación, la situación actual del mercado se clasifica en uno de los cuatro regímenes de volatilidad: BAJA : la

Rafael Barreto Haddad
Timing Matters: Why a Trading Strategy Should Not Enter Late In algorithmic trading, we often spend enormous amounts of time deciding what should trigger an entry. Much less attention is given to when that signal is still valid . That distinction matters more than it seems...
Rafael Barreto Haddad
## A Strategy Should Never Be Trusted Forever

One of the most dangerous assumptions in algorithmic trading is that once a strategy has been validated, the hard work is over.

It isn't.

Markets change.

Volatility changes.

Correlations change.

Regimes change.

And a strategy that once looked robust can slowly lose the conditions that made it effective.

That is why QuantMatrix FX+Gold V8.4 was built around a different idea:

**Validation is not a finish line. It is a temporary permission to trade.**

A strategy can become a Champion.

But Champions are monitored.

Challengers remain available.

Forward evidence keeps accumulating.

If expectancy deteriorates, if behavior drifts away from historical patterns or if market conditions change, the system can reduce confidence, suspend the model or promote a stronger alternative.

The goal is not to defend a strategy because it worked in the past.

The goal is to keep asking:

**Does this strategy still deserve capital now?**

That question is much harder than simply finding a profitable backtest.

It is also much more important.

**QuantMatrix FX+Gold V8.4**

Adaptive. Quantitative. Multi-Market.

**Rafael Haddad**
Creator of QuantMatrix FX+Gold

#QuantMatrix #AlgorithmicTrading #QuantTrading #MetaTrader5 #ExpertAdvisor #ForexTrading #GoldTrading #TradingSystems
Rafael Barreto Haddad
Strategies Must Earn the Right to Trade A profitable backtest is persuasive. Sometimes, dangerously persuasive. You see a clean equity curve, a respectable Profit Factor, manageable drawdown and a sequence of trades that seems to confirm everything you hoped the strategy would do...
Rafael Barreto Haddad
From Indicators to Strategy Discovery: Why I Changed the Way I Think About Trading Robots For years, my approach to algorithmic trading followed a very familiar path...
Rafael Barreto Haddad
Strategies Must Earn the Right to Trade

Finding a profitable strategy is easy.

Finding one that survives serious validation is much harder.

This became one of the core principles behind my quantitative research:

A good backtest is not enough.

When QuantMatrix discovers a promising model, that model does not automatically receive permission to trade.

It must survive.

Different data samples.

Train / Validation / Test separation.

Walk-Forward analysis.

Unseen Holdout data.

Minimum trade requirements.

Transaction costs.

Drawdown limits.

Statistical confidence tests.

And robustness checks designed to expose strategies that may have succeeded simply by chance.

The objective is not to find the strategy with the most beautiful historical equity curve.

The objective is to eliminate fragile strategies.

And even after a strategy survives validation, the process does not end.

Its performance continues to be monitored.

It can become a Champion.

It can be challenged.

It can deteriorate.

And it can lose the right to trade.

That leads to one principle I consider fundamental:

Strategies should not be trusted because they worked.

They should be trusted only while the evidence supporting them remains strong.

That philosophy became part of the foundation of QuantMatrix FX+Gold V8.4.

Rafael Haddad
Creator of QuantMatrix FX+Gold

#QuantMatrix #QuantTrading #AlgorithmicTrading #MetaTrader5 #MT5 #TradingSystems #ExpertAdvisor
12