Rafael Barreto Haddad / Profil
- Information
|
1 Jahr
Erfahrung
|
11
Produkte
|
4
Demoversionen
|
|
0
Jobs
|
0
Signale
|
0
Abonnenten
|
Entwickler der QuantMatrix Research Series für MetaTrader 5.
Ich entwickle quantitative Handelssysteme, adaptive Expert Advisors und Marktanalyse-Tools auf Grundlage historischer Daten, Strategievalidierung und kontinuierlicher Modellbewertung.
Die QuantMatrix-Forschung beschäftigt sich mit Strategieentdeckung, Champion/Challenger-Wettbewerb, Marktregimen, Wahrscheinlichkeitsanalyse, Volatilität, adaptivem Ein- und Ausstiegs-Timing, Robustheit und risikobewusster Ausführung.
Forschen → Validieren → Herausfordern → Ausführen → Überwachen → Anpassen.
Ich veröffentliche Indikatoren, Expert Advisors, Forschungswerkzeuge und technische Inhalte mit Schwerpunkt auf systematischem und algorithmischem Trading.
Historische Ergebnisse, Wahrscheinlichkeiten und Backtests garantieren keine zukünftige Performance.
Rafael Haddad
Creator, QuantMatrix Research Series
Fügen Sie Freunde über ihre Profile oder über die Suche hinzu, und Sie können mit ihnen kommunizieren und ihre Aktivität auf der Webseite verfolgen.
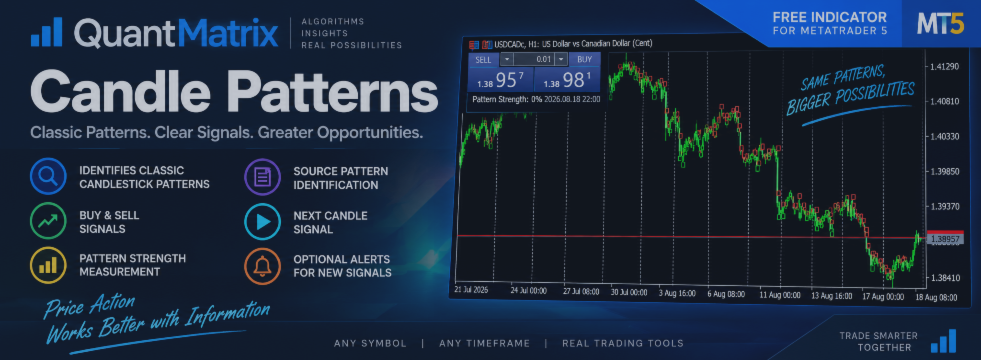
QuantMatrix Candle Patterns: How to Read Candlestick Signals Correctly
The indicator automatically identifies classic candlestick formations and displays the corresponding BUY or SELL signal on the following candle, only after the source pattern has been confirmed.
It includes:
• Bullish and bearish candlestick patterns
• BUY and SELL signals
• Pattern Strength measurement
• Source Pattern identification
• Next Candle Signal display
• Optional alerts
• Support for any symbol and timeframe
Pattern Strength represents the structural quality of the detected formation. It is not a historical probability of profit.
QuantMatrix Candle Patterns is available free on the MQL5 Market.
#MQL5 #MetaTrader5 #CandlestickPatterns #PriceAction #TradingIndicators #QuantMatrix
„QuantMatrix Candle Patterns“ ist ein kostenloser MetaTrader-5-Indikator, der dazu dient, klassische Kerzenmuster direkt im Chart zu erkennen. Der Indikator analysiert abgeschlossene Kerzen und erkennt bekannte bullische, bärische und neutrale Kursmuster. Wenn eine gültige bullische oder bärische Formation bestätigt wird, wird das entsprechende KAUF- oder VERKAUF-Signal auf der folgenden Kerze angezeigt. Das bedeutet, dass das Signal erst generiert wird, nachdem das Ausgangsmuster vollständig
QM Candle Timing Meter ist ein kostenloser MetaTrader-5-Indikator, der entwickelt wurde, um eine einfache Frage zu beantworten: Wie weit bin ich in der aktuellen Kerze im Verzug? Ein Handelssignal kann technisch gesehen zwar noch gültig sein, doch der Zeitpunkt des Einstiegs hat sich bereits erheblich verschoben. So unterscheidet sich beispielsweise ein Einstieg in den ersten Minuten einer H1-Kerze erheblich von einem Einstieg, wenn bereits 90 % dieser Kerze vergangen sind. Der QM Candle Timing
One detail can significantly change the behavior of a trading strategy:
the moment when the trade is actually entered.
Imagine an M15 strategy generates a BUY condition shortly after a new candle begins.
If the entry happens during the first 10% of the candle:
the movement may only be starting;
the entry may still be close to the original signal;
much of the candle's potential range may still be ahead;
the distance to invalidation may remain relatively small.
Now imagine taking exactly the same BUY condition when 85% of the candle has already elapsed.
The technical condition may still be true.
The moving average may still be bullish.
Momentum may still be positive.
Price may still be above the breakout level.
But the trade is no longer identical.
A large part of the current movement may already have happened.
This creates an important distinction:
Signal state ≠ entry event
A condition can remain active long after the event that originally created the opportunity.
Consider a moving-average crossover.
If the fast average crossed above the slow average 20 candles ago, the fast average may still be above the slow average today.
That tells us something about the current market state.
But it does not automatically mean that opening a new trade today is statistically equivalent to entering when the crossover happened.
The same problem exists inside a single candle.
An entry made during the first 10% of an M15 candle should not automatically be treated as equivalent to an entry made during its final 10%.
Possible differences include:
entry price;
remaining movement;
distance to invalidation;
short-term exhaustion;
available reward relative to risk;
volatility already consumed by the candle.
This is why timing deserves to be measured separately from direction.
A simple analytical framework is to divide the candle into temporal zones:
0–25% — Early
25–50% — Developing
50–75% — Late
75–100% — Very Late
These percentages are not universal trading rules.
They are measurement zones.
The more useful question is not simply:
“Is the BUY condition still true?”
It is:
“Is this still the same entry opportunity that produced the historical behavior of the strategy?”
This distinction is part of the research behind QuantMatrix.
It is also the idea behind the free QM Candle Timing Meter, a MetaTrader 5 tool designed to measure how much of the current candle has already elapsed.
The indicator does not predict direction and does not generate BUY or SELL signals.
Its purpose is simpler:
measure timing before timing becomes an unnoticed variable in the trade.
Research → Validate → Challenge → Execute → Monitor → Adapt
Rafael Haddad
QuantMatrix Research Lab
Historical observations, probabilities and analytical tools do not guarantee future trading performance.
QM FlowVision X1 Visueller Multi-Faktor-Handelsindikator mit historischer Wahrscheinlichkeit, Marktfluss, Momentum, Divergenz und Kontext über mehrere Zeitrahmen hinweg QM FlowVision X1 ist ein visueller Indikator zur Entscheidungsunterstützung für MetaTrader 5, der darauf ausgelegt ist, verschiedene Marktbedingungen in einen einfachen und übersichtlichen Handelsstatus umzuwandeln. Anstatt isolierte Oszillatoren ohne Interpretation anzuzeigen, kombiniert FlowVision Momentum, Geldfluss, RSI
Over the past months, I have been developing different tools, indicators and Expert Advisors for MetaTrader 5.
What began as individual experiments is gradually becoming something more structured:
**QuantMatrix Research Lab.**
QuantMatrix is a research project focused on systematic and quantitative trading.
The central idea is not to build one strategy and assume it will work forever.
Instead, the research explores how trading systems can:
• discover strategies from historical data
• compare competing models
• identify different market regimes
• measure probabilities instead of relying only on binary signals
• improve entry and exit timing
• evaluate robustness and drawdown
• replace models when their statistical evidence deteriorates
The development philosophy can be summarized as:
**Research → Validate → Challenge → Execute → Monitor → Adapt**
The QuantMatrix ecosystem will include three main areas:
**QM Free Tools**
Free indicators and analytical tools for traders and developers.
**QuantMatrix Pro**
More advanced analytical tools and probability-based indicators.
**QuantMatrix Systems**
Adaptive Expert Advisors built around strategy research, competition and continuous evaluation.
There is also a fourth area:
**QuantMatrix Research**
This is where experimental architectures are tested, including ideas that may succeed, fail, evolve or eventually become new tools.
Not every experiment needs to become a product.
Sometimes discovering why an idea does not work is just as valuable as discovering one that does.
I will increasingly use this profile to share that development process, technical ideas, free tools and the evolution of the QuantMatrix architecture.
No trading model can eliminate uncertainty, and historical performance or backtests cannot guarantee future results.
The objective of QuantMatrix Research Lab is different:
**measure uncertainty, test ideas and make systematic decisions based on evidence.**
Rafael Haddad
Creator of QuantMatrix Research Lab
QuantMatrix – Wahrscheinlichkeit historischer Kursbewegungen QuantMatrix Historical Move Probability ist ein statistischer Indikator für MetaTrader 5, der die aktuelle Kursbewegung mit ähnlichen Bewegungen in den historischen Daten des ausgewählten Symbols und Zeitraums vergleicht. Die Kursbewegungen werden mithilfe der Average True Range (ATR) normiert. Dadurch lassen sich Bewegungen aus verschiedenen historischen Zeiträumen im Verhältnis zur jeweiligen Volatilität des jeweiligen Zeitraums
Markets rarely provide absolute answers.
A technical condition can be bullish while volatility is increasing, momentum is weakening and historical behavior suggests uncertainty. Reducing all of this information to a single arrow can hide useful context.
This is one of the ideas behind the **QuantMatrix Research Series**.
Instead of asking only:
**BUY or SELL?**
I prefer to ask:
• What is the current market regime?
• How strong is the directional evidence?
• What happened historically under similar conditions?
• Is the signal still timely?
• Is there enough evidence to trade at all?
Sometimes the most useful output is not BUY or SELL.
It is simply:
**NO TRADE.**
Quantitative analysis is not about predicting every market movement. It is about measuring available information, uncertainty and risk consistently.
**Rafael Haddad**
QuantMatrix Research Series
QuantMatrix Wick Pressure QuantMatrix Wick Pressure ist ein technischer Indikator für MetaTrader 5, der das Verhältnis zwischen den oberen und unteren Dochten der Kerzen misst und diese Informationen in einen numerischen Druckwert umwandelt. Die Dochte der Kerzen stellen Kursbewegungen dar, die über den Kerzenkörper hinausgingen, bevor der Kurs von diesen Niveaus zurückkehrte. Der Indikator misst dieses Abprallverhalten über aufeinanderfolgende Kerzen hinweg und zeigt das Ergebnis in einem
QuantMatrix Probability AI PRO QuantMatrix Probability AI PRO ist ein technischer Indikator für MetaTrader 5, der dazu dient, die aktuellen Marktbedingungen zu bewerten und diese als prozentuale Schätzwerte für „KAUFEN“, „VERKAUFEN“ und „NEUTRAL“ darzustellen. Der Indikator kombiniert mehrere Marktkennzahlen, darunter Trend, Momentum, Volatilität, Kursposition, das Verhalten der Dochte bei Kerzencharts sowie Ausbruchbedingungen. Zudem vergleicht er die aktuelle Marktlage mit ähnlichen
QuantMatrix Probability AI – kostenlos QuantMatrix Probability AI Free ist ein technischer Indikator für MetaTrader 5, der verschiedene Messgrößen der aktuellen Marktbedingungen zu drei numerischen Schätzwerten zusammenfasst. Der Indikator verwendet bei seiner Berechnung exponentielle gleitende Durchschnitte, den Relative Strength Index (RSI), die Average True Range (ATR) und die aktuelle Kursposition. Diese Kennzahlen werden zu einem normalisierten Marktwert zusammengefasst. Die daraus
QuantMatrix False Breakout Detector Der QuantMatrix False Breakout Detector ist ein technischer Indikator für MetaTrader 5, der potenzielle gescheiterte Ausbrüche aus den jüngsten Kursbereichen identifiziert. Der Indikator berechnet das höchste Hoch und das tiefste Tief innerhalb eines konfigurierbaren historischen Zeitraums. Anschließend wird geprüft, ob der aktuelle Kurs eines dieser Niveaus um einen minimalen, volatilitätsbereinigten Abstand überschreitet und anschließend wieder innerhalb der
QuantMatrix Candle Exhaustion QuantMatrix Candle Exhaustion ist ein technischer Indikator für MetaTrader 5, der Kerzen identifiziert, die vordefinierte Preisausdehnungs- und Dochtmerkmale aufweisen. Der Indikator vergleicht die Spanne der aktuellen Kerze mit der durchschnittlichen Spanne der vorherigen Kerzen. Wenn die Spanne der Kerze den konfigurierten Schwellenwert für die historische Spanne überschreitet, werden ihre obere und untere Dochte bewertet. Ein bullischer Erschöpfungsmarker kann
QuantMatrix Volatilitätsregime QuantMatrix Volatility Regime ist ein technischer Indikator für MetaTrader 5, der die aktuelle Volatilität des ausgewählten Symbols und Zeitrahmens bewertet. Der Indikator nutzt die Average True Range (ATR), um die aktuelle Volatilität mit einer historischen Basislinie zu vergleichen, die aus früheren Kerzen berechnet wird. Auf der Grundlage dieses Vergleichs wird die aktuelle Marktlage einem von vier Volatilitätsregimen zugeordnet: LOW – Die aktuelle Volatilität
One of the most dangerous assumptions in algorithmic trading is that once a strategy has been validated, the hard work is over.
It isn't.
Markets change.
Volatility changes.
Correlations change.
Regimes change.
And a strategy that once looked robust can slowly lose the conditions that made it effective.
That is why QuantMatrix FX+Gold V8.4 was built around a different idea:
**Validation is not a finish line. It is a temporary permission to trade.**
A strategy can become a Champion.
But Champions are monitored.
Challengers remain available.
Forward evidence keeps accumulating.
If expectancy deteriorates, if behavior drifts away from historical patterns or if market conditions change, the system can reduce confidence, suspend the model or promote a stronger alternative.
The goal is not to defend a strategy because it worked in the past.
The goal is to keep asking:
**Does this strategy still deserve capital now?**
That question is much harder than simply finding a profitable backtest.
It is also much more important.
**QuantMatrix FX+Gold V8.4**
Adaptive. Quantitative. Multi-Market.
**Rafael Haddad**
Creator of QuantMatrix FX+Gold
#QuantMatrix #AlgorithmicTrading #QuantTrading #MetaTrader5 #ExpertAdvisor #ForexTrading #GoldTrading #TradingSystems
Finding a profitable strategy is easy.
Finding one that survives serious validation is much harder.
This became one of the core principles behind my quantitative research:
A good backtest is not enough.
When QuantMatrix discovers a promising model, that model does not automatically receive permission to trade.
It must survive.
Different data samples.
Train / Validation / Test separation.
Walk-Forward analysis.
Unseen Holdout data.
Minimum trade requirements.
Transaction costs.
Drawdown limits.
Statistical confidence tests.
And robustness checks designed to expose strategies that may have succeeded simply by chance.
The objective is not to find the strategy with the most beautiful historical equity curve.
The objective is to eliminate fragile strategies.
And even after a strategy survives validation, the process does not end.
Its performance continues to be monitored.
It can become a Champion.
It can be challenged.
It can deteriorate.
And it can lose the right to trade.
That leads to one principle I consider fundamental:
Strategies should not be trusted because they worked.
They should be trusted only while the evidence supporting them remains strong.
That philosophy became part of the foundation of QuantMatrix FX+Gold V8.4.
Rafael Haddad
Creator of QuantMatrix FX+Gold
#QuantMatrix #QuantTrading #AlgorithmicTrading #MetaTrader5 #MT5 #TradingSystems #ExpertAdvisor