Rafael Barreto Haddad
  • Rafael Haddad → QuantMatrix → quantitative trading research al Quantitative Trading Systems Researcher
  • Brasile
  • 1456
  • Informazioni
1 anno
esperienza
11
prodotti
4
versioni demo
0
lavori
0
segnali
0
iscritti
Rafael Haddad → QuantMatrix → quantitative trading research al Quantitative Trading Systems Researcher
X
Ricercatore di sistemi quantitativi di trading | Creatore di QuantMatrix Research Series | MetaTrader 5

Creatore della serie di ricerca QuantMatrix per MetaTrader 5.

Sviluppo sistemi quantitativi di trading, Expert Advisor adattivi e strumenti di analisi del mercato basati su dati storici, validazione delle strategie e valutazione continua dei modelli.

La ricerca QuantMatrix esplora la scoperta di strategie, la competizione Champion/Challenger, i regimi di mercato, l'analisi probabilistica, la volatilità, il timing adattivo di entrata e uscita, la robustezza e l'esecuzione orientata alla gestione del rischio.

Ricerca → Validazione → Confronto → Esecuzione → Monitoraggio → Adattamento.

Pubblico indicatori, Expert Advisor, strumenti di ricerca e contenuti tecnici dedicati al trading sistematico e algoritmico.

Risultati storici, probabilità e backtest non garantiscono performance future.

Rafael Haddad
Creatore, QuantMatrix Research Series
Amici

Aggiungi amici tramite il loro profilo o la ricerca utente e sarai in grado di vedere se sono online

Rafael Barreto Haddad
Candlestick patterns are among the most widely used tools in price action analysis. Patterns such as Hammer, Engulfing, Morning Star and Shooting Star are easy to recognize in theory, but manual identification can become subjective when dozens or hundreds of candles must be analyzed...
Rafael Barreto Haddad
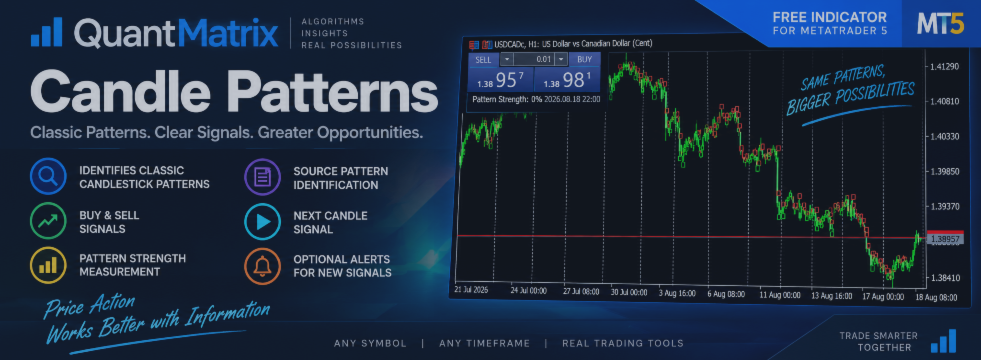
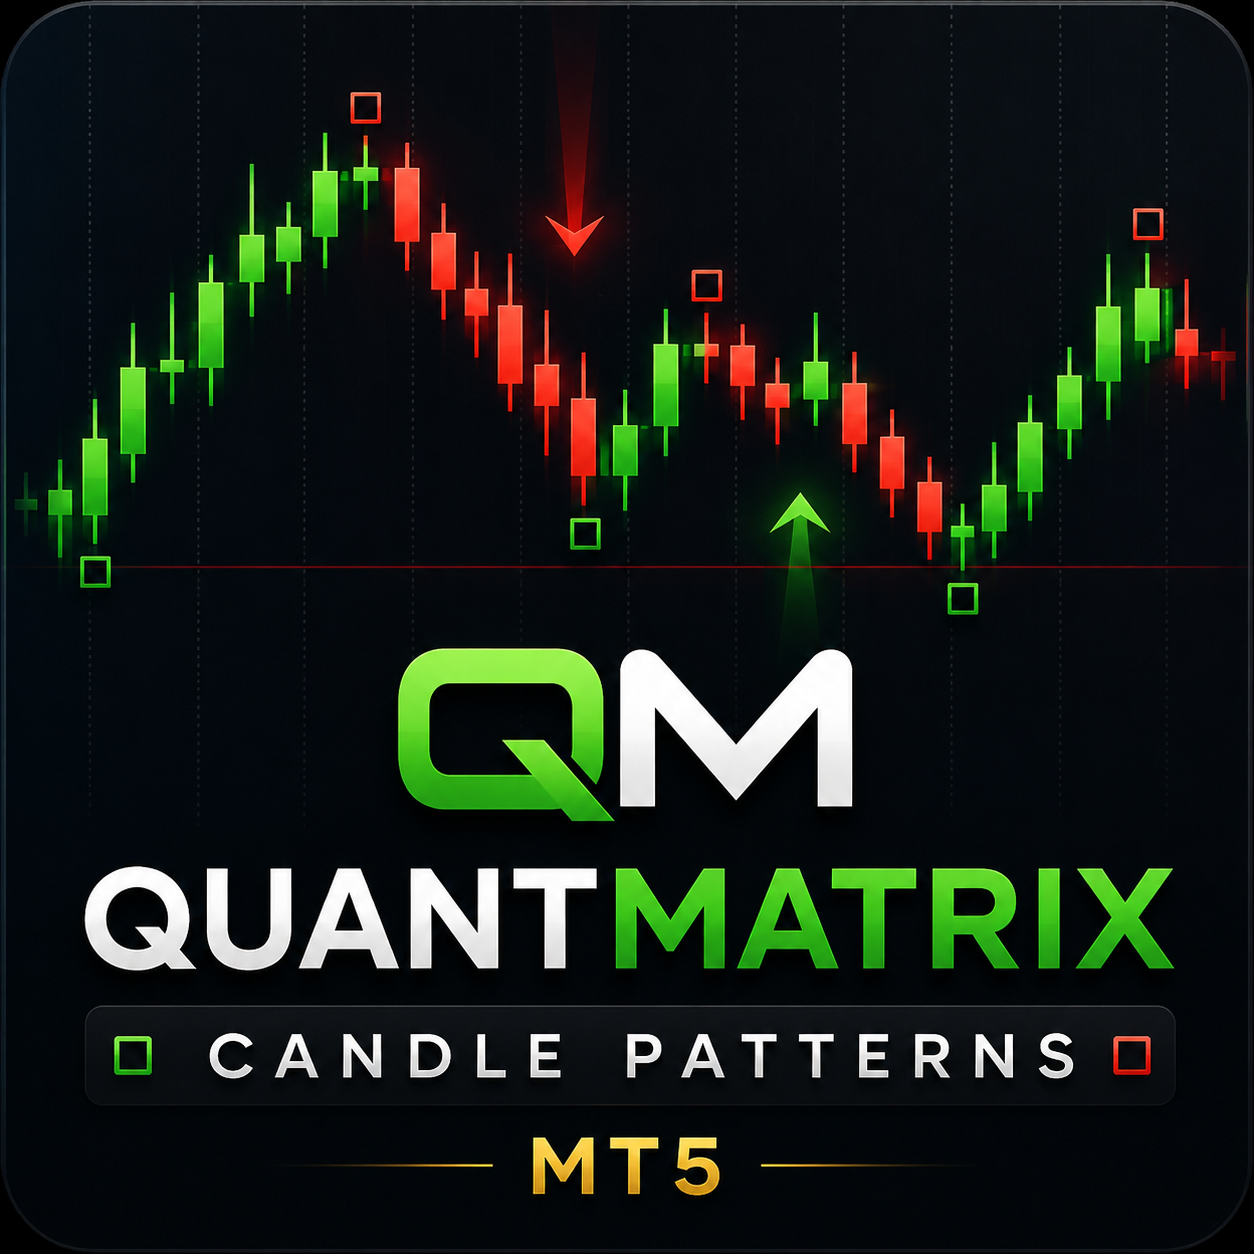
QuantMatrix Candle Patterns is now available for MetaTrader 5.

The indicator automatically identifies classic candlestick formations and displays the corresponding BUY or SELL signal on the following candle, only after the source pattern has been confirmed.

It includes:

• Bullish and bearish candlestick patterns
• BUY and SELL signals
• Pattern Strength measurement
• Source Pattern identification
• Next Candle Signal display
• Optional alerts
• Support for any symbol and timeframe

Pattern Strength represents the structural quality of the detected formation. It is not a historical probability of profit.

QuantMatrix Candle Patterns is available free on the MQL5 Market.

#MQL5 #MetaTrader5 #CandlestickPatterns #PriceAction #TradingIndicators #QuantMatrix
Rafael Barreto Haddad Prodotto pubblicato

QuantMatrix Candle Patterns is a free MetaTrader 5 indicator designed to identify classic candlestick formations directly on the chart. The indicator analyzes completed candles and detects recognized bullish, bearish and neutral price-action patterns. When a valid bullish or bearish formation is confirmed, the corresponding BUY or SELL signal is displayed on the following candle . This means the signal is only generated after the source pattern has been completed. The indicator also displays a

Rafael Barreto Haddad Prodotto pubblicato

QM Candle Timing Meter is a free MetaTrader 5 indicator designed to answer one simple question: How late am I in the current candle? A trading signal may still be technically valid while the timing of the entry has already changed significantly. For example, entering during the first minutes of an H1 candle is very different from entering when 90% of that candle has already elapsed. QM Candle Timing Meter continuously measures the temporal position of the current candle and displays this

Rafael Barreto Haddad
A valid signal does not always mean a valid entry

One detail can significantly change the behavior of a trading strategy:

the moment when the trade is actually entered.

Imagine an M15 strategy generates a BUY condition shortly after a new candle begins.

If the entry happens during the first 10% of the candle:

the movement may only be starting;
the entry may still be close to the original signal;
much of the candle's potential range may still be ahead;
the distance to invalidation may remain relatively small.

Now imagine taking exactly the same BUY condition when 85% of the candle has already elapsed.

The technical condition may still be true.

The moving average may still be bullish.
Momentum may still be positive.
Price may still be above the breakout level.

But the trade is no longer identical.

A large part of the current movement may already have happened.

This creates an important distinction:

Signal state ≠ entry event

A condition can remain active long after the event that originally created the opportunity.

Consider a moving-average crossover.

If the fast average crossed above the slow average 20 candles ago, the fast average may still be above the slow average today.

That tells us something about the current market state.

But it does not automatically mean that opening a new trade today is statistically equivalent to entering when the crossover happened.

The same problem exists inside a single candle.

An entry made during the first 10% of an M15 candle should not automatically be treated as equivalent to an entry made during its final 10%.

Possible differences include:

entry price;
remaining movement;
distance to invalidation;
short-term exhaustion;
available reward relative to risk;
volatility already consumed by the candle.

This is why timing deserves to be measured separately from direction.

A simple analytical framework is to divide the candle into temporal zones:

0–25% — Early
25–50% — Developing
50–75% — Late
75–100% — Very Late

These percentages are not universal trading rules.

They are measurement zones.

The more useful question is not simply:

“Is the BUY condition still true?”

It is:

“Is this still the same entry opportunity that produced the historical behavior of the strategy?”

This distinction is part of the research behind QuantMatrix.

It is also the idea behind the free QM Candle Timing Meter, a MetaTrader 5 tool designed to measure how much of the current candle has already elapsed.

The indicator does not predict direction and does not generate BUY or SELL signals.

Its purpose is simpler:

measure timing before timing becomes an unnoticed variable in the trade.

Research → Validate → Challenge → Execute → Monitor → Adapt

Rafael Haddad
QuantMatrix Research Lab

Historical observations, probabilities and analytical tools do not guarantee future trading performance.
Rafael Barreto Haddad Prodotto pubblicato

QM FlowVision X1 Visual Multi-Factor Trading Indicator with Historical Probability, Market Flow, Momentum, Divergence and Multi-Timeframe Context QM FlowVision X1 is a visual decision-support indicator for MetaTrader 5 designed to transform multiple market conditions into a simple and readable trading state. Instead of displaying isolated oscillators without interpretation, FlowVision combines momentum, money flow, RSI, Stochastic RSI, divergence and higher-timeframe context into a unified 0–100

Rafael Barreto Haddad
**Introducing QuantMatrix Research Lab**

Over the past months, I have been developing different tools, indicators and Expert Advisors for MetaTrader 5.

What began as individual experiments is gradually becoming something more structured:

**QuantMatrix Research Lab.**

QuantMatrix is a research project focused on systematic and quantitative trading.

The central idea is not to build one strategy and assume it will work forever.

Instead, the research explores how trading systems can:

• discover strategies from historical data
• compare competing models
• identify different market regimes
• measure probabilities instead of relying only on binary signals
• improve entry and exit timing
• evaluate robustness and drawdown
• replace models when their statistical evidence deteriorates

The development philosophy can be summarized as:

**Research → Validate → Challenge → Execute → Monitor → Adapt**

The QuantMatrix ecosystem will include three main areas:

**QM Free Tools**
Free indicators and analytical tools for traders and developers.

**QuantMatrix Pro**
More advanced analytical tools and probability-based indicators.

**QuantMatrix Systems**
Adaptive Expert Advisors built around strategy research, competition and continuous evaluation.

There is also a fourth area:

**QuantMatrix Research**

This is where experimental architectures are tested, including ideas that may succeed, fail, evolve or eventually become new tools.

Not every experiment needs to become a product.

Sometimes discovering why an idea does not work is just as valuable as discovering one that does.

I will increasingly use this profile to share that development process, technical ideas, free tools and the evolution of the QuantMatrix architecture.

No trading model can eliminate uncertainty, and historical performance or backtests cannot guarantee future results.

The objective of QuantMatrix Research Lab is different:

**measure uncertainty, test ideas and make systematic decisions based on evidence.**

Rafael Haddad
Creator of QuantMatrix Research Lab
Rafael Barreto Haddad Prodotto pubblicato

QuantMatrix Historical Move Probability QuantMatrix Historical Move Probability is a statistical indicator for MetaTrader 5 that compares the current price movement with similar movements found in the historical data of the selected symbol and timeframe. Price movements are normalized using Average True Range (ATR). This allows movements from different historical periods to be compared relative to the volatility present at each period. The indicator searches the configured historical sample for

Rafael Barreto Haddad
**Why I prefer probabilities over simple BUY/SELL signals**

Markets rarely provide absolute answers.

A technical condition can be bullish while volatility is increasing, momentum is weakening and historical behavior suggests uncertainty. Reducing all of this information to a single arrow can hide useful context.

This is one of the ideas behind the **QuantMatrix Research Series**.

Instead of asking only:

**BUY or SELL?**

I prefer to ask:

• What is the current market regime?
• How strong is the directional evidence?
• What happened historically under similar conditions?
• Is the signal still timely?
• Is there enough evidence to trade at all?

Sometimes the most useful output is not BUY or SELL.

It is simply:

**NO TRADE.**

Quantitative analysis is not about predicting every market movement. It is about measuring available information, uncertainty and risk consistently.

**Rafael Haddad**
QuantMatrix Research Series
Rafael Barreto Haddad Prodotto pubblicato

QuantMatrix Wick Pressure QuantMatrix Wick Pressure is a technical indicator for MetaTrader 5 that measures the relationship between upper and lower candlestick wicks and converts this information into a numerical pressure measurement. Candlestick wicks represent price movement that occurred beyond the candle body before price returned from those levels. The indicator measures this rejection behavior over consecutive candles and displays the result in a separate indicator window. Positive values

Rafael Barreto Haddad Prodotto pubblicato

QuantMatrix Probability AI PRO QuantMatrix Probability AI PRO is a technical indicator for MetaTrader 5 designed to evaluate current market conditions and present them as BUY, SELL and NEUTRAL percentage estimates. The indicator combines several market measurements, including trend, momentum, volatility, price position, candlestick wick behavior and breakout conditions. It also compares the current market state with similar historical situations found in the selected symbol and timeframe. The

Rafael Barreto Haddad Prodotto pubblicato

QuantMatrix Probability AI Free QuantMatrix Probability AI Free is a technical indicator for MetaTrader 5 that combines several measurements of current market conditions into three numerical estimates. The indicator uses exponential moving averages, Relative Strength Index (RSI), Average True Range (ATR) and the current price position in its calculation. These measurements are combined into a normalized market score. The resulting information is displayed on the chart as: BUY percentage SELL

Rafael Barreto Haddad Prodotto pubblicato

QuantMatrix False Breakout Detector QuantMatrix False Breakout Detector is a technical indicator for MetaTrader 5 that identifies potential failed breakouts of recent price ranges. The indicator calculates the highest high and lowest low within a configurable historical period. It then evaluates whether the current price moves beyond one of these levels by a minimum volatility-adjusted distance and subsequently closes back inside the previous range. Average True Range (ATR) is used to adjust the

Rafael Barreto Haddad Prodotto pubblicato

QuantMatrix Candle Exhaustion QuantMatrix Candle Exhaustion is a technical indicator for MetaTrader 5 that identifies candles showing predefined price expansion and wick characteristics. The indicator compares the range of the current candle with the average range of previous candles. When the candle range exceeds the configured historical range threshold, its upper and lower wicks are evaluated. A bullish exhaustion marker can be displayed when an expanded bullish candle also contains the

Rafael Barreto Haddad Prodotto pubblicato

QuantMatrix Volatility Regime QuantMatrix Volatility Regime is a technical indicator for MetaTrader 5 that evaluates the current volatility of the selected symbol and timeframe. The indicator uses Average True Range (ATR) to compare current volatility with a historical baseline calculated from previous bars. Based on this comparison, the current market condition is classified into one of four volatility regimes: LOW – current volatility is below the historical baseline. NORMAL – current

Rafael Barreto Haddad
Timing Matters: Why a Trading Strategy Should Not Enter Late In algorithmic trading, we often spend enormous amounts of time deciding what should trigger an entry. Much less attention is given to when that signal is still valid . That distinction matters more than it seems...
Rafael Barreto Haddad
## A Strategy Should Never Be Trusted Forever

One of the most dangerous assumptions in algorithmic trading is that once a strategy has been validated, the hard work is over.

It isn't.

Markets change.

Volatility changes.

Correlations change.

Regimes change.

And a strategy that once looked robust can slowly lose the conditions that made it effective.

That is why QuantMatrix FX+Gold V8.4 was built around a different idea:

**Validation is not a finish line. It is a temporary permission to trade.**

A strategy can become a Champion.

But Champions are monitored.

Challengers remain available.

Forward evidence keeps accumulating.

If expectancy deteriorates, if behavior drifts away from historical patterns or if market conditions change, the system can reduce confidence, suspend the model or promote a stronger alternative.

The goal is not to defend a strategy because it worked in the past.

The goal is to keep asking:

**Does this strategy still deserve capital now?**

That question is much harder than simply finding a profitable backtest.

It is also much more important.

**QuantMatrix FX+Gold V8.4**

Adaptive. Quantitative. Multi-Market.

**Rafael Haddad**
Creator of QuantMatrix FX+Gold

#QuantMatrix #AlgorithmicTrading #QuantTrading #MetaTrader5 #ExpertAdvisor #ForexTrading #GoldTrading #TradingSystems
Rafael Barreto Haddad
Strategies Must Earn the Right to Trade A profitable backtest is persuasive. Sometimes, dangerously persuasive. You see a clean equity curve, a respectable Profit Factor, manageable drawdown and a sequence of trades that seems to confirm everything you hoped the strategy would do...
Rafael Barreto Haddad
From Indicators to Strategy Discovery: Why I Changed the Way I Think About Trading Robots For years, my approach to algorithmic trading followed a very familiar path...
Rafael Barreto Haddad
Strategies Must Earn the Right to Trade

Finding a profitable strategy is easy.

Finding one that survives serious validation is much harder.

This became one of the core principles behind my quantitative research:

A good backtest is not enough.

When QuantMatrix discovers a promising model, that model does not automatically receive permission to trade.

It must survive.

Different data samples.

Train / Validation / Test separation.

Walk-Forward analysis.

Unseen Holdout data.

Minimum trade requirements.

Transaction costs.

Drawdown limits.

Statistical confidence tests.

And robustness checks designed to expose strategies that may have succeeded simply by chance.

The objective is not to find the strategy with the most beautiful historical equity curve.

The objective is to eliminate fragile strategies.

And even after a strategy survives validation, the process does not end.

Its performance continues to be monitored.

It can become a Champion.

It can be challenged.

It can deteriorate.

And it can lose the right to trade.

That leads to one principle I consider fundamental:

Strategies should not be trusted because they worked.

They should be trusted only while the evidence supporting them remains strong.

That philosophy became part of the foundation of QuantMatrix FX+Gold V8.4.

Rafael Haddad
Creator of QuantMatrix FX+Gold

#QuantMatrix #QuantTrading #AlgorithmicTrading #MetaTrader5 #MT5 #TradingSystems #ExpertAdvisor
12