Edvinas Jakas
Edvinas Jakas
5 (7)
  • Información
no
experiencia
5
productos
12
versiones demo
0
trabajos
0
señales
0
suscriptores
Founder en MQL Workshop
Más de 5 años de experiencia en trading y análisis de mercados de divisas y materias primas.
Utilizo y desarrollo mis propios sistemas de trading.
Contáctame si tienes alguna pregunta.
¡Que tengas una buena experiencia operando!

Bróker recomendado: https://icmarkets.com/?camp=86686
Edvinas Jakas
Why Range Trading Support and Resistance Works Best in Neutral Markets >>>>>>Join MQL5 Channel<<<<<< Trading support and resistance can be tricky when market direction is unclear...
Edvinas Jakas
Trade Smarter, Not Harder Are you tired of technical charts giving you mixed signals? Most traders rely only on price, but the real market moves are driven by economic data...
Edvinas Jakas
Post publicado USD Economic Strength Index
Trade the Truth: USD Economic Strength Index Trading currency pairs or gold without knowing what is happening behind the scenes is like driving with your eyes closed. Most indicators only look at past price bars, which creates lag...
Edvinas Jakas Ha publicado el producto
Comentarios: 3
FREE

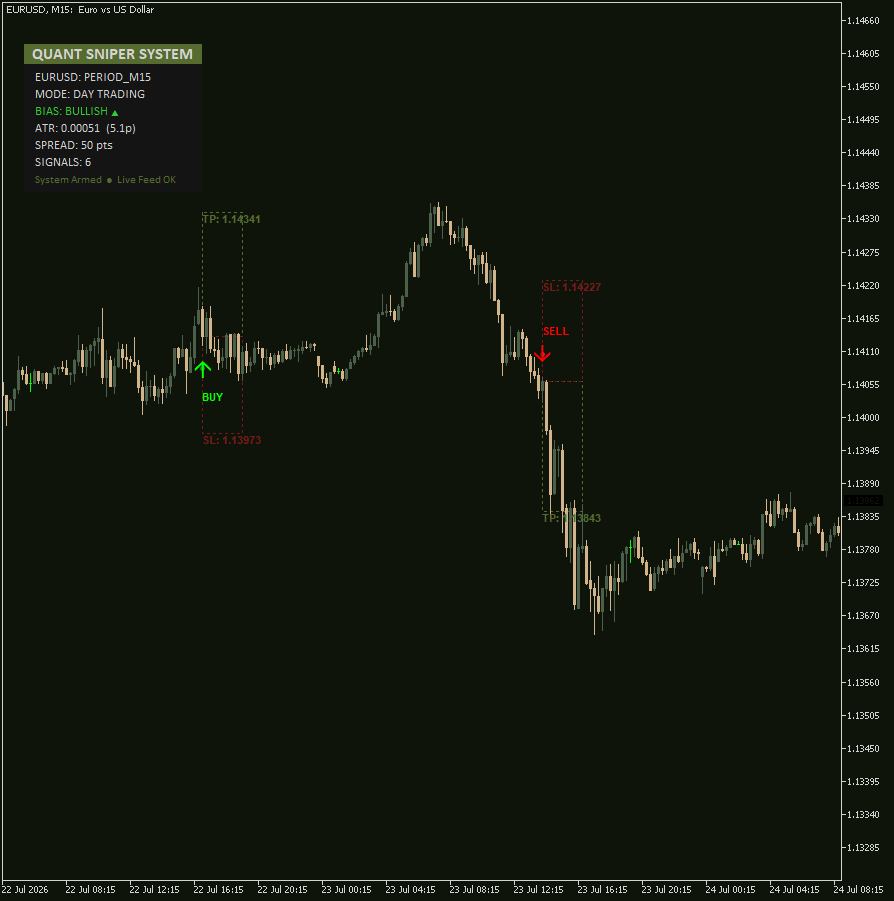
Sistema Quant Sniper El sistema Quant Sniper es un marco de negociación totalmente nuevo diseñado para indicarte exactamente cuándo comprar y vender en el mercado. Calcula los niveles de precios con alta probabilidad utilizando una fórmula matemática sólida. Con este sistema, no tendrás que hacer conjeturas: sabrás exactamente cuándo entrar en una operación y cuándo cerrarla para maximizar tu potencial de beneficios. Por qué elegir el sistema Quant Sniper: Basado en las matemáticas: esta

Edvinas Jakas
The Problem with Technical Indicators Most traders rely entirely on lagging technical indicators like Moving Averages or RSI to navigate ranging markets. However, geometric charts only show where the price went, not why it moved...
Edvinas Jakas
Markets move on macroeconomic data, not laggy technical lines. When high-impact news like NFP, CPI, or GDP drops, traditional price-action indicators get instantly obliterated. The USD Economic Strength Index is an elite institutional-grade matrix built natively for MetaTrader 5...
Edvinas Jakas
Edvinas Jakas
Have you ever entered a perfect technical breakout, only to see the market immediately reverse and chop you to pieces?

Most indicators fail because they calculate historical price data—telling you what already happened. To truly stay ahead of the market, you need to understand the fundamental fuel driving the currency trends.

Introducing the USD Economic Strength Index, a live macroeconomic tracking matrix built to uncover the real-time strength of the US Dollar and give you an unshakeable edge.

Let’s dive into the dashboard to see exactly how it maps fundamental truth directly onto your chart.

1. The USD Score Engine
At the heart of the dashboard is the USD Score, sitting at 57.8 / 100 . This mathematically measures the exact economic performance of the US Dollar over your chosen lookback period . A score of 57.8 shows that while the USD holds a minor economic advantage, it is far from overextended . This tells you that an aggressive, one-way trend is unlikely .

2. Neutral Market Bias Validation
The dashboard officially labels the US Dollar's bias as Neutral with High Confidence . Look at how beautifully this aligns with the GBPUSD Ranging market shown in the file named "A high USD score, driven by strong fundamentals like positive ‘Retail Sales mm +64.00’, translates to fundamental USD strength, creating a net bearish downtrend. When macro fundamentals flag a neutral bias, price action consolidates sideways rather than breaking out into big directional moves .

3. Macro Surprises (USD+ / USD- & NET Score)
The engine tracks raw economic data momentum via the USD+ / USD- (17 / 4) tile and a NET Score of +20.74 . Out of 21 tracked data releases, 17 surprised to the upside for the greenback, while only 4 missed . This net positive baseline acts as a fundamental floor for the dollar, keeping major assets supported at their technical range boundaries instead of letting them collapse .

4. News Impact Balance
The indicator processes underlying event gravity via the HIGH / MED (11 / 14) metric block . This highlights that 11 high-impact news events are balanced against 14 medium-impact consumer reports . Without an overwhelming, heavily one-sided fundamental catalyst to disrupt the status quo, high-volatility breaks are avoided, forcing currency pairs to stay inside structural ranges .

5. Individual Pair Bias Realignment
The matrix instantly converts the global USD data into actionable pair directions, explicitly locking the GBPUSD Pair Bias to Neutral . This automated alignment screams at you to stop trend-following and immediately switch your trading plan to play a strict range-bound environment .

6. Confidence Detail
Backed by historical dependability, the Confidence Detail panel reads Events 25 | Agree 68% . A 68% statistical agreement rate across 25 historical data markers mathematically verifies that the sideways market condition is authentic . This filter protects your capital by alerting you to ignore false technical breakout signals on lower timeframes .

7. Signal Drivers: The Economic Tug-of-War
The Signal Drivers panel shows you the exact macroeconomic catalysts fighting behind the scenes . It reveals positive energy from Crude Oil data countering a negative drag from Durable Goods Orders . These two forces are actively canceling each other's momentum out, functioning as the exact reason why price is trapped in a horizontal consolidation loop .

Why This Indicator Belongs In Your Trading Arsenal
The source code reveals a highly optimized, high-performance UI structure designed to filter out market noise . Rather than guessing what the next news release means, the algorithm automatically scores, decays, and normalizes incoming data into visual signals . It bridges the gap between raw economic calendar figures and real-time technical trading decisions .

Stop trading blindly against the macro current. Let fundamentals tell you when to trend, when to range, and when to stay on the sidelines.
Edvinas Jakas
Have you ever entered a perfect technical breakout, only to see the market immediately reverse and chop you to pieces? Most indicators fail because they calculate historical price data—telling you what already happened...
Edvinas Jakas
Edvinas Jakas
Stop chasing lagging technical indicators that leave you trapped on the wrong side of massive market moves. Successful trading begins with knowing where institutional money is flowing.

The USD Economic Strength Index is a fundamental trading matrix that processes real-time macroeconomic data to eliminate technical lag. By analyzing economic releases directly on your charts, it uncovers the true driving force behind major currency pairs. Take a look at how seamlessly the dashboard suggested the massive downward spiral below.

USD Score: Sitting at a strong 62.5 / 100, this evaluates the true underlying power of the greenback based entirely on actual economic data. It highlights a healthy dollar ready to dominate quote currencies.

Bias & Confidence: The system flags a Bullish Bias with High Confidence. When raw macroeconomic points consistently line up, the institutional stance becomes clear, warning you that counter-trend buying is highly risky.

USD+ / USD- & NET: The metric tiles show 41 positive releases against 32 negative ones over a 30-day lookback period. This gives us a positive NET score of +73.06, tipping the scale completely in favor of the US dollar.

Pair Bias Matrix: The indicator automatically processes the dollar's strength and translates it into direct asset directions, highlighting GBPUSD as Bearish.

Confidence Detail: Logging Events 83 | Agree 49% | High 29, this section reveals high agreement among high-impact releases, making the structural short trade highly reliable.

Signal Drivers: The panel pinpoints the exact catalyst driving the macro flow—in this case, a massive positive surprise in US Retail Sales m/m (+48.00). This fundamental fuel is what pushed the GBPUSD downtrend aggressively lower.

Why trade blindly when you can align your strategies with institutional data? The USD Economic Strength Index removes the guesswork, giving you a crystal-clear map of fundamental momentum in real time.


https://www.mql5.com/en/market/product/182259


Keywords: MQL5 Fundamental Indicator, USD Economic Strength Index, Macroeconomic Trading Dashboard, Forex Fundamental Analysis, GBPUSD Live Analysis, News Trading Indicator MT5.
Hashtags: #MQL5 #ForexTrading #FundamentalAnalysis #MT5 #GBPUSD #TradingIndicators #FXMacro
Edvinas Jakas
Stop chasing lagging technical indicators that leave you trapped on the wrong side of massive market moves. Successful trading begins with knowing where institutional money is flowing...
Edvinas Jakas
Discover how to avoid bad trades during market consolidations. Learn how the USD Economic Strength Index decodes macro data to predict flat regimes on currency pairs like USDJPY. Many technical traders lose their capital during horizontal price consolidations...
Edvinas Jakas
Stop fighting the big bank order flow. Most retail traders lose because they rely solely on lagging technical indicators that react only after institutional money has moved the market. Big banks trade macroeconomics...
Edvinas Jakas
How many times have you marked up a perfect "Smart Money Concept" (SMC) order block on GBPUSD, only to watch price smash right through it like wet paper? Institutional algorithms don't trigger multi-billion dollar trends because of geometric shapes drawn on a chart...
Edvinas Jakas
Edvinas Jakas
If you are trading purely on geometric shapes on a chart, you are missing the fuel that actually drives the market. Central banks and institutional algorithms do not move billions of dollars because of a trendline; they move capital based on macroeconomic data surprises.

The USD Economic Strength Index for MT5 fixes this problem. It brings native, real-time macroeconomic context straight to your charts, letting you trade alongside institutional volume rather than fighting against it.

Let's look at how it works using a real-world example on the GBPUSD H4 chart.

When you look at the above analysis, the structural trend becomes instantly transparent:

Instead of manually scraping economic calendars, the dashboard performs heavy algorithmic calculations under the hood to output three key trade-planning filters:

The Aggregated Baseline (USD Score): The indicator analyzes a 14-day cycle of major US data releases and calculates a dominant score of 80.3 / 100 . This mathematically confirms massive macroeconomic expansion . Because the US Dollar is the quote currency in GBPUSD, this aggressive fundamental strength acts as a permanent gravity well forcing the pair downward .

The Trend Filter (Strong Bullish Bias): The dashboard locks in a Strong Bullish Bias with Very High Confidence . This acts as an explicit warning system: Stop buying technical bounces. It keeps you strictly on the short side of the market where the real liquidity resides .

The Raw Catalyst (Signal Drivers): You can see exactly what is feeding the algorithms. A massive positive surprise in Retail Sales m/m (+64.00) serves as the primary fundamental catalyst . This clarity transforms short-term technical chart pullbacks into premium, high-probability sell entries.

When you align your technical triggers with undeniable fundamental momentum, you eliminate the guesswork. You know exactly what is moving the market, which pair is the absolute weakest link, and when to execute with maximum institutional backing.

Take your trading to the institutional level. Stop trading blind.


https://www.mql5.com/en/market/product/182259
Edvinas Jakas
If you are trading purely on geometric shapes on a chart, you are missing the fuel that actually drives the market. Central banks and institutional algorithms do not move billions of dollars because of a trendline; they move capital based on macroeconomic data surprises...
Edvinas Jakas
Edvinas Jakas
For a long time, I traded purely based on technical patterns. I would look at support lines, trendlines, and candlestick shapes. But too often, a clean technical setup would completely collapse the moment news hit the market, leaving me wondering what went wrong.

That frustration is why I built a tool to bring native economic data right onto the MT5 terminal. Markets aren’t moved by shapes on a screen; they are moved by underlying economic strength. When you combine chart data with fundamental truth, everything gets a lot clearer.

Let's look at a practical example using a recent USDJPY chart to show you exactly what I mean.

Below is a breakdown of how economic reality translates into a clean, tradable chart trend:

Instead of manually jumping back and forth between economic calendars, the dashboard organizes the heavy data lifting directly on your workspace:

The Core Macro Health (USD Score): The index compiles major US data releases over a 30-day lookback period and rates the overall trend. Here, the US Dollar sitting at 73.0 / 100 mathematically confirms strong economic expansion before you even look at a price pattern.
The Weighted Deviation (Net Value Index): The dashboard prints a positive NET score of +125.90. This calculation proves that the positive macro surprises heavily outweigh any minor negative data, establishing a massive fundamental green light for long positions.
The Specific Catalysts (Signal Drivers): You can see exactly what is powering the move. A stellar Retail Sales m/m (+64.00) release acts as the direct fuel, giving you the clarity to treat technical chart pullbacks as solid buying opportunities rather than trend reversals.

When an economy is fundamentally expanding, trying to look for a counter-trend setup or shorting market tops is a quick way to lose capital. This indicator doesn’t guess or use gimmicks; it simply pulls the raw calendar data from your broker’s server, handles the math under the hood, and presents a clear visual directional bias.

By knowing that the fundamental force is explicitly bullish, you can focus on high-probability technical setups that line up with institutional volume. It's about working smarter and taking the guesswork out of news events.

If you are tired of getting caught on the wrong side of high-impact data spikes, check out the tool on the market. It might be the missing piece your routine needs.

https://www.mql5.com/en/market/product/182259
Edvinas Jakas
For a long time, I traded purely based on technical patterns. I would look at support lines, trendlines, and candlestick shapes. But too often, a clean technical setup would completely collapse the moment news hit the market, leaving me wondering what went wrong...
Edvinas Jakas
Edvinas Jakas
Instead of sorting through confusing, messy online news feeds, let’s see how a native MT5 data engine breaks down a structural trend.

When you look beyond standard candlesticks via automated fundamental data processing, the market matrix clarifies:

The Fundamental Catalyst: The US economy experienced a powerful expansion, recording a high-confidence USD Score of 75.4 out of 100.

The Underlying Drivers: This aggressive dollar strength wasn't a guess—it was backed by hard data outperformance, led by a massive Retail Sales m/m surprise of +64.00.

The Structural Translation: Because Gold trades inversely to fundamentally dominant USD strength, the dashboard immediately flagged a clean Bearish Bias for XAUUSD.

While retail market participants consistently got trapped trying to buy minor technical support bounces, institutional smart money heavily shorted the rallies. The macro data gave a clear predictive trend direction long before lagging technical moving averages shifted.

You don’t need an economics degree or a secondary monitor open to news websites to protect your capital.

The USD Economic Strength Index for MT5 continuously tracks high- and medium-impact global economic calendar data straight from your broker’s native server database. It filters out conflicting noise, runs deviation mathematics under the hood, and transforms complex global macro metrics into clear visual trends directly on your charts.

Stop trading blind during major economic releases. Align your charts with true institutional momentum.

www.mql5.com/en/market/product/182259
Edvinas Jakas
Post publicado XAUUSD Analysis: Let The USD News Guide You
Instead of sorting through confusing, messy online news feeds, let’s see how a native MT5 data engine breaks down a structural trend: When you look beyond standard candlesticks via automated fundamental data processing, the market matrix clarifies: The Fundamental Catalyst: The US economy experie...
Edvinas Jakas
Post publicado Why XAUUSD Technical Analysis Fails
We have all been there. You spot a perfect H4 support zone, your favorite technical indicator says it is deeply "oversold," and you confidently click BUY . Minutes later, a massive drop completely obliterates your stop loss. The lines on your chart were perfect, so what went wrong...