• Información general
  • Comentarios (4)
  • Discusión (7)
  • Novedades

Smart Market structure concept

4

All about Smart Money Concepts Strategy: Market struture: internal or swing BOS, CHoCH; Orderblock; Liquity equal; Fair Value Gap with Consequent encroachment, Balanced price range; Level with Previous month, week, day level or in day level (PMH, PWH, PDH, HOD); BuySell Stops Liquidity (BSL, SSL); Liquidity Void Long Wicks; Premium and Discount; Candle pattern ...

"Smart Money Concepts" ( SMC ) is a fairly new yet widely used term amongst price action traders looking to more accurately navigate liquidity & find more optimal points of interest in the market. Trying to determine where institutional market participants have orders placed (buy or sell side liquidity) can be a very reasonable approach to finding more practical entries & exits based on price action. The indicator includes alerts for the presence of swing structures and many other relevant conditions. User can choose notification method include: MT terminal, MT mobile app, Telegram channel.

Update version 4.0 by add more function and perfomace increase.

New version SMC_3 is released with enhanced performance; smart OB scan, add volume of 1st, 2nd candle in OB; Alert when price inside previous OB, swing S/R level or internal S/R level

Dark template here. MT4 version here. Addition intruction here, I recommend new on SMC should read document which I synthetic from many good resource on internet.

*** For customer who already puchased this indicator, I upgrade to version 2.0 because of adding new feature include:

Add Order block. Setting for display in default is false.

Add Fair value gap. Setting for display in default is false.

Settings:

//--------Genneral Settings---------

Max bars back for calculate: Bar number should calculate when init indicator. Default is 1000


//--------Internal Structure---------

Internal Break of structure will show as horizontal dotted line from HH (or LL) point to breakout point. There are some config of iBOS as follow:

+Show Internal BOS: Config to show internal BOS (iBOS) or not

+Show Internal BOS text: Config to show text of iBOS or not

+Internal BOS bearish color: Config color of brearish iBOS color

+Internal BOS bullish color: Config color of bullish iBOS color

+Internal BOS font size: Config text "iBOS" size (color as line color)

+Alert when Internal BOS found: Config notificate when iBOS found


Internal Change of character (iCHoCH) will show as horizontal dotted line from HL (or LH) point to breakout point. There are some config of iCHoCH as follow:

+Show Internal CHoCH

+Show Internal CHoCH text

+Internal CHoCH bearish color

+Internal CHoCH bullish color

+Internal CHoCH font size

+Alert when Internal CHoCh found 


//--------Swing Structure---------

Swing Break of structure will show as horizontal dotted line from HH (or LL) point to breakout point. Swing mode will longer than Internal mode. It depend on pivot point length (can config at pivot point config section). There are some config of sBOS as follow:

+Show Swing BOS

+Show Swing BOS text

+Swing BOS bearish color

+Swing BOS bullish color

+Swing BOS font size

+Alert when Swing BOS found      


Swing Change of character (iCHoCH) will show as horizontal dotted line from HL (or LH) point to breakout point. There are some config of sCHoCH as follow:

+Show Swing CHoCH

+Show Swing CHoCH text

+Swing CHoCH bearish color

+Swing CHoCH bullish color

+Swing CHoCH font size

+Alert when Swing CHoCh found 


//--------Order block---------

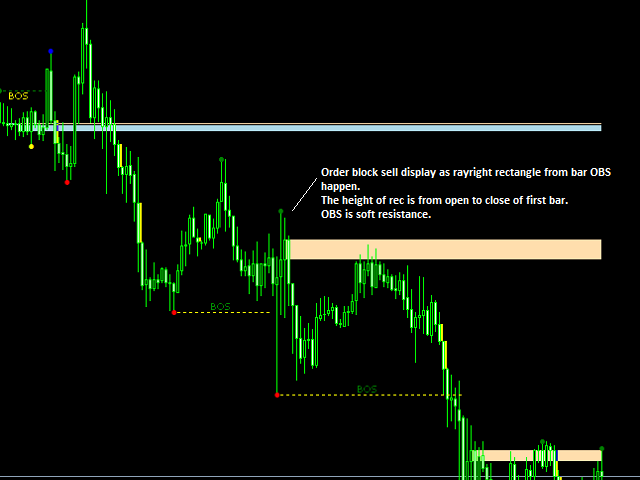
Order block is to composite candle. This indicator support 3 type of OB as follow:

 + Ob should close after BOS, CHoCH (1)

 + Ob should close before BOS, CHoCH (2)

 + Ob should close after Pivot point (3)

 + None above (4)

For (1),(2),(3): The "Distance from pivot BOS, CHoCH to OB" config will determine the maximum distance between OB and confirm condition point

Other config are:

+Show Internal Order block (iOB)

+OB type

+OB buy have to close valley, sell have to close peak: if OB type in (1),(2),(3) and this option = true, valid OB buy have to close to valley, valid OB sell have to close to peak

+Number of iOB to display on chart: limit the number of OBs displayed on the chart

+iOB up color

+iOB down color

+iOB font size

+Alert when Order Blocks appear

+Alert when after price inside ob: when turn on, iOB appear affter price go inside iOB, indicator will notificate.


--------Equal High,Low---------

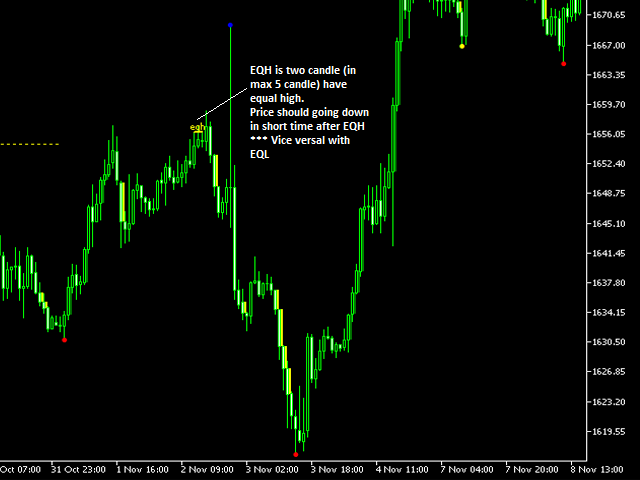
Equal high or low is 2 close candle have equal high or low. This will display on chart as solid line connect to equal point. There are some config as follow:

+Show EQ or not

+Bar Confirmation Length (min value 1): limit the maximum distance of 2 equal candles

+Equal font size

+Equal high font color

+Equal low font color

+Alert when equal high or low


//--------Fair Value Gap---------

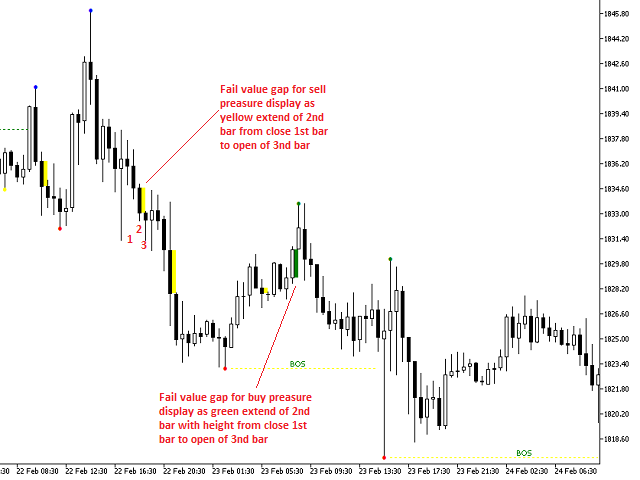
Fair Value Gaps are created within a three-candle sequence and are commonly visualized on the chart as a large candle whose neighboring candles’ upper and lower wicks do not fully overlap the large candle.

The area between neighboring candles’ upper and lower is imbalance area. The indicator will display imbalance area as filled small rectangle close to main candle.

We have a new concept "Balanced price range" - BPR: when FVG created and after that filled, the imbalance area become support or resistance level. This indicator display BPR as rectangle with no fill from imbalance to next 10 bar (config at "Balanced price range length in bar")

Consequent encroachment is when a fair value gap is filled by 50%, this is what is referred to as the mean threshold of fvg. Traders should keep in mind that price might not completely fill the fvg. therefore targeting the mean threshold is ideal not to miss trades.

Some config of FVG are:

+Show Fair value gap

+Color of FairValueGap created due to large buying pressure

+Color of FairValueGap created due to large selling pressure

+Show Consequent encroachment: indicator will show consequent encroachment as small line inside imbalance area at level=50%

+Consequent encroachment line color

+Show Balanced price range

+Max bar BPR should fill gap: max distance imbalance should be filled

+Balanced price range length in bar: BPR rectangle length

+Balanced price range length color

+Alert when Fair Value Gap Detection

+Alert when BPR detection


//--------Swing, internal high, low---------

The swing, internal high or low level should display as rectangle with no fill and extend to right edge of chart. For ease of viewing, the chart should be set to mode "Shift end of chart from right border". Inside the rectangle have some note about time, and price.

The config are:

+Swing Maxbar: this is number of bar from current that find highest or lowest level for swing period.

+Internal Maxbar: this is number of bar from current that find highest or lowest level for internal period.

+Show Previous Highs & Lows

+Alert if Highs & Lows appear

+Alert if price inside Previous Highs & Lows: when turn on, Level appear affter price go inside level, indicator will notificate.

+Swing support color

+Swing resistance color

+Internal support color

+Internal resistance color


//--------Level: PMH, PWH, PML, PWL...---------

This indicator show many type of level on chart:

-PMH, PML: Previous month high, low

-PWH, PML: Previous week high, low

-PDH, PDL: Previous day high, low

-HOD, HOL: High, low of day

There are some config as follow:

+Show Previous Month High, Low

+Previous Month High color

+Previous Month Low color

+Alert when price breakout Previous Month

//---

+Show Previous Week High, Low

+Previous Week High color

+Previous Week Low color

+Alert when price breakout Previous Week

//---

+Show Previous Day High, Low

+Previous Day High color

+Previous Day Low color

+Alert when price breakout Previous Day

//---

+Show High Of Day, Low of Day

+High Of Day color

+Low Of Day color

+Alert when price breakout High, low of day


//--------BuySell Stops Liquidity (BSL, SSL)

BuySell Stops Liquidity can be understood simply as the situation false to breakout. This is when price go higher than resistance and quickly go down to lower than resistance (opposite with support).

This indicator 

+ Level is PMH, PML, PWH, PML, PDH, PDL, HOD, HOL (type1)

+ Level is pivot point: when pivot_5 = pivot_3 and pivot_1>pivot_3 (for resistance), current price < pivot_3 (type2)

//-------- type1---------

+Show BSL for Previous Month High

+Previous Month BSL bar: max distance of false breakout

//--

+Show BSL for Previous Week High

+Previous Week BSL bar

//--

+Show BSL for Previous Day High

+Previous Day BSL bar

//--

+Show BSL for High Of Day

+High Of Day BSL bar

//--

+Alert when BSL appear

+BSL line color

//--

+BSL font size

//--

+Show SSL for Previous Month Low

+Previous Month BSL bar

//--

+Show SSL for Previous Week Low

+Previous Week BSL bar

//--

+Show SSL for Previous Day Low

+Previous Day BSL bar

//--

+Show SSL for High Of Day

+Low Of Day BSL bar

//-- display and alert

+Alert when SSL appear

+SSL line color

+SSL font size

//--------BSL, SSL by pivot point - type2---------

+BSL by pivot point

+BSL Equal level threshold: tolence of pivot_3 and pivot_5

+BSL by pivot point line color

+BSL by pivot point font size

//--

+SSL by pivot point

+SSL Equal level threshold

+SSL by pivot point line color

+SSL by pivot point font size


//--------Liquidity Void--------

Liquidity voids occur when price moves sharply in one direction. This is portrayed by large candles that have little trading activity as price moves in one direction. Eventually, the price will return to close the liquidity void later.

Liquidity voids will display as small filled rectangle

There are some config as:

+Display Liquidity Voids

+Alert when Liquidity Voids detection

+Liquidity Voids color

+Liquidity Void when filled

+Alert when Liquidity Void filled


//--------Long Wicks--------

Long wick candles are type of candlestick that have a long wick attached to the candle body. The candle body can be positive or negative, making the long wick appropriate for any type of candlestick.

Long wick will display as "V" symbol at candle

Config are:

+Display long wicks candle pattern

+Alert when long wicks found

+Wick/Body rate

+Long wick buy color

+Long wick sell color

+Long wick font size


//--------Premium and Discount--------

Premium and Discount is best used in trading ranges where price is consolidating because this helps us avoid taking low probability trades in the middle of the range where price is likely to take us out as liquidity

Indicator show Premium and Discount as Equilibrium at 50% level of swing or internal range. A small line will display at right border of chart with note.

Config:

+Show Premium and Discount as Equilibrium

+Equilibrium line color

+Equilibrium internal or swing


//--------Candle pattern--------

This indicator add Japanese candle pattern into chart as small line upper (or lower) three-candle create pattern.

Config are:

+Show candle pattern

+Bull pattern line color

+Bear pattern line color

+Candle line weight

+Show candle text

+Candle text size

+Distance from price to text (point)

+Alert when candle pattern found


//--------Pivot Point Settings--------

Internal length

Internal diviation

Internal backstep


Swing length

Swing diviation

Swing backstep


Object prefix

//--------Notifications--------

Notification type: Alert, MT mobile app, Telegram channel or group

file.txt write msg(diffirent with other symbol): Should valid when alert to telegram channel or group

Telegram channel id: Should valid when alert to telegram channel or group

Telegram bot token: Should valid when alert to telegram channel or group

This is not repaint indicator. At first load, it shoul run throug all bar to scan signal. The display change correctly when change timeframe.

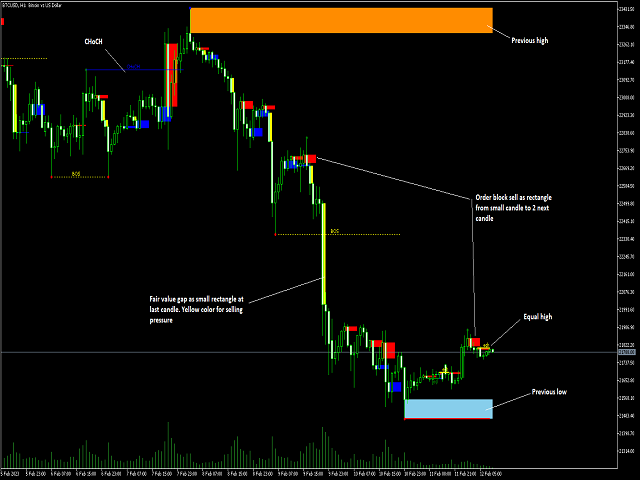
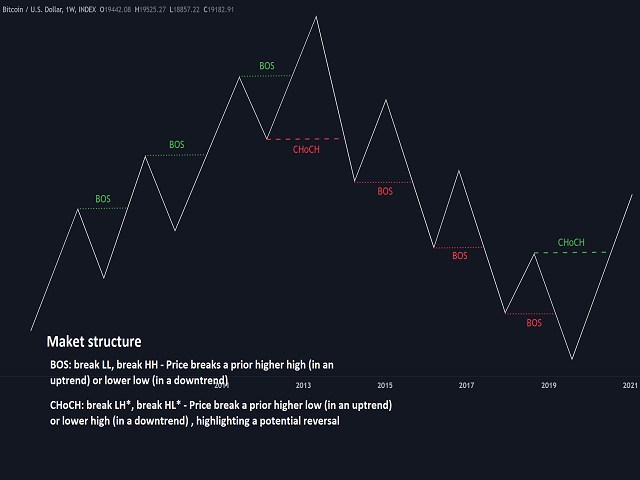
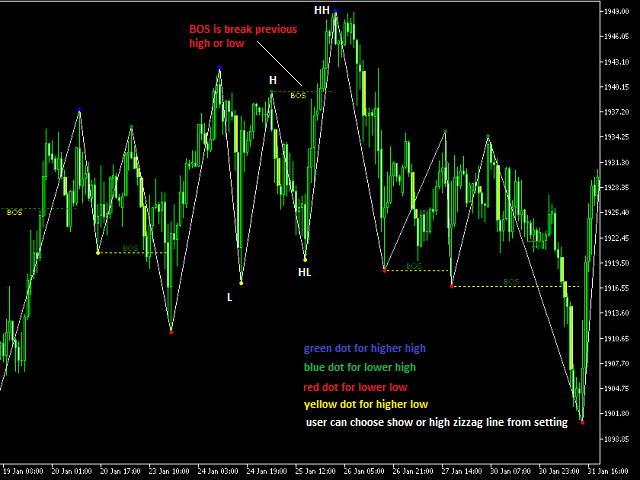
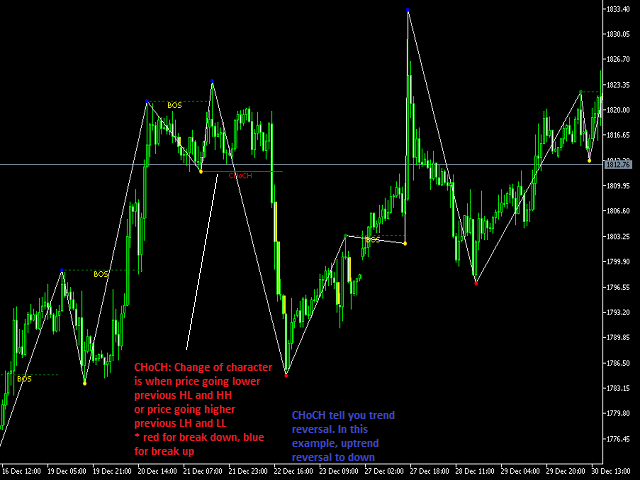
About image:

1: overview

2: Description of BOS

3: Example of BOS

4: Example of CHoCH

5: Example of CHoCH up

6: Example of Equal high (low is vice versal)

8: Example of Fail value gap

9: Example of Swing high, low

9: Example of Order block

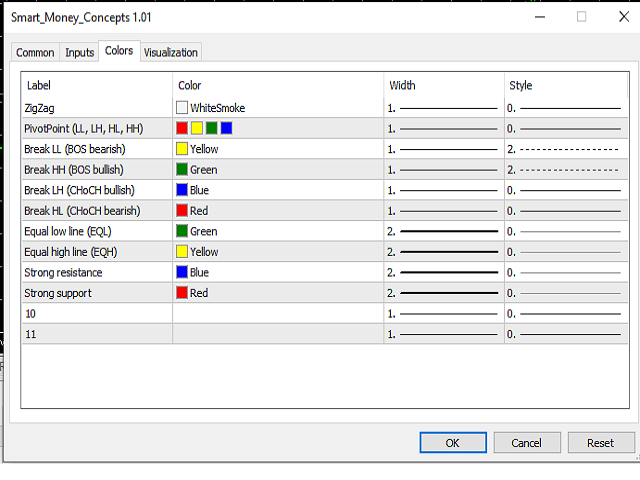
10: Setting


Comentarios 4
BeachScalper37
114
BeachScalper37 2022.12.24 15:15 
 

Indicator draws dynamic support/resistance levels and prints market structure markers. Pretty useful. The author was very responsive to fix a bug within hours

Marshallino Coetzee
40
Marshallino Coetzee 2023.03.04 07:46 
 

Can you refine the bearish OB to only be considered as a valid OB when there is a break of structure from that OB? likewise for bullish OB to only be considered as a valid ob when there is a bos from that OB? All in all very good application thank you

Productos recomendados
Note : i only sell this EA on MQL5, any other sellers is fake. Orbit Rage Final, a cutting-edge trading strategy meticulously designed around the bull/bear candle approach and divergence analysis. This powerful tool is engineered to empower you to shape the life you desire. To embark on this transformative journey, simply download and seamlessly integrate it into your MetaTrader 4 platform by placing it in the experts advisors folder. Orbit Rage Final revolutionizes trading by offering a risk-f
Owl Smart Levels MT5
Sergey Ermolov
4.07 (28)
Versión MT4  |  FAQ El Indicador Owl Smart Levels es un sistema comercial completo dentro de un indicador que incluye herramientas de análisis de mercado tan populares como los fractales avanzados de Bill Williams , Valable ZigZag que construye la estructura de onda correcta del mercado y los niveles de Fibonacci que marcan los niveles exactos de entrada. en el mercado y lugares para tomar ganancias. Descripción detallada de la estrategia Instrucciones para trabajar con el indicador Asesor de c
WanaScalper
Isaac Wanasolo
1 (1)
A scalping indicator based on mathematical patterns, which on average gives signals with relatively small SL, and also occasionally helps to catch big moves in the markets (more information in the video) This indicator has three main types of notifications: The first type warns of a possible/upcoming signal on the next bar The second type indicates the presence of a ready signal to enter the market/open a position The third type is for SL and TP levels - you will be notified every time price r
Renko System
Marco Montemari
This indicator can be considered as a trading system. It offers a different view to see the currency pair: full timeless indicator, can be used for manual trading or for automatized trading with some expert advisor. When the price reaches a threshold a new block is created according to the set mode. The indicator beside the Renko bars, shows also 3 moving averages. Features renko mode median renko custom median renko 3 moving averages wicks datetime indicator for each block custom notificatio
The Official Automated Version of the Reliable Indicator PipFinite Breakout EDGE EA Breakout EDGE takes the signal of PipFinite Breakout EDGE indicator and manages the trade for you. Because of numerous financial instruments to consider, many traders want the signals to be fully automated. The EA will make sure all your trades are executed from entry to exit. Saving you time and effort while maximizing your profits. The Edge of Automation Effortless price action trading is now possible
| Fully-automated Smart Money Concept (ICT) inspired trading solution with multi-strategy capabilities | Built by a grid trader >> for grid traders.  This is MT5 version, click  here  for  Blue CARA MT4  (settings and logics are same in both versions)     Real monitoring signal  -->  Cara Gold Intro Blue CARA EA   ('CARA') - short for  C omprehensive  A lgorithmic   R esponsive   A dvisor is a next-gen  multi-currency    multi-timeframe  EA base on the widely known (and perhaps the most popul
The new update makes this indicator a complete tool for studying, analyzing and operating probabilistic patterns. It includes: On-chart Multi-asset percentage monitor. Configurable martingales. Twenty-one pre-configured patterns, including Mhi patterns and C3. An advanced pattern editor to store up to 5 custom patterns. Backtest mode to test results with loss reports. Trend filter. Hit operational filter. Martingale Cycles option. Various types of strategies and alerts. Confluence between patter
KT Renko Patterns MT5
KEENBASE SOFTWARE SOLUTIONS
KT Renko Patterns scans the Renko chart brick by brick to find some famous chart patterns that are frequently used by traders across the various financial markets. Compared to the time-based charts, patterns based trading is easier and more evident on Renko charts due to their uncluttered appearance. KT Renko Patterns features multiple Renko patterns, and many of these patterns are extensively explained in the book titled Profitable Trading with Renko Charts by Prashant Shah. A 100% automate
Eternal Engine EA es un asesor experto avanzado que utiliza múltiples indicadores y estrategias, proporcionando a los operadores con una herramienta de comercio automatizado integral. Ofrece numerosas oportunidades de comercio, no es sensible a los diferenciales, y emplea puntos de entrada estrictos para iniciar con precisión cada comercio. La estrategia ha demostrado en el mercado real, con una señal en tiempo real de un año de duración de dd.si usted es un principiante o un comerciante experi
Double HMA MTF for MT5
Pavel Zamoshnikov
3.67 (3)
This is an advanced multi-timeframe version of the popular Hull Moving Average (HMA) Features Two lines of the Hull indicator of different timeframes on the same chart. The HMA line of the higher timeframe defines the trend, and the HMA line of the current timeframe defines the short-term price movements. A graphical panel with HMA indicator data from all timeframes at the same time . If the HMA switched its direction on any timeframe, the panel displays a question or exclamation mark with a tex
Highly configurable MFI indicator. Features: Highly customizable alert functions (at levels, crosses, direction changes via email, push, sound, popup) Multi timeframe ability Color customization (at levels, crosses, direction changes) Linear interpolation and histogram mode options Works on strategy tester in multi timeframe mode (at weekend without ticks also) Adjustable Levels Parameters: MFI Timeframe:  You can set the current or a higher timeframes for MFI. MFI Bar Shift:   you can set th
FREE
Cycles Forecast
Pooriya Alirezaee
This indicator is based on a mathematical formula and an ANN combined, designed to make a model(using previous prices) of the most recent market condition (any chart*) in order to use the model as a forecasting tool. *This indicator can operate on any chart/timeframe, but it's suggested you use multiple timeframes for each trade because this method relies solely on the time factor, you can not use this indicator to predict price volatility, but if it's fit correctly it will show you when the nex
Magic EA MT5
Kyra Nickaline Watson-gordon
Magic EA is an Expert Advisor based on Scalping, Elliot Waves and with filters such as RSI, Stochastic and 3 other strategies managed and decided with the robot smartly. Large number of inputs and settings are tested and optimized and embedded in the program thus inputs are limited and very simple. Using EA doesn't need any professional information or Forex Trading Knowledge. EA can trade on all symbols and all time frames, using special and unique strategies developed by the author. The EA
TrendDetect
Pavel Gotkevitch
The Trend Detect indicator combines the features of both trend indicators and oscillators. This indicator is a convenient tool for detecting short-term market cycles and identifying overbought and oversold levels. A long position can be opened when the indicator starts leaving the oversold area and breaks the zero level from below. A short position can be opened when the indicator starts leaving the overbought area and breaks the zero level from above. An opposite signal of the indicator can
The Penta-O is a 6-point retracement harmonacci pattern which usually precedes big market movements. Penta-O patterns can expand and repaint quite a bit. To make things easier this indicator implements a twist: it waits for a donchian breakout in the right direction before signaling the trade. The end result is an otherwise repainting indicator with a very reliable trading signal. The donchian breakout period is entered as an input. [ Installation Guide | Update Guide | Troubleshooting | FAQ | A
Automatic Expert Advisor. Night scalp system, with trend detection and pullback entry. Dynamic exit signal, for SL or TP. Every trade has fix SL. No usage of risky strategies like martingale, hedge, grid etc. About EA Scalper strategy Technical strategy Can use with small deposits Pairs with best rezults: AUDNZD, AUDCAD, AUDCHF, EURAUD, GBPAUD, USDCHF, CADCHF, EURNZD, EURGBP, GBPCAD, GBPCHF, EURCHF Time Frame: M15 Recommendations Broker account with ECN and low spread Test it first to find out
Point Black
Ignacio Agustin Mene Franco
Pack Black Card indicador 5/1  Point black  cuenta con la estrategia de bollingers profesionales donde cada flecha te da una señal distinta de entrada .  sirve asta para operar en m1 y en d1  sirve para hacer scalping y intraday ,  modificado para los mercados de forex !  apto para todo los pares  modificado para los mercados de indices sinteticos apto para todo los pares !  Ideal para los volatilitys y jumps ! 
Donchian Channel DC is the indicator of Donchian Channels, that plots maximum and minimum values of a specific period, besides mean value line. It´s possible to configure simple period for analysis and the indicator will plot all three values. You can trade with this indicator as trend or reversal, according to each strategy. Do not let to test others indicators as soon as others expert advisors.
SolarTrade Suite 金融机器人:LaunchPad 市场专家 - 专为开启交易而设计! 这是一个使用特殊创新和先进算法来计算其价值的交易机器人,是您在金融市场世界中的助手。 使用我们来自 SolarTrade Suite 系列的指标集来更好地选择启动此机器人的时机。 在描述底部查看我们来自 SolarTrade Suite 系列的其他产品。 您想自信地驾驭投资和金融市场的世界吗? SolarTrade Suite 金融机器人:LaunchPad 市场专家是一款创新软件,旨在帮助您做出明智的投资决策并增加您的利润。 SolarTrade Suite 金融机器人的优势:LaunchPad 市场专家: - 准确计算:我们的机器人使用先进的算法和分析方法来准确预测市场走势。 计算购买和出售资产的最佳时机。 - 用户友好界面:直观的界面将使您能够轻松掌握程序并在安装后立即开始享受其好处。 - 专家支持:我们的专业团队随时准备为您解答任何问题,并为您提供有关使用该程序的建议。 立即试用 SolarTrade Suite 金融机器人:LaunchP
Gyroscope        professional forex expert   (for EURUSD, GBPUSD, USDJPY, AUDUSD, USDCHF, EURGBP, EURJPY, NZDUSD, USDCAD, EURCHF, AUDJPY, CADJPY pairs)   alyzing the market using the Elliot Wave Index. Elliott wave theory is the interpretation of processes in financial markets through a system of visual models (waves) on price charts. The author of the theory, Ralph Elliott, identified eight variants of alternating waves (of which five are in the trend and three are against the trend). The mo
Hamster Scalping mt5
Ramil Minniakhmetov
4.7 (191)
Hamster Scalping es un asesor comercial totalmente automatizado que no utiliza martingala. Estrategia de scalping nocturno. El indicador RSI y el filtro ATR se utilizan como entradas. El asesor requiere un tipo de cuenta de cobertura. El seguimiento del trabajo real, así como mis otros desarrollos, se puede encontrar aquí: https://www.mql5.com/en/users/mechanic/seller Recomendaciones generales Depósito mínimo de $ 100, use cuentas ECN con margen mínimo, configuración predeterminada para e
Este indicador encuentra los patrones de retroceso AB = CD. El patrón de retroceso AB = CD es una estructura de precios de 4 puntos en la que el segmento de precios inicial está parcialmente retrocedido y seguido de un movimiento equidistante desde la finalización del retroceso, y es la base básica de todos los patrones armónicos. [ Guía de instalación | Guía de actualización | Solución de problemas | FAQ | Todos los productos ] Tamaños de patrones personalizables Relaciones de CA y BD pe
Технический индикатор Universal Oscillator является комбинацией торговых сигналов самых популярных и широко используемых осцилляторов. Индикатор представлен гистограммами, а также линиями fast и slow MA, что позволяет расширить список получаемых торговых рекомендаций и работать как по тренду, так и в боковом движении рынка. Таким образом, гистограммы позволяют определить момент пробоя ценовых значений и движение в новой фазе рынка, а линии указывают на зоны перекупленности и перепроданности.  Ос
***** IMPORTANT NOTE: DO NOT FORGET TO DETERMINE THE MAIN TREND DURING THE TEST. FOR AN UPWARD TREND MAKE "TRADE LONG: TRUE" AND "TRADE SHORT: FALSE" FOR A DOWNWARD TREND MAKE "TRADE LONG: FALSE" AND "TRADE SHORT: TRUE" AND FOR A HORIZONTAL BAND MAKE "TRADE LONG: TRUE" AND "TRADE SHORT: TRUE" IN THE SETTINGS. YOU CAN ALSO CHOOSE THE LONG TRADE, SHORT TRADE OR BOTH WAY IN REAL ACCOUNT BY THE HELP OF THE BUTTONS ON YOUR GRAPH IN ANY TIME. ***** "Statistics are like mini-skirts. They give yo
Atomic Analyst MT5
Issam Kassas
4.56 (18)
En primer lugar, vale la pena enfatizar que este Indicador de Trading no repinta, no redibuja y no se retrasa, lo que lo hace ideal tanto para el trading manual como para el automatizado. Manual del usuario: configuraciones, entradas y estrategia. El Analista Atómico es un Indicador de Acción del Precio PA que utiliza la fuerza y el impulso del precio para encontrar una mejor ventaja en el mercado. Equipado con filtros avanzados que ayudan a eliminar ruidos y señales falsas, y aumentan el poten
ThanosAlgotrade
Irina Manikeeva
1 (1)
ThanosAlgotrade is an automatic trading advisor for obtaining stable profits over a long period of time. Does not require manual intervention. Designed to work in the MT5 terminal on "hedge" type accounts , the Adviser needs to be installed on the EURUSD currency pair chart on the M1 time frame and enable auto trading. Monitoring of the adviser's work can be viewed here
Este indicador le mostrará los valores TP y SL (en esa moneda) que ya configuró para cada pedido en los gráficos (cerrados a la línea de transacción/pedido) que lo ayudarán mucho a estimar sus ganancias y pérdidas para cada pedido. Y también te muestra los valores de PIP. el formato que se muestra es "Valores de moneda de nuestros valores de ganancias o pérdidas / PIP". El valor TP se mostrará en color verde y el valor SL se mostrará en color rojo. Para cualquier pregunta o más información, n
Your Trend Friend
Luigi Nunes Labigalini
5 (1)
The trend is your friend! Look at the color of the indicator and trade on that direction. It does not  repaint. After each candle is closed, that's the color of the trend. You can focus on shorter faster trends or major trends, just test what's most suitable for the symbol and timeframe you trade. Simply change the "Length" parameter and the indicator will automatically adapt. You can also change the color, thickness and style of the lines. Download and give it a try! There are big movements
The MACD Expert Advisor  uses the Moving Average  Convergence/Divergence indicator to determine the market trend. It uses the MACD signal to place its entries automatically. The EA also uses the moving average indicator for additional confirmation. Various settings enable the EA to be optimized for different market conditions and trend following strategies. This program can also trade on specific trading sessions to capitalize on the increase of trading volume on certain times of the day. It ca
Fundamental Robot MT5
Kyra Nickaline Watson-gordon
Fundamental Robot is an Expert Advisor based on Fundamental Signals Indicator. The Fundamental Signals Indicator has a powerful calculation engine that can predict market movement over 30000 points. The indicator is named fundamental because it can predict trends with large movements, no complicated inputs and low risk.  The EA works with low margin levels and thus has low risk. Using EA : The EA is very simple and without complicated input parameters. These are main parameters must b
Los compradores de este producto también adquieren
TPSpro RFI Levels MT5
Roman Podpora
4.73 (11)
INSTRUCCIONES       RUSO   -   ING        Se   recomienda utilizar con un indicador.       -       TPSpro   TENDENCIA PRO -   Versión MT5 Un elemento clave en el trading son las zonas o niveles desde los que se toman las decisiones de compra o venta de un instrumento de trading. A pesar de los intentos de los principales actores de ocultar su presencia en el mercado, inevitablemente dejan rastros. Nuestra tarea era aprender a identificar estos rastros e interpretarlos correctamente. Funciones p
TPSproTREND PrO MT5
Roman Podpora
4.89 (9)
TPSpro TREND PRO  - is a trend indicator that automatically analyzes the market and provides information about the trend and each of its changes, as well as giving signals for entering trades without redrawing! The indicator uses each candle, analyzing them separately. referring to different impulses - up or down impulse. Exact entry points into transactions for currencies, crypto, metals, stocks, indices!  Version MT4               DETAILED DESCRIPTION               R ecommended to use with an
Primero que todo, vale la pena enfatizar que este Sistema de Trading es un Indicador No Repintado, No Redibujado y No Retrasado, lo que lo hace ideal tanto para el trading manual como para el automatizado. Curso en línea, manual y descarga de ajustes preestablecidos. El "Sistema de Trading Inteligente MT5" es una solución completa de trading diseñada para traders nuevos y experimentados. Combina más de 10 indicadores premium y presenta más de 7 estrategias de trading robustas, lo que lo convie
Quantum Trend Sniper
Bogdan Ion Puscasu
4.8 (49)
Introduciendo       Indicador Quantum Trend Sniper   , el innovador indicador MQL5 que está transformando la forma en que identificas y negocias los cambios de tendencia. Desarrollado por un equipo de comerciantes experimentados con experiencia comercial de más de 13 años,       Indicador de francotirador de tendencia cuántica       está diseñado para impulsar su viaje comercial a nuevas alturas con su forma innovadora de identificar cambios de tendencia con una precisión extremadamente alta.
FX Power MT5 NG
Daniel Stein
5 (5)
Obtenga su actualización diaria del mercado con detalles y capturas de pantalla a través de nuestro Morning Briefing aquí en mql5 y en Telegram ! FX Power MT5 NG es la nueva generación de nuestro popular medidor de fuerza de divisas, FX Power. ¿Y qué ofrece este medidor de fuerza de nueva generación? Todo lo que le encantaba del FX Power original PLUS Análisis de fuerza de ORO/XAU Resultados de cálculo aún más precisos Períodos de análisis configurables individualmente Límite de cálculo persona
Este es un genial indicador para MT5 que ofrece señales precisas para entrar en una transacción sin redibujar. Se puede aplicar a cualquier activo financiero: fórex, criptomonedas, metales, acciones, índices. Nos dará valoraciones bastante precisas y nos dirá cuándo es mejor abrir y cerra una transacción. Eche un vistazo  al vídeo  (6:22), ¡contiene un ejemplo de procesamiento de una sola señal que ha amortizado el indicador! La mayoría de los tráders mejoran sus resultados comerciales durante l
Ante todo, vale la pena enfatizar que esta Herramienta de Trading es un Indicador No Repintado, No Redibujado y No Retrasado, lo que la hace ideal para el trading profesional. Curso en línea, manual del usuario y demostración. El Indicador de Conceptos de Acción del Precio Inteligente es una herramienta muy potente tanto para traders nuevos como experimentados. Combina más de 20 indicadores útiles en uno solo, combinando ideas avanzadas de trading como el Análisis del Trader del Círculo Inte
FX Volume MT5
Daniel Stein
4.93 (14)
Obtenga su actualización diaria del mercado con detalles y capturas de pantalla a través de nuestro Morning Briefing aquí en mql5 y en Telegram ! FX Volume es el PRIMER y ÚNICO indicador de volumen que proporciona una visión REAL del sentimiento del mercado desde el punto de vista de un bróker. Proporciona una visión impresionante de cómo los participantes institucionales del mercado, como los brokers, están posicionados en el mercado Forex, mucho más rápido que los informes COT. Ver esta info
FxaccurateLS
Shiv Raj Kumawat
WHY IS OUR FXACCCURATE LS MT5 THE PROFITABLE ? PROTECT YOUR CAPITAL WITH RISK MANAGEMENT Gives entry, stop and target levels from time to time. It finds Trading opportunities by analyzing what the price is doing during established trends. POWERFUL INDICATOR FOR A RELIABLE STRATEGIES We have made these indicators with a lot of years of hard work. It is made at a very advanced level. Established trends provide dozens of trading opportunities, but most trend indicators completely ignore them!
Auto Order Block with break of structure based on ICT and Smart Money Concepts (SMC) Futures Break of Structure ( BoS )             Order block ( OB )            Higher time frame Order block / Point of Interest ( POI )    shown on current chart           Fair value Gap ( FVG ) / Imbalance   -  MTF      ( Multi Time Frame )    HH/LL/HL/LH  -  MTF      ( Multi Time Frame )  Choch  MTF      ( Multi Time Frame )  Volume Imbalance     ,  MTF          vIMB Gap’s Power of 3 Equal High
Matrix Arrow Indicator MT5
Juvenille Emperor Limited
5 (12)
Matrix Arrow Indicator MT5   es una tendencia única 10 en 1 que sigue un indicador   100% sin repintado   de marcos temporales múltiples que se puede usar en todos los símbolos/instrumentos:   divisas ,   materias primas ,   criptomonedas ,   índices ,   acciones .  Matrix Arrow Indicator MT5  determinará la tendencia actual en sus primeras etapas, recopilando información y datos de hasta 10 indicadores estándar, que son: Índice de movimiento direccional promedio (ADX) Índice de canales de prod
Blahtech Supply Demand MT5
Blahtech Limited
4.54 (13)
Was: $299  Now: $99   Supply Demand uses previous price action to identify potential imbalances between buyers and sellers. The key is to identify the better odds zones, not just the untouched ones. Blahtech Supply Demand indicator delivers functionality previously unavailable on any trading platform. This 4-in-1 indicator not only highlights the higher probability zones using a multi-criteria strength engine, but also combines it with multi-timeframe trend analysis, previously confirmed swings
Advanced Supply Demand MT5
Bernhard Schweigert
4.5 (14)
¡Actualmente con 33% de descuento! ¡La mejor solución para cualquier tráder principiante o experto! Este indicador es una herramienta comercial única, de alta calidad y asequible, porque incorpora una serie de características patentadas y una nueva fórmula. Con esta actualización, podrá mostrar zonas de doble marco temporal. No solo podrá mostrar un marco temporal más alto, sino también mostrar ambos, el marco temporal del gráfico MÁS el marco temporal más alto: MOSTRANDO ZONAS ANIDADAS. A todos
¿Cansado de trazar líneas de soporte y resistencia? La resistencia de soporte es un indicador de marco de tiempo múltiple que detecta y traza automáticamente los soportes y las líneas de resistencia en el gráfico con un giro muy interesante: a medida que los niveles de precios se prueban con el tiempo y aumenta su importancia, las líneas se vuelven más gruesas y oscuras. [ Guía de instalación | Guía de actualización | Solución de problemas | FAQ | Todos los productos ] Mejora tu análisis técnic
TrendMaestro5
Stefano Frisetti
note: this indicator is for METATRADER4, if you want the version for METATRADER5 this is the link:  https://www.mql5.com/it/market/product/108106 TRENDMAESTRO ver 2.4 TRENDMAESTRO recognizes a new TREND in the bud, he never makes mistakes. The certainty of identifying a new TREND is priceless. DESCRIPTION TRENDMAESTRO identifies a new TREND in the bud, this indicator examines the volatility, volumes and momentum to identify the moment in which there is an explosion of one or more of these data a
Difícil de encontrar y escasa en frecuencia, las divergencias son uno de los escenarios comerciales más confiables. Este indicador busca y escanea las divergencias regulares y ocultas automáticamente usando su oscilador favorito. [ Guía de instalación | Guía de actualización | Solución de problemas | FAQ | Todos los productos ] Fácil de comerciar Encuentra divergencias regulares y ocultas Admite muchos osciladores bien conocidos Implementa señales comerciales basadas en rupturas Muestra n
Golden Spikes Premium
Kwaku Bondzie Ghartey
Golden Spikes Detector Acknowledgement and Dedications:  The name of this indicator was Inspired by an Original; Mr Grant Koopman; a Knowledgeable and experienced Synthetics trader. I dedicate this indicator to Mr Grant.  Overview: The Golden Spikes Premium is a groundbreaking trading indicator meticulously crafted for the Boom and Crash indices on the Deriv market. Tailored to meet the needs of discerning traders, this powerful tool operates exclusively on the one-minute timeframe, providin
MetaForecast M5
Vahidreza Heidar Gholami
5 (2)
MetaForecast predice y visualiza el futuro de cualquier mercado basándose en las armonías de los datos de precios. Aunque el mercado no siempre es predecible, si existe un patrón en el precio, MetaForecast puede predecir el futuro con la mayor precisión posible. En comparación con otros productos similares, MetaForecast puede generar resultados más precisos al analizar las tendencias del mercado. Parámetros de entrada Past size (Tamaño del pasado) Especifica el número de barras que MetaForecas
Black Dragon indicator mt5
Ramil Minniakhmetov
4.81 (53)
El indicador de detección de tendencias complementará cualquier estrategia y también se puede utilizar como una herramienta independiente. Ventajas Fácil de usar, no sobrecarga el gráfico con información innecesaria; Puede usarse como filtro para cualquier estrategia; Tiene niveles integrados de soporte y resistencia dinámicos, que se pueden usar tanto para obtener ganancias como para establecer límites de pérdidas; El indicador no cambia de color después de que se cierra la vela;  Funciona
PZ Swing Trading MT5
PZ TRADING SLU
5 (4)
Swing Trading es el primer indicador diseñado para detectar oscilaciones en la dirección de la tendencia y posibles oscilaciones de reversión. Utiliza el enfoque de intercambio de línea de base, ampliamente descrito en la literatura comercial. El indicador estudia varios vectores de precios y tiempos para rastrear la dirección de la tendencia agregada y detecta situaciones en las que el mercado está sobrevendido o sobrecomprado y listo para corregir. [ Guía de instalación | Guía de actualización
Gold ATR MTF: este es un excelente indicador técnico de acciones. El algoritmo del indicador ATR (Average True Range) analiza el movimiento del precio del activo y refleja la volatilidad dibujando los niveles correspondientes en porcentajes específicos (%) del precio de apertura del período de tiempo especificado (D1). Los indicadores (rojo y/o azul D1 H4) de la dirección del movimiento del precio del símbolo y las señales de flecha son ayudas adicionales y esenciales para una negociación y/o e
Was: $249  Now: $99   Market Profile defines a number of day types that can help the trader to determine market behaviour. A key feature is the Value Area, representing the range of price action where 70% of trading took place. Understanding the Value Area can give traders valuable insight into market direction and establish the higher odds trade. It is an excellent addition to any system you may be using. Inspired by Jim Dalton’s book “Mind Over Markets”, this indicator is designed to suit the
IVISTscalp5
Vadym Zhukovskyi
5 (5)
Te presentamos el indicador iVISTscalp5, que no solo es único sino también efectivo en operaciones de trading. Este indicador se basa en datos temporales y es el resultado de muchos años de experiencia y análisis profundo de los mercados financieros. El indicador iVISTscalp5 es una excelente herramienta para el trading manual. La conveniencia, simplicidad y visualización, toda la complejidad está oculta en su interior. Hemos simplificado al máximo la configuración y uso del indicador iVISTscalp5
Royal Scalping Indicator M5
Vahidreza Heidar Gholami
5 (6)
Royal Scalping Indicator is an advanced price adaptive indicator designed to generate high-quality trading signals. Built-in multi-timeframe and multi-currency capabilities make it even more powerful to have configurations based on different symbols and timeframes. This indicator is perfect for scalp trades as well as swing trades. Royal Scalping is not just an indicator, but a trading strategy itself. Features Price Adaptive Trend Detector Algorithm Multi-Timeframe and Multi-Currency Trend Low
Trend Hunter MT5
Andrey Tatarinov
5 (2)
Trend Hunter es un indicador de tendencias para trabajar en los mercados Forex, criptomonedas y CFD. Una característica especial del indicador es que sigue con confianza la tendencia, sin cambiar la señal cuando el precio perfora ligeramente la línea de tendencia. El indicador no se vuelve a dibujar; aparece una señal para ingresar al mercado después del cierre de la barra. Al avanzar a lo largo de una tendencia, el indicador muestra puntos de entrada adicionales en la dirección de la tendenc
Ahora $ 147 (aumentando a $ 499 después de algunas actualizaciones) - Cuentas ilimitadas (PC o Mac) Manual de usuario de RelicusRoad + Videos de capacitación + Acceso al grupo privado de Discord + Estado VIP UNA NUEVA MANERA DE VER EL MERCADO RelicusRoad es el indicador comercial más poderoso del mundo para divisas, futuros, criptomonedas, acciones e índices, y brinda a los comerciantes toda la información y las herramientas que necesitan para mantenerse rentables. Brindamos análisis téc
Divergence Sync MT5
Pavel Verveyko
5 (1)
Divergence and Convergence are important harbingers of reversals in stock markets. The Divergence Sync indicator is designed to automatically search for divergences on a large number of indicators with different parameters. The search for divergences is carried out on these indicators: (CCI, CHO, DeMarker, MACD, MFI, Momentum, OBV, OsMA, RSI, Stochastic, WPR,   Awesome Oscillator ). To search for divergences, you can use one technical indicator or search simultaneously on any number of ind
Este indicador reconoce más de 30 patrones de velas japonesas y los resalta maravillosamente en el gráfico. Es simplemente uno de esos indicadores sin los que los operadores de acciones de precios no pueden vivir. Mejora tu análisis técnico de la noche a la mañana Detecta patrones de velas japonesas fácilmente Comercio de patrones de inversión confiables y universales Salte a las tendencias establecidas de forma segura utilizando patrones de continuación El indicador no se repinta e implementa
Este tablero muestra los últimos   patrones armónicos   disponibles para los símbolos seleccionados, por lo que ahorrará tiempo y será más eficiente /   versión MT4 . Indicador gratuito:   Basic Harmonic Pattern Columnas del indicador Symbol:   aparecerán los símbolos seleccionados Trend :   alcista o bajista Pattern :   tipo de patrón (gartley, mariposa, murciélago, cangrejo, tiburón, cifrado o ABCD) Entry :   precio de entrada SL:   precio de stop loss TP1:   1er precio de toma de benefici
Legacy of Gann for MT5
Pavel Zamoshnikov
5 (5)
The indicator very accurately determines the levels of the possible end of the trend and profit fixing. The method of determining levels is based on the ideas of W.D.Gann, using an algorithm developed by his follower Kirill Borovsky. Extremely high reliability of reaching levels (according to K. Borovsky  - 80-90%) Indispensable for any trading strategy – every trader needs to determine the exit point from the market! Precisely determines targets on any timeframes and any instruments (forex, met
Otros productos de este autor
OVERVIEW A Lorentzian Distance Classifier (LDC) is a Machine Learning classification algorithm capable of categorizing historical data from a multi-dimensional feature space. This indicator demonstrates how Lorentzian Classification can also be used to predict the direction of future price movements when used as the distance metric for a novel implementation of an Approximate Nearest Neighbors (ANN) algorithm. This indicator provide signal as buffer, so very easy for create EA from this in
This indicator presents an alternative approach to identify Market Structure. The logic used is derived from learning material created by   DaveTeaches (on X) When quantifying Market Structure, it is common to use fractal highs and lows to identify "significant" swing pivots. When price closes through these pivots, we may identify a Market Structure Shift (MSS) for reversals or a Break of Structure (BOS) for continuations. The main difference with this "protected" logic is in how we determine
The Bheurekso Pattern Indicator for MT5 helps traders automatically identify candlestick pattern that formed on the chart base on some japanese candle pattern and other indicator to improve accurate. This indicator scans all candles, recognizes and then displays any candle patterns formed on the chart. The candle displayed can be Bullish or Bearish Engulfing, Bullish or Bearish Harami, and so on. There are some free version now but almost that is repaint and lack off alert function. With this ve
This indicator provides the ability to recognize the SMC pattern, essentially a condensed version of the Wyckoff model. Once the pattern is confirmed by RTO, it represents a significant investment opportunity.    There are numerous indicators related to SMC beyond the market, but this is the first indicator to leverage patterns to identify specific actions of BigBoy to  navigate the market. Upgrade 2024-03-08: Add TP by RR feature. The SMC (Smart Money Concept)   pattern   is a market analysis m
Sessions by LUX in MT5
Minh Truong Pham
5 (1)
This indicator shows when user set sessions are active and returns various tools + metrics using the closing price within active sessions as an input. Users have the option to change up to 4 session times. The indicator will increasingly lack accuracy when the chart timeframe is higher than 1 hour. Settings Sessions Enable Session: Allows to enable or disable all associated elements with a specific user set session. Session Time: Opening and closing times of the user set session
The liquidity swings indicator highlights swing areas with existent trading activity. The number of times price revisited a swing area is highlighted by a zone delimiting the swing areas. Additionally, the accumulated volume within swing areas is highlighted by labels on the chart. An option to filter out swing areas with volume/counts not reaching a user-set threshold is also included. This indicator by its very nature is not real-time and is meant for descriptive analysis alongside other c
This is a Forex Scalping Trading Sytem based on the Bollinger Bands.  Pairs:Major Time frame: 1M or higher. Spread max:0,0001.  Indicators (just suggestion) Bollinger bands (20, 2); ADX (14 period); RSI   (7 period ). Y ou should only trade this system between 2am to 5am EST, 8am to 12am EST and 7.30pm to 10pm EST. Do not scalp 30 minutes before a orange or red news  report and not for a hour afterwards.   Setup: is for price to move above the lower or lower Bollinger Bands, RSI raise above the
FREE
This all-in-one indicator displays real-time market structure (internal & swing BOS / CHoCH), order blocks, premium & discount zones, equal highs & lows, and much more...allowing traders to automatically mark up their charts with widely used price action methodologies. Following the release of our Fair Value Gap script, we received numerous requests from our community to release more features in the same category. //------------------------------------// Version 1.x has missing functions + PDAr
This all-in-one indicator displays real-time market structure (internal & swing BOS / CHoCH), order blocks, premium & discount zones, equal highs & lows, and much more...allowing traders to automatically mark up their charts with widely used price action methodologies. Following the release of our Fair Value Gap script, we received numerous requests from our community to release more features in the same category. "Smart Money Concepts" (SMC) is a fairly new yet widely used term amongst price a
This is addition of  Effective SV squeeze momentum  that add bolliger band and Keltner channel to chart window.  Squeeze momentum introduced by “John Carter”, the squeeze indicator for MT5 represents a volatility-based tool. Regardless, we can also consider the squeeze indicator as a momentum indicator, as many traders use it to identify the direction and strength of price moves. In fact, the Tradingview  squeeze indicator shows when a financial instrument is willing to change from a trending ma
FREE
The ICT Silver Bullet indicator is inspired from the lectures of "The Inner Circle Trader" (ICT) and highlights the Silver Bullet (SB) window which is a specific 1-hour interval where a Fair Value Gap (FVG) pattern can be formed. A detail document about ICT Silver Bullet   here . There are 3 different Silver Bullet windows (New York local time): The London Open Silver Bullet (3 AM — 4 AM ~ 03:00 — 04:00) The AM Session Silver Bullet (10 AM — 11 AM ~ 10:00 — 11:00) The PM Session Silver Bulle
The indicator   returning pivot point based trendlines with highlighted breakouts . Trendline caculated by pivot point and other clue are ATR, Stdev.   The indicator also includes integrated alerts for  trendlines  breakouts   and foward message to Telegram channel or group if you want. Settings ·            Lookback bar: Default 200 is number of bar caculate when init indicator. ·            Length:  Pivot points  period ·            Slope Calculation Method: Determines how this lope is calcula
This indicator builds upon the previously posted Nadaraya-Watson Estimator. Here we have created an envelope indicator based on kernel smoothing with integrated alerts from crosses between the price and envelope extremities. Unlike the Nadaraya-Watson Estimator, this indicator follows a contrarian methodology. Please note that the indicator is subject to repainting. The triangle labels are designed so that the indicator remains useful in real-time applications. Settings Window Size: Dete
Detect divergence (classic, hidden) price and all oscillator indicator include: RSI, CCI, MACD, OSMA, Stochastic, Momentum, Awesome Oscillator (AO), Accelerator Oscillator (AC), Williams Percent Range (WPR), Relative Vigor Index (RVI), Rate of Change (ROC). Confirm reversal with dochian channel for to improve signal quality. Divergence is when the price of an asset is moving in the opposite direction of a technical   indicator , such as an oscillator, or is moving contrary to other data. Diverge
The   ICT Unicorn Model   indicator highlights the presence of "unicorn" patterns on the user's chart which is derived from the lectures of   "The Inner Circle Trader" (ICT) . Detected patterns are followed by targets with a distance controlled by the user.   USAGE (image 2) At its core, the ICT Unicorn Model relies on two popular concepts, Fair Value Gaps and Breaker Blocks. This combination highlights a future area of support/resistance. A   Bullish Unicorn Pattern   consists ou
The Buyside & Sellside Liquidity indicator aims to detect & highlight the first and arguably most important concept within the ICT trading methodology,   Liquidity   levels. SETTINGS Liquidity Levels Detection Length: Lookback period Margin: Sets margin/sensitivity for a liquidity level detection Liquidity Zones Buyside Liquidity Zones: Enables display of the buyside liquidity zones. Margin: Sets margin/sensitivity for the liquidity zone boundaries. Color: Color option
ICT Concepts
Minh Truong Pham
5 (2)
The ICT Concepts indicator regroups core concepts highlighted by trader and educator "The Inner Circle Trader" (ICT) into an all-in-one toolkit. Features include Market Structure (MSS & BOS), Order Blocks, Imbalances, Buyside/Sellside Liquidity, Displacements, ICT Killzones, and New Week/Day Opening Gaps. It’s one kind of Smart money concepts. USAGE: Please read this document  !    DETAILS Market Structure Market structure labels are constructed from price breaking a prior extreme point. T
All about Smart Money Concepts Strategy: Market struture: internal or swing BOS, CHoCH; Orderblock; Liquity equal; Fair Value Gap with Consequent encroachment, Balanced price range; Level with Previous month, week, day level or in day level (PMH, PWH, PDH, HOD); BuySell Stops Liquidity (BSL, SSL); Liquidity Void Long Wicks; Premium and Discount; Candle pattern ... "Smart Money Concepts" ( SMC ) is a fairly new yet widely used term amongst price action traders looking to more accurately navigate
Here’s the problem: the default zigzag indicator given in MT5 trading platform does not really capture the most of the highs and lows on chart do draw zigzags. On chart below, notice that some of ther high, low of price have been missed to draw zigzags by this default zigzag indicator (picture 1). It is not so apparent until you compare default zigzag indicator to this SwingZZ indicator. Have a look on picture 2 and 3. The swing zigzag indicator is best because it captures most of the swing high
This script automatically calculates and updates ICT's daily IPDA look back time intervals and their respective discount / equilibrium / premium, so you don't have to :) IPDA stands for Interbank Price Delivery Algorithm. Said algorithm appears to be referencing the past 20, 40, and 60 days intervals as points of reference to define ranges and related PD arrays. Intraday traders can find most value in the 20 Day Look Back box, by observing imbalances and points of interest. Longer term traders c
The ICT Concepts indicator regroups core concepts highlighted by trader and educator "The Inner Circle Trader" (ICT) into an all-in-one toolkit. Features include Market Structure (MSS & BOS), Order Blocks, Imbalances, Buyside/Sellside Liquidity, Displacements, ICT Killzones, and New Week/Day Opening Gaps. It’s one kind of Smart money concepts.   USAGE:   Please read this   document  !      DETAILS Market Structure Market structure labels are constructed from price breaking a prior extreme
The ICT Silver Bullet indicator is inspired from the lectures of "The Inner Circle Trader" (ICT) and highlights the Silver Bullet (SB) window which is a specific 1-hour interval where a Fair Value Gap (FVG) pattern can be formed. A detail document about ICT Silver Bullet here . There are 3 different Silver Bullet windows (New York local time): The London Open Silver Bullet (3 AM — 4 AM ~ 03:00 — 04:00) The AM Session Silver Bullet (10 AM — 11 AM ~ 10:00 — 11:00) The PM Session Silver Bullet
The Inversion Fair Value Gaps (IFVG) indicator is based on the inversion FVG concept by ICT and provides support and resistance zones based on mitigated Fair Value Gaps (FVGs). Image 1   USAGE Once mitigation of an FVG occurs, we detect the zone as an "Inverted FVG". This would now be looked upon for potential support or resistance. Mitigation occurs when the price closes above or below the FVG area in the opposite direction of its bias. (Image 2) Inverted Bullish FVGs Turn into P
A problem when indicator call webrequest is "The WebRequest() function is synchronous, which means its breaks the program execution and waits for the response from the requested server. Since the delays in receiving a response can be large, the function is not available for calls from indicators, because indicators run in a common thread shared by all indicators and charts on one symbol. Indicator performance delay on one of the charts of a symbol may stop updating of all charts of the same symb
FREE
The Breaker Blocks with Signals indicator aims to highlight a complete methodology based on breaker blocks. Breakout signals between the price and breaker blocks are highlighted and premium/discount swing levels are included to provide potential take profit/stop loss levels. This script also includes alerts for each signal highlighted.   SETTINGS   Breaker Blocks Length: Sensitivity of the detected swings used to construct breaker blocks. Higher values will return longer te
The FollowLine indicator is a trend following indicator. The blue/red lines are activated when the price closes above the upper Bollinger band or below the lower one. Once the trigger of the trend direction is made, the FollowLine will be placed at High or Low (depending of the trend). An ATR filter can be selected to place the line at a more distance level than the normal mode settled at candles Highs/Lows. Some features: + Trend detech + Reversal signal + Alert teminar / mobile app
This indicator shows when user set sessions are active and returns various tools + metrics using the closing price within active sessions as an input. Users have the option to change up to 4 session times. The indicator will increasingly lack accuracy when the chart timeframe is higher than 1 hour. Settings Sessions Enable Session: Allows to enable or disable all associated elements with a specific user set session. Session Time: Opening and closing times of the user set session
The SuperTrend AI indicator is a novel take on bridging the gap between the K-means clustering machine learning method & technical indicators. In this case, we apply K-Means clustering to the famous SuperTrend indicator.   USAGE Users can interpret the SuperTrend AI trailing stop similarly to the regular SuperTrend indicator. Using higher minimum/maximum factors will return longer-term signals. (image 1) The displayed performance metrics displayed on each signal allow for a deeper interpretat
An Implied Fair Value Gap (IFVG) is a three candles imbalance formation conceptualized by ICT that is based on detecting a larger candle body & then measuring the average between the two adjacent candle shadows. This indicator automatically detects this imbalance formation on your charts and can be extended by a user set number of bars. The IFVG average can also be extended until a new respective IFVG is detected, serving as a support/resistance line. Alerts for the detection of bull
Consolidation is when price is moving inside a clear trading range. When prices are consolidated it shows the market maker placing orders on both sides of the market. This is mainly due to manipulate the un informed money. This indicator automatically identifies consolidation zones and plots them on the chart. The method of determining consolidation zones is based on pivot points and ATR, ensuring precise identification. The indicator also sends alert notifications to users when a new consolida
Filtro:
Marshallino Coetzee
40
Marshallino Coetzee 2023.03.04 07:46 
 

Can you refine the bearish OB to only be considered as a valid OB when there is a break of structure from that OB? likewise for bullish OB to only be considered as a valid ob when there is a bos from that OB? All in all very good application thank you

Minh Truong Pham
12283
Respuesta del desarrollador Minh Truong Pham 2023.03.04 14:15
Thank for you advice. Will update as soon as possible!
Jaykris
119
Jaykris 2023.01.08 08:24 
 

CAN THE YELLOW COLOUR CHANGE ON THE WRITING OF EQL PLEASE COZ OUR TEMPLATES ARE WHIT

Minh Truong Pham
12283
Respuesta del desarrollador Minh Truong Pham 2023.01.08 10:04
Thank Jaykris! I upgraded new verion with text color setting (at bottom setting panel - tab input). Noti that point and line color is belong to indicator buffer, so you can style it in tab color of setting panel. In review, cannot add image so i will send you image as example in private message

Yocrz
305
Yocrz 2023.01.06 10:27 
 

El usuario no ha dejado ningún comentario para su valoración

Minh Truong Pham
12283
Respuesta del desarrollador Minh Truong Pham 2023.01.06 14:53
Thank Yocrz for review. I just upgraded new version with font size input setting.
BeachScalper37
114
BeachScalper37 2022.12.24 15:15 
 

Indicator draws dynamic support/resistance levels and prints market structure markers. Pretty useful. The author was very responsive to fix a bug within hours

Minh Truong Pham
12283
Respuesta del desarrollador Minh Truong Pham 2022.12.25 09:02
Thanks BeachScalper37
Respuesta al comentario
Versión 4.11 2023.09.25
Add email alert function
Versión 4.10 2023.09.21
Add timeframe to alert message.
Versión 4.9 2023.09.18
Add symbol, timeframe to alert mesage on telegram
Versión 4.8 2023.05.30
add option:
+ Disable all alert
+ Run time setting

Versión 4.7 2023.04.03
add equal high and low tolerance
Versión 4.4 2023.04.03
fix alert many time on BOS, CHoCH
Versión 4.3 2023.03.31
add option for ob
Versión 4.2 2023.03.30
add ce at fair value gap
Versión 4.1 2023.03.30
fixbug on swing BOS , CHoCH
Versión 4.0 2023.03.29
recode
add more function
Versión 3.1 2023.03.09
New version SMC_3 is released with enhanced performance; smart OB scan, add volume of 1st, 2nd candle in OB; Alert when price inside previous OB, swing S/R level or internal S/R level
Versión 2.6 2023.02.22
update OB with more option
Versión 2.4 2023.02.20
add order block options
Versión 2.1 2023.02.14
Change alert for smarter
Versión 2.0 2023.02.12
add OB
add FVG
Versión 1.10 2023.01.08
add font color setting
Versión 1.9 2023.01.06
Add font size to setup
Versión 1.7 2022.12.23
Fix bug on object delete when working with other indicator or expert
Versión 1.6 2022.12.15
Fix bug!
Versión 1.5 2022.12.15
Add Text label for easy recognize pattern
Versión 1.4 2022.12.12
fix a bug on alert
Versión 1.2 2022.12.12
Fix some bug on findding strong level
Fix order block not display in some case
Versión 1.1 2022.12.07
add description to color indicator setting tab