Indicador Vwap Bands
- Indicadores
- Versión: 1.0
- Activaciones: 5
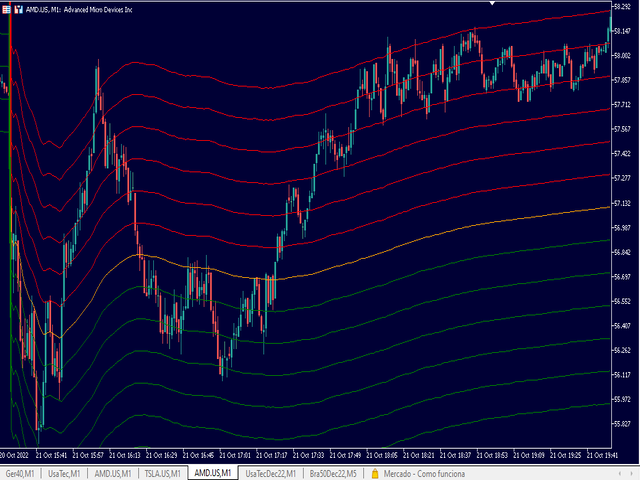
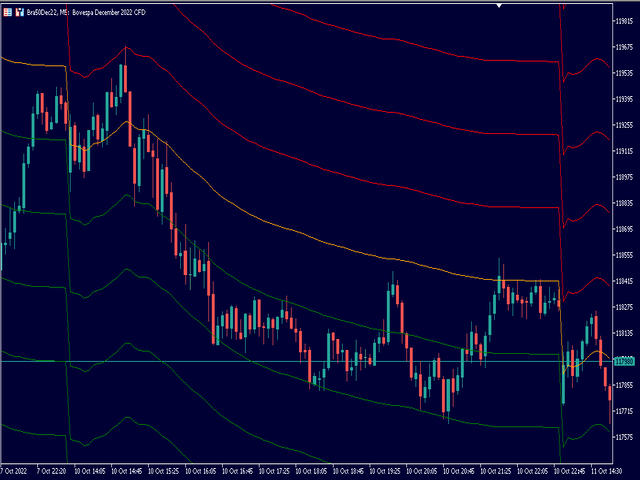
Este indicador contiene 6 desviaciones, ideal para activos de alta volatilidad, y puede cambiar los colores de las desviaciones, así como la anchura de la línea.
VWAP (Volume Weighted Average Price) no es más que una media móvil ponderada por el volumen de negociación de un activo.
Este indicador es uno de los más utilizados por los grandes inversores -en su mayoría institucionales-, ya que proporciona una visión amplia de la liquidez y los puntos de interés del activo analizado.
El volumen es uno de los elementos más importantes para analizar cualquier activo. De hecho, es uno de los postulados de la Teoría de Dow, una de las tesis sobre el mercado financiero más importantes jamás creadas.
Charles Dow, su creador, dice
"El volumen sigue la tendencia".
En otras palabras, sea cual sea el movimiento que se produzca , será mucho más fuerte si va acompañado de un volumen elevado.
Y puesto que este indicador, a diferencia de otras medias móviles, mide el precio medio de un determinado activo financiero durante un periodo de tiempo ponderado por el volumen negociado , adquiere una gran importancia para comprender los movimientos y las tendencias del mercado.
El indicador también es utilizado a menudo por los operadores diarios, normalmente en contratos de futuros mini y acciones.