Advanced MACD MT4
- Indicadores
- Mihail Matkovskij
- Versión: 1.0
- Activaciones: 5
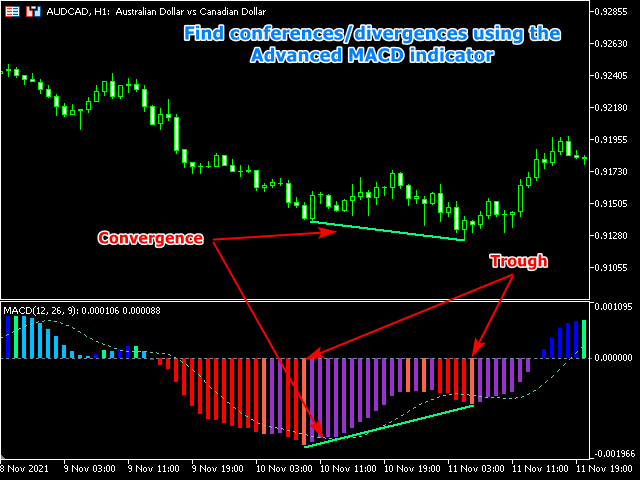
Modified MACD, for technical analysis of charts, with color backlight of histogram signals. The indicator highlights, the direction of the histogram movement, the change in the direction of the histogram movement, the histogram peaks, the interaction of the histogram and the signal curve. Also, the indicator makes it easier to find convergences / divergences between bars and the histogram (which serve as a powerful signal in some trading systems using the MACD indicator).
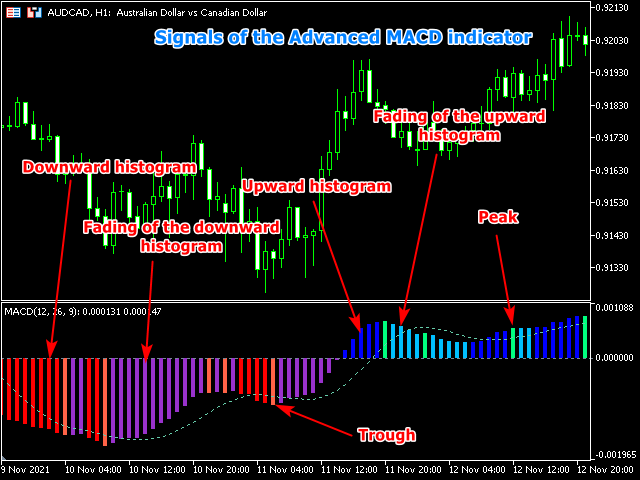
Color designation of Advanced MACD indicator histogram signals
- Blue - rising histogram
- DeepSkyBlue - fading of rising histogram
- Red - descending histogram
- DarkOrchid - fading of descending histogram
- SpringGreen - histogram peak
- Tomato - histogram trough
Modes of Advanced MACD indicator
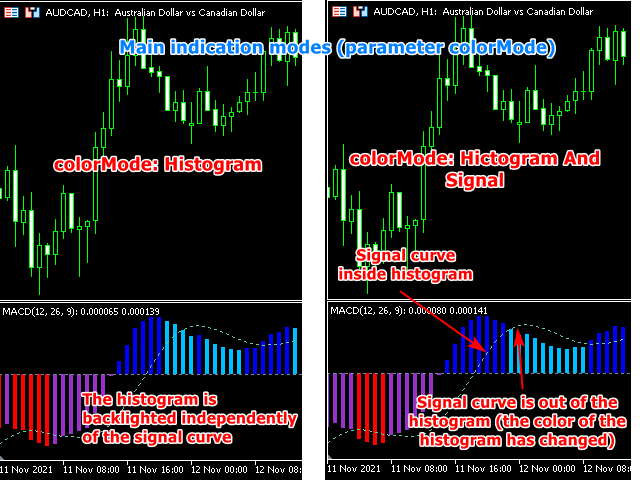
The indicator can operate in one of two main modes, for which the colorMode parameter is responsible. Colors: Blue, DeepSkyBlue, Red, DarkOrchid. Parameter values:
- Histogram - the histogram is colored according to its changes
- Histogram And Signal - the histogram is colored according to changes in the histogram and signal curve
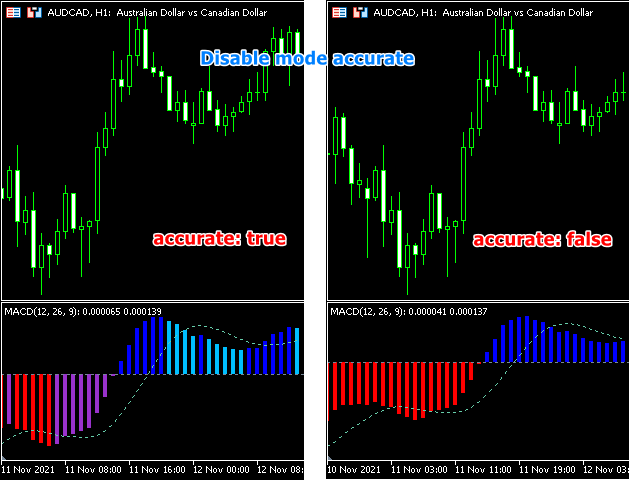
You can disable the display of these modes using the accurate option. Colors: Blue and Red. Parameter values:
- true - the histogram is colored in colorMode colors (colors: Blue, DeepSkyBlue, Red, DarkOrchid)
- false - the histogram is colored in two colors, Blue and Red
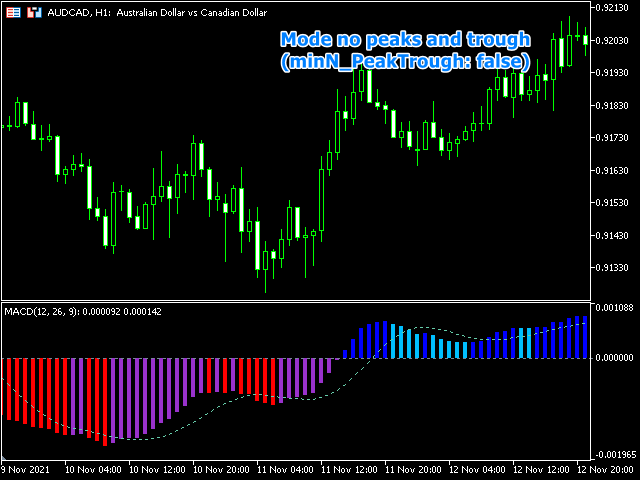
The third parameter, peak, deserves special attention. Colors: SpringGreen and Tomato. When peak is on, the indicator highlights the peaks and troughs of the histogram (absolutely similar to the Cyberdev Peak ZigZag indicator). The minN_PeakTrough parameter sets the number of bars between peaks/troughs on which there are no protruding peaks/troughs.
El usuario no ha dejado ningún comentario para su valoración