MACD Cross Alert
- Indicadores
- Versión: 1.0
- Activaciones: 5

ECHA UN VISTAZO A MIS
¡OTROS PRODUCTOS !
ECHA UN VISTAZO A MIS
¡OTROS PRODUCTOS !
¡100% DE GANANCIA POR MES----CONTÁCTAME PARA MÁS INFORMACIÓN !
MACD Cross Alert es un indicador de herramienta que notifica directamente a su teléfono cada vez que la línea de señal cruza la línea base.
Para señales más precisas, los cruces se filtran así :
- Señal de Compra: LA LÍNEA DE SEÑAL CRUZA POR ENCIMA DE LA LÍNEA BASE Y AMBAS ESTÁN POR ENCIMA DEL VALOR 0
- Señal deventa: LA LÍNEA DE SEÑAL SE CRUZA POR DEBAJO DE LA LÍNEA BASE Y AMBAS ESTÁN POR DEBAJO DEL VALOR 0
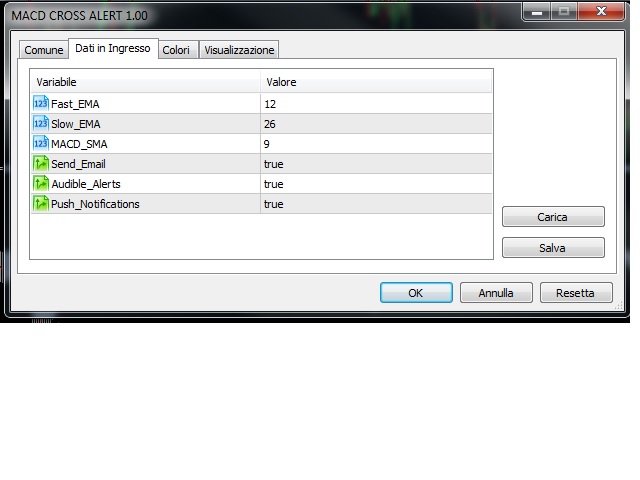
Los parámetros del MACD son personalizables según sus preferencias.
¡No se estrese delante del ordenador! Eche un vistazo a los otros Indicadores de alerta en mi perfil.
Para cualquier pregunta, no dude en ponerse en contacto conmigo ....
Feliz trading :)
El usuario no ha dejado ningún comentario para su valoración