• Información general
  • Comentarios
  • Discusión (1)
  • Novedades

MTF Moving Trender

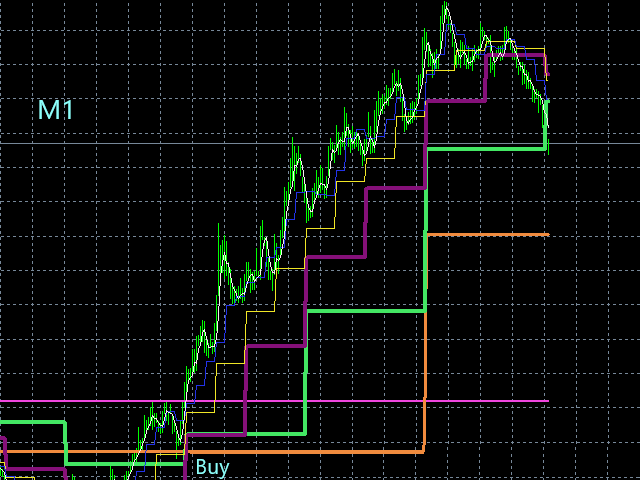
This indicator displays a modified version of Moving Averages for multiple time frames:

Current (TF indicator is attached to), M5, M15, M30, H1, H4, Daily, Weekly and Monthly.

NB: Make sure to download currency history before testing and use.

No need to set up the indicator.

Features an audible alert function for the current chart's line.

How to use:

  • Simply attach to M5 chart.
  • Hover over the lines to see the line's time frame.
  • Buy when more than two MTF lines cross closely together below the price. 
  • Sell when more than two MTF lines cross closely together above the price.
  • Example: M5-M15-M30-H1
  • Best results on Major pairs, but can also be used on other pairs.


Important to note:

  • Please combine this indicator with your other tools for best results.
  • Always test your strategy on a demo account before using a new indicator on a live account.
  • You use this indicator at your own risk.
  • Do not risk money you cannot afford to lose.
Productos recomendados
Strong Retracement Points Pro demo edition! SRP (Strong Retracement/Reversal Points) is a powerful and unique support and resistance indicator. It displays the closest important levels which we expect the price retracement/reversal! If all level are broken from one side, it recalculates and draws new support and resistance levels, so the levels might be valid for several days depending on the market! If you are still hesitating to start using this wonderful tool, you can check this link to see h
Owl smart levels
Sergey Ermolov
4.34 (35)
Versión MT5  |   FAQ El   Indicador Owl Smart Levels   es un sistema comercial completo dentro de un indicador que incluye herramientas de análisis de mercado tan populares como   los fractales avanzados de Bill Williams , Valable ZigZag que construye   la estructura de onda correcta   del mercado y   los niveles de Fibonacci   que marcan los niveles exactos de entrada. en el mercado y lugares para tomar ganancias. Descripción detallada de la estrategia Instrucciones para trabajar con el indi
VR Cub
Vladimir Pastushak
VR Cub es un indicador para obtener puntos de entrada de alta calidad. El indicador fue desarrollado para facilitar los cálculos matemáticos y simplificar la búsqueda de puntos de entrada a una posición. La estrategia comercial para la cual se diseñó el indicador ha demostrado su eficacia durante muchos años. La simplicidad de la estrategia comercial es su gran ventaja, que permite que incluso los operadores novatos negocien con éxito con ella. VR Cub calcula los puntos de apertura de posiciones
Noize Absorption Index MT4
Ekaterina Saltykova
5 (1)
Noize Absorption Index - is the manual trading system that measures the difference of pressure between bears forces and bulls forces. Green line - is a noize free index that showing curent situation. Zero value of index shows totally choppy/flat market.Values above zero level shows how powerfull bullish wave is and values below zero measures bearish forces.Up arrow appears on bearish market when it's ready to reverse, dn arrow appears on weak bullish market, as a result of reverse expectation. S
Los indicadores [ZhiBiCCI] son ​​adecuados para todos los ciclos de uso y también son adecuados para todas las variedades de mercado. [ZhiBiCCI] La línea verde sólida es una reversión de la divergencia alcista. La línea de puntos verde es una divergencia alcista clásica. [ZhiBiCCI] La línea continua hacia el rojo es una divergencia bajista inversa. La línea roja punteada es una divergencia bajista clásica. [ZhiBiCCI] puede configurarse en los parámetros (Alerta, Enviar correo, Enviar notif
The indicator displays the data of the Stochastic oscillator from a higher timeframe on the chart. The main and signal lines are displayed in a separate window. The stepped response is not smoothed. The indicator is useful for practicing "manual" forex trading strategies, which use the data from several screens with different timeframes of a single symbol. The indicator uses the settings that are identical to the standard ones, and a drop-down list for selecting the timeframe. Indicator Parame
Chart Patterns Detect 15 patterns (Ascending Triangle, Descending Triangle, Rising Wedge, Falling Wedge, Bullish Flag, Bearish Flag, Bullish Rectangle, Bearish Rectangle Symmetrical triangle, Head and Shoulders, Inverted Head and Shoulders, Triple top, Triple Bottom, Double Top, Double Bottom) Use historical data to calculate the probability of each pattern to succeed (possibility to filter notification according to the chance of success) gives graphic indication about the invalidation level and
Super Reversal Pattern
Parfait Mujinga Ndalika
Super Reversal Pattern Indicator Unlock the power of advanced pattern recognition with our Super Reversal Pattern Indicator. Designed for traders seeking precision and reliability, this indicator identifies one of the most effective reversal patterns in technical analysis, offering a significant edge in your trading strategy. Key Features: Non-Repainting Accuracy: Enjoy the confidence of non-repainting technology. Once a Super Reversal Pattern is detected, it remains static, providing consis
Sto Signal AM
Andriy Matviyevs'kyy
This indicator displays Stochastic osc signals on the price chart and allows the user to receive notifications of such signals. The Stochastic indicator is a classic and proven indicator of the technical analysis of the markets. Despite its age, it is still relevant today. Depending on the settings, the indicator allows you to work effectively on various TFs and any markets. Signals are given on fully formed bars and are not redrawn. Custom Parameters: Stochastic_Price (0-1) - The applied pric
FREE
Alpha Trend
Evgeny Belyaev
3.33 (3)
Alpha Trend is a trend indicator for the MetaTrader 4 platform; it has been developed by a group of professional traders. The Alpha Trend indicator finds the most probable tendency reversal points, which allows making trades at the very beginning of a trend. This indicator features notifications, which are generated whenever a new signal appears (alert, email, push-notification). This allows you to open a position in a timely manner. Alpha Trend does not redraw, which makes it possible to evalua
Advanced Stochastic Scalper - is a professional indicator based on the popular Stochastic Oscillator. Advanced Stochastic Scalper is an oscillator with dynamic overbought and oversold levels, while in the standard Stochastic Oscillator, these levels are static and do not change. This allows Advanced Stochastic Scalper to adapt to the ever-changing market. When a buy or a sell signal appears, an arrow is drawn on the chart and an alert is triggered allowing you to open a position in a timely mann
Binary Options Support Resistance Indicator This indicator is designed for binary options trading and effectively shows retracements from support and resistance levels. Signals appear on the current candle. A red arrow pointing downwards indicates a potential selling opportunity, while a blue arrow pointing upwards suggests buying opportunities. All that needs adjustment is the color of the signal arrows. It is recommended to use it on the M1-M5 timeframes as signals are frequent on these timef
Retroceso de Fibonacci & Herramientas de Dibujo de Líneas Extendidas Retroceso de Fibonacci & Herramientas de Dibujo de Líneas Extendidas son aptos para la plataforma MT4 y para operadores que emplean el método de negociación de puntos y la negociación de sección áurea. Ventajas: Sin líneas excusadas ni las excesivamente largas, y es fácil de observar y descubrir oportunidades de negociación. Versión de prueba: https://www.mql5.com/zh/market/product/35884 Funciones principales: 1.
Wolfe waves ultra
Ruslan Pishun
5 (1)
Wolfe waves ultra draws Wolfe Waves automatically. The indicator searches for the Wolfe Waves on three timeframes. This indicator is especially accurate because it waits for a breakout in the wave direction before signaling the trade, resulting in a very high winning ratio. Features Amazingly easy to trade. The indicator is able to recognize all Wolfe Wave patterns in a specified interval. Thus, we check each extremum for the potential 1,2,3,4,5 points apart from ZigZag vertices. The indicator
The Th3Eng PipFinite indicator is based on a very excellent analysis of the right trend direction with perfect custom algorithms. It show the true direction and the best point to start trading. With StopLoss point and Three Take Profit points. Also it show the right pivot of the price and small points to order to replace the dynamic support and resistance channel, Which surrounds the price. And Finally it draws a very helpful Box on the left side on the chart includes (take profits and Stop loss
Heiken Ashi candle chart is an improved version of The Japanese candle chart, which can effectively filter the market "noise" of the Japanese candle chart. It is favored by many traders for its simplicity and intuition. For trend traders, the HA candle chart is a magic tool. Unlike the traditional Japanese candle chart, Heikenashi does not reflect the opening price, high price, low price and closing price of the market. Instead, Heikenashi calculates the value of a single K line in the dominant
Indicator for binary options arrow is easy to use and does not require configuration works on all currency pairs, cryptocurrencies buy signal blue up arrow sell signal red down arrow tips do not trade during news and 15-30 minutes before their release, as the market is too volatile and there is a lot of noise it is worth entering trades one or two candles from the current period (recommended for 1 candle) timeframe up to m 15 recommended money management fixed lot or fixed percentage of the depo
Infinity Trend Pro
Yaroslav Varankin
1 (1)
This is a trend indicator without redrawing Developed instead of the binary options strategy (by the color of the Martingale candlestick) Also works well in forex trading When to open trades (binary options) A signal will appear in the place with a candle signaling the current candle It is recommended to open a deal for one candle of the current timeframe M1 and M5 When a blue dot appears, open a deal up When a red dot appears, open a trade down. How to open trades on Forex. When a signal is rec
PABT Pattern Indicator - it's classical system one of the signal patterns. Indicator logic - the Hi & Lo of the bar is fully within the range of the preceding bar, look to trade them as pullback in trend. In the way if indicator found PABT pattern it's drawing two lines and arrow what showing trend way.  - First line - it's entry point and drawing at: 1. On the high of signal bar or on middle of the signal bar (depending from indicator mode) for buy; 2. On the low of signal bar or on middle of t
Laser Trend
Nicolas Zouein
The trend is your friend! This is what this indicator is all about. Follow this famous saying and be safe. Characteristics: Buy/Sell signals fixed on the close of a bar. Works on all symbols and all timeframes. Clear visual market trend laser line, Buy/Sell signal arrows, market strength meter, TP1 & TP2 boxes. Visual signals when to enter, when to exit the market. No repainting. Compatible with Flexible EA for trading automation. (Ask for a free set file optimized to perform 2010-2018) Para
DYJ Alligator SignalSource   is based on Alligator   indicator. It can be used for any currency pair and timeframe. The blue line (Alligator's Jaw) is the Balance Line for the timeframe that was used to build the chart (13-period Smoothed Moving Average, moved into the future by 8 bars); Red Line (Alligator's Teeth) is the Balance Line for the value timeframe of one level lower (8-period Smoothed Moving Average, moved by 5 bars into the future); Green Line (Alligator's Lips) is the Balance Line
HMA Trend Professional MT4
Pavel Zamoshnikov
4.57 (7)
Improved version of the free HMA Trend indicator (for MetaTrader 4) with statistical analysis. HMA Trend is a trend indicator based on the Hull Moving Average (HMA) with two periods. HMA with a slow period identifies the trend, while HMA with a fast period determines the short-term movements and signals in the trend direction. The main differences from the free version: Ability to predict the probability of a trend reversal using analysis of history data. Plotting statistical charts for analyz
Lyne
Maksim Kalachev
About the Lyne indicator Lyne is a Metatrader 4 (MT4) indicator, the essence of which is to transform the accumulated historical data. The Lyne indicator makes it possible to detect various features and patterns in price dynamics that are invisible to the naked eye. Based on this information, traders can anticipate further price movement and adjust their strategy accordingly. This indicator has proven itself in the scalping strategy. The indicator works without repainting.
Title : Market Bias Indicator - Oscillator-Based Trading Tool Introduction : Discover the potential of the "Market Bias Indicator," a revolutionary oscillator-based trading tool designed for precise market analysis. If you're in search of a robust alternative to traditional bias indicators, your quest ends here. Market Bias Indicator offers unparalleled accuracy in identifying market sentiment and is your gateway to confident trading decisions. Recommended Trading Pairs : Market Bias Indicator i
Master Scalping M1 es un indicador innovador que utiliza un algoritmo para determinar la tendencia de forma rápida y precisa. El indicador calcula el tiempo de apertura y cierre de posiciones, los algoritmos del indicador le permiten encontrar los momentos ideales para ingresar a una operación (comprar o vender un activo), lo que aumenta el éxito de las transacciones para la mayoría de los comerciantes. Beneficios del indicador: Fácil de usar, no sobrecarga el gráfico con información innecesari
Le presentamos el indicador "Candle closing counter", que se convertirá en su asistente indispensable en el mundo del trading. Es por eso que saber cuándo se cerrará la vela puede ayudar: Si usted tiene gusto de negociar usando patrones de la vela, usted sabrá cuando la vela será cerrada. Este indicador le permitirá comprobar si se ha formado un patrón conocido y si hay una posibilidad de negociación. El indicador le ayudará a prepararse para la apertura del mercado y el cierre del mercado.
Trend Monitor
Pavel Zamoshnikov
4 (4)
The indicator generates early signals basing on ADX reading data combined with elements of price patterns. Works on all symbols and timeframes. The indicator does not redraw its signals. You see the same things on history and in real time. For better visual perception signals are displayed as arrows (in order not to overload the chart). Features Easy to use. Filter configuration only requires selection of sensitivity in the " Sensitivity of the indicator " input. Signals can be filtered usin
The indicator detects and displays 3 Drives harmonic pattern (see the screenshot). The pattern is plotted by the extreme values of the ZigZag indicator (included in the resources, no need to install). After detecting the pattern, the indicator notifies of that by a pop-up window, a mobile notification and an email. The indicator highlights the process of the pattern formation and not just the complete pattern. In the former case, it is displayed in the contour triangles. After the pattern is com
ROYAL DUTCH SKUNK USES THE TREND WAVE INDICATOR AND IT CAN IDENTIFY THE BEGINNING AND THE END OF A NEW WAVE TREND MOVEMENT. AS AN OSCILLATOR, THE INDICATOR IDENTIFIES THE OVERBOUGHT AND OVERSOLD ZONES. IT WORKS GREAT TO CATCH THE SHORT TERM PRICE REVERSALS AND USES A MARTINGALE STRATEGY TO CLOSE ALL TRADES IN PROFIT. USE DEFAULT SETTINGS ON H1 OR HIGHER TIME FRAME ON ANY PAIR FOR MORE ACCURATE TRADES WHY THIS EA : Smart entries calculated by 6 great strategies The EA can be run on even a $20000
Stepping Trend
Mpendulo Chiliza
The Stepping Trend Indicator     The Steppi ng Trend indicator uses the  average true range  (ATR indicator) in its calculation. This gives you control to set your own average true range period, I set the Default as 10.   Indicator Details. Green Arrow Up: This means you are at the starting point of a new bullish trend, it’s time to buy.   Red  Arrow  Down : This means you are at the starting point of a new  bearish  trend, it’ s time to sell .   What if you miss the Arrow Signal?   No
Los compradores de este producto también adquieren
Gann Made Easy
Oleg Rodin
4.85 (82)
Gann Made Easy es un sistema de comercio de Forex profesional y fácil de usar que se basa en los mejores principios de comercio utilizando la teoría del Sr. W. D. Gann. El indicador proporciona señales precisas de COMPRA y VENTA, incluidos los niveles de Stop Loss y Take Profit. Puede comerciar incluso sobre la marcha utilizando notificaciones PUSH. ¡Por favor, póngase en contacto conmigo después de la compra! ¡Compartiré mis consejos comerciales con usted y excelentes indicadores de bonificació
TPSpro RFI Levels
Roman Podpora
4.82 (22)
反转第一脉冲水平 (RFI)     指示     俄羅斯     -        ESP   Recomendamos utilizar con   el indicador -   TPSpro 趋势专业版 -   MT5版本 Un elemento clave importante en el comercio son las zonas o niveles a partir de los cuales se toman decisiones para comprar o vender un instrumento comercial. A pesar de los intentos de los grandes actores de ocultar su presencia en el mercado, inevitablemente dejan rastros. Nuestra tarea era aprender a encontrar estos rastros e interpretarlos correctamente. Funciones principales:
Gold Stuff
Vasiliy Strukov
4.89 (238)
Gold Stuff: un indicador de tendencia diseñado específicamente para el oro, también se puede usar en cualquier instrumento financiero. El indicador no se vuelve a dibujar ni se retrasa. El marco de tiempo recomendado es H1. Este indicador está escrito por EA Gold Stuff Advisor, puede encontrarlo en mi perfil.  Puede obtener una copia gratuita de nuestro indicador Strong Support y Trend Scanner, por favor envíe un mensaje privado. ¡a mí! IMPORTANTE! Póngase en contacto conmigo inmediatamente d
Atomic Analyst
Issam Kassas
5 (2)
En primer lugar, vale la pena enfatizar que este Indicador de Trading no repinta, no redibuja y no se retrasa, lo que lo hace ideal tanto para el trading manual como para el automatizado. Manual del usuario: configuraciones, entradas y estrategia. El Analista Atómico es un Indicador de Acción del Precio PA que utiliza la fuerza y el impulso del precio para encontrar una mejor ventaja en el mercado. Equipado con filtros avanzados que ayudan a eliminar ruidos y señales falsas, y aumentan el poten
Trend Punch
Mohamed Hassan
4.95 (19)
This indicator is unstoppable when combined with our other indicator called  Support & Resistance . After purchase, send us a message and you will get it   for  FREE as a BONUS! Introducing Trend Punch , the revolutionary forex trend indicator that will transform the way you trade! Trend Punch is uniquely designed to provide precise buy and sell arrows during strong market trends, making your trading decisions clearer and more confident. Whether you're trading major currency pairs or exotic sym
TPSproTREND PrO
Roman Podpora
4.79 (19)
TPSpro TREND PRO   es un indicador de tendencia que analiza automáticamente el mercado y proporciona información sobre la tendencia y cada uno de sus cambios, además de dar señales para ingresar operaciones sin volver a dibujar. El indicador utiliza cada vela, analizándolas por separado. refiriéndose a diferentes impulsos: impulso hacia arriba o hacia abajo. ¡Puntos de entrada exactos a transacciones de divisas, criptomonedas, metales, acciones e índices! Versión MT5                   DESCRIPCI
Trend Screener
STE S.S.COMPANY
4.8 (87)
Indicador de tendencia, solución única e innovadora para el comercio y filtrado de tendencias con todas las funciones de tendencias importantes integradas en una sola herramienta. Es un indicador 100% sin repintar de marcos temporales y monedas múltiples que se puede usar en todos los símbolos/instrumentos: divisas, materias primas, criptomonedas, índices y acciones. OFERTA POR TIEMPO LIMITADO: El indicador de detección de soporte y resistencia está disponible por solo 50$ y de por vida. (Precio
FX Power MT4 NG
Daniel Stein
5 (12)
Obtenga su actualización diaria del mercado con detalles y capturas de pantalla a través de nuestro Morning Briefing aquí en mql5 y en Telegram ! FX Power MT4 NG es la nueva generación de nuestro popular medidor de fuerza de divisas, FX Power. ¿Y qué ofrece este medidor de fuerza de nueva generación? Todo lo que le encantaba del FX Power original PLUS Análisis de fuerza de ORO/XAU Resultados de cálculo aún más precisos Períodos de análisis configurables individualmente Límite de cálculo persona
FX Volume
Daniel Stein
4.58 (33)
Obtenga su actualización diaria del mercado con detalles y capturas de pantalla a través de nuestro Morning Briefing aquí en mql5 y en Telegram ! FX Volume es el PRIMER y ÚNICO indicador de volumen que proporciona una visión REAL del sentimiento del mercado desde el punto de vista de un bróker. Proporciona una visión impresionante de cómo los participantes institucionales del mercado, como los brokers, están posicionados en el mercado Forex, mucho más rápido que los informes COT. Ver esta info
Scalper Inside PRO
Alexey Minkov
4.73 (56)
An exclusive indicator that utilizes an innovative algorithm to swiftly and accurately determine the market trend. The indicator automatically calculates opening, closing, and profit levels, providing detailed trading statistics. With these features, you can choose the most appropriate trading instrument for the current market conditions. Additionally, you can easily integrate your own arrow indicators into Scalper Inside Pro to quickly evaluate their statistics and profitability. Scalper Inside
- Real price is 80$ - 40% Discount ( It is 49$ now ) Contact me for instruction, add group and any questions! Related EA Product: Bitcoin Expert Introduction The breakout and retest strategy is traded support and resistance levels. it involves price breaking through a previous level.  The break and retest strategy is designed to help traders do two main things, the first is to avoid false breakouts. Many false breakouts start with a candlestick that breaks out of a level but ends with an immedi
Enigmera
Ivan Stefanov
5 (3)
ENIGMERA: El núcleo del mercado https://www.enigmera.com Introducción Este indicador y sistema de negociación es un enfoque extraordinario de los mercados financieros. ENIGMERA utiliza los ciclos fractales para calcular con precisión los niveles de soporte y resistencia. Muestra la auténtica fase de acumulación y proporciona dirección y objetivos.  Un sistema que funciona tanto si estamos en una tendencia como en una corrección.  ¿Cómo funciona? ENIGMERA consta de tres líneas: la línea de s
El indicador Chart Patterns All-in-One ayuda a los traders a visualizar varios patrones de gráficos comúnmente utilizados en el análisis técnico. Este indicador apoya la identificación de posibles comportamientos del mercado, pero no garantiza rentabilidad. Se recomienda probar el indicador en modo demo antes de comprar. Oferta actual : Descuento del 50% en el indicador "Chart Patterns All in One". Patrones incluidos : Patrón 1-2-3 : Detecta reversiones del mercado utilizando tres puntos clave (
MetaBands M4
Vahidreza Heidar Gholami
5 (2)
MetaBands utiliza algoritmos potentes y únicos para dibujar canales y detectar tendencias para que pueda proporcionar a los traders puntos potenciales para entrar y salir de operaciones. Es un indicador de canal junto con un potente indicador de tendencia. Incluye diferentes tipos de canales que se pueden fusionar para crear nuevos canales simplemente utilizando los parámetros de entrada. MetaBands utiliza todos los tipos de alertas para notificar a los usuarios sobre eventos del mercado. Caract
Conviértase en un Breaker Trader y obtenga beneficios de los cambios en la estructura del mercado a medida que se invierte el precio. El indicador de ruptura de bloque de órdenes identifica cuándo una tendencia o movimiento de precio se acerca al agotamiento y está listo para revertirse. Le alerta sobre cambios en la estructura del mercado que generalmente ocurren cuando una reversión o un retroceso importante están a punto de suceder. El indicador utiliza un cálculo patentado que identific
¡Actualmente 20% OFF ! ¡La mejor solución para cualquier novato o trader experto! Este software funciona con 28 pares de divisas. Se basa en 2 de nuestros principales indicadores (Advanced Currency Strength 28 y Advanced Currency Impulse). Proporciona una gran visión general de todo el mercado de divisas. Muestra los valores de Advanced Currency Strength, la velocidad de movimiento de las divisas y las señales para 28 pares de divisas en todos los (9) marcos temporales. Imagine cómo mejorar
Bomb Bank Signal
Igor Pereira Calil
5 (1)
Señal de Bomb Bank: su indicador de confianza en MetaTrader 4 Bomb Bank Signal es un poderoso indicador para MetaTrader 4, diseñado para identificar las tendencias más relevantes en el mercado financiero. Si buscas una herramienta que anticipe los movimientos con precisión, el Bomb Bank es el aliado que necesitas. Cómo funciona: Este indicador combina tres métodos distintos (análisis de volumen, cierre de velas y tendencia simétrica) para detectar y señalar oportunidades de compra y venta
Trend Cutter
Oleg Rodin
5 (2)
Trend Cutter es un indicador de tendencia que se puede utilizar con cualquier período de tiempo, incluidos los períodos de tiempo más bajos como M1 y M5. El indicador es ideal para los operadores que prefieren el comercio intradiario y también será útil para aquellos que prefieren el comercio a largo plazo. Puede utilizar este indicador como base para su sistema comercial o como una solución comercial independiente. El indicador proporciona todo tipo de alertas, incluidas notificaciones PUSH. El
Currency Strength Wizard es un indicador muy poderoso que le proporciona una solución todo en uno para operar con éxito. El indicador calcula el poder de este o aquel par de divisas utilizando los datos de todas las monedas en múltiples marcos de tiempo. Estos datos se representan en forma de índice de moneda fácil de usar y líneas eléctricas de moneda que puede usar para ver el poder de esta o aquella moneda. Todo lo que necesita es adjuntar el indicador al gráfico que desea operar y el indicad
TakePropips Donchian Trend Pro
Eric John Pajarillaga Aldana
4.44 (16)
¡TakePropips Donchian Trend Pro   (MT4) es una herramienta poderosa y efectiva que detecta automáticamente la dirección de la tendencia utilizando el Canal Donchian y le proporciona señales comerciales de entrada y salida! Este indicador multifunción incluye un escáner de tendencias, señales comerciales, panel estadístico, filtro, sesiones comerciales y panel de historial de alertas. ¡Está diseñado para proporcionarle señales comerciales y ahorrarle horas analizando los gráficos! Puede descargar
Supply and Demand Dashboard PRO
Bernhard Schweigert
4.8 (20)
¡Actualmente 20% OFF ! Este tablero de instrumentos es una pieza muy poderosa de software de trabajo en múltiples símbolos y hasta 9 marcos de tiempo. Se basa en nuestro indicador principal (Mejores críticas: Advanced Supply Demand ).  El tablero de instrumentos da una gran visión general. Se muestra:  Valores filtrados de Oferta y Demanda, incluyendo la calificación de fuerza de la zona, Pips distancias a / y dentro de las zonas, Destaca las zonas anidadas, Da 4 tipos de alertas para los s
ACTUALMENTE 26% DE DESCUENTO ¡La mejor solución para cualquier operador novato o experto! Este indicador es una herramienta única, de alta calidad y asequible porque hemos incorporado una serie de características propias y una nueva fórmula. ¡Con sólo UN gráfico puede leer la Fuerza de la Divisa para 28 pares de Divisas! Imagínese cómo mejorará su operativa porque podrá señalar el punto exacto de activación de una nueva tendencia o de una oportunidad de scalping. Manual del usuario: haga
ACTUALMENTE 31% DE DESCUENTO Este indicador es una herramienta de transacción única, de alta calidad y asequible porque hemos incorporado una serie de características propias y una fórmula secreta. Con solo un gráfico, da Alertas para los 28 pares de divisas. ¡Imagina cómo mejorarás porque puedes identificar el punto de activación exacto de una nueva tendencia u oportunidad de crecimiento! Basado en nuevos algoritmos subyacentes , hace que sea aún más fácil identificar y confirmar operaciones po
IX Power MT4
Daniel Stein
5 (5)
IX Power lleva por fin la insuperable precisión de FX Power a los símbolos que no son de Forex. Determina con exactitud la intensidad de las tendencias a corto, medio y largo plazo de tus índices, acciones, materias primas, ETF e incluso criptodivisas favoritas. Puede analizar todo lo que su terminal le ofrece. Pruébalo y experimenta cómo tu timing mejora significativamente a la hora de operar. Características principales de IX Power Resultados de cálculo 100% precisos y sin repintado -
Stratos Pali Indicator   is a revolutionary tool designed to enhance your trading strategy by accurately identifying market trends. This sophisticated indicator uses a unique algorithm to generate a complete histogram, which records when the trend is Long or Short. When a trend reversal occurs, an arrow appears, indicating the new direction of the trend. Important Information Revealed Leave a review and contact me via mql5 message to receive My Top 5 set files for Stratos Pali at no cost! D
Dibuja automáticamente los niveles de soporte y resistencia MÁS los gaps de las velas de propulsión en su gráfico, para que pueda ver hacia dónde es probable que el precio se dirija a continuación y/o potencialmente retroceda. Este indicador está diseñado para ser utilizado como parte de la metodología de negociación de posiciones que se enseña en mi sitio web (The Market Structure Trader) y muestra información clave para la orientación y entradas potenciales. Hay 2 características PRINCIPA
Este tablero es una herramienta de alerta para usar con el indicador de reversión de la estructura del mercado. Su propósito principal es alertarlo sobre oportunidades de reversión en marcos de tiempo específicos y también para volver a probar las alertas (confirmación) como lo hace el indicador. El tablero está diseñado para ubicarse en un gráfico por sí solo y funcionar en segundo plano para enviarle alertas sobre los pares y marcos de tiempo elegidos. Fue desarrollado después de que muchas p
Gold Channel is a volatility-based indicator, developed with a specific timing algorithm for the XAUUSD pair, which consists of finding possible corrections in the market. This indicator shows two outer lines, an inner line (retracement line) and an arrow sign, where the theory of the channel is to help identify overbought and oversold conditions in the market. The market price will generally fall between the boundaries of the channel. If prices touch or move outside the channel it is a tra
El sistema PRO Renko es un sistema de trading de alta precisión especialmente diseñado para operar gráficos RENKO. Se trata de un sistema universal que se puede aplicar a diversos instrumentos de negociación. El sistema neutraliza eficazmente el llamado ruido de mercado, lo que le brinda acceso a señales de reversión precisas. El indicador es muy fácil de usar y solo tiene un parámetro responsable de la generación de señales. Puede adaptar fácilmente la herramienta a cualquier instrumento com
Ante todo, vale la pena enfatizar que esta Herramienta de Trading es un Indicador No Repintado, No Redibujado y No Retrasado, lo que la hace ideal para el trading profesional. Curso en línea, manual del usuario y demostración. El Indicador de Conceptos de Acción del Precio Inteligente es una herramienta muy potente tanto para traders nuevos como experimentados. Combina más de 20 indicadores útiles en uno solo, combinando ideas avanzadas de trading como el Análisis del Trader del Círculo Interio
Otros productos de este autor
Trend Radar Chart Tracker
Natasha Diedericks
4 (1)
Easily track and trade with the trend using this indicator. Uses a circle and line to indicate the trend direction. Excellent for channels. Features alert function. Parameter TrendPeriod can be changed to your preference. How to use: Simply attach to any chart. Blue circle plus blue line cross below price = Buy. Red circle plus red line  cross above price = Sell. Best results when taking higher time frames into consideration before entering a trade. (Hint: Wait for the radar/circle to appear on
FREE
This indicator takes input from the ADX from multiple time frames (M/W/D/H4/H1), and presents the output on the main chart. Great for scalping. Features alert for current chart's ADX. TrendLine period setting. How to use: Simply attach to any chart. User can set the period for ADX(Monthly, Weekly, Daily, H4, H1,Current chart) Zoom chart out completely. Hover over the lines to see the time frame applicable. Buy when Multi ADX below price; also blue dots and white line below price. Sell when Mul
This indicator uses a special algorithm to plot the 4 lines for trading. Great for scalping. Does not feature any alerts and is best used manually after confirming the line displays. No need to set up the indicator. How to use: Attach to any chart. Can be used on any time frame. If used on lower time frames, check higher time frames for confirmation. Buy : - Wait for green and white lines to be above the level 50 dotted line, then open buys. - Buy when the green line crosses below the white line
Price Trender mt4
Natasha Diedericks
This indicator uses a special algorithm to plot the 4 lines for trading. Great for scalping. Features alerts. Settings for trend filters. How to use: Simply attach to any chart with default settings. Buy when the three pink lines converge below the green line. Sell when the three pink lines converge above the green line. Best results when looking at three or more time frames, and the three blue lines have just converged below or above the green line. Use as you see fit for your strategy. Best r
ZigZag Bullets
Natasha Diedericks
5 (1)
This indicator takes input from the ZigZag and ADX indicators, combined with a special trend algorithm. You also get a Moving Average on the chart to determine trend direction. Great for scalping. Perfect for channels. Features alert functions. BulletPeriod. Parameter TrendLinePeriod for the MA line. Change to your preference. Try 200. How to use: Simply attach to any chart. Sell on red bullets, with red MA line above price. Enter on bullets closest to this line. Buy on blue bullets, with blue
Trend Alligator
Natasha Diedericks
5 (1)
This indicator takes input from the Alligator indicator. Great for scalping. Great for identifying new trends. This indicator can be used on all time frames and pairs. Features alert functions. Parameters: Alerts JawsPeriod JawsShift TeethPeriod TeethShift LipsPeriod LipsShift How to use: Simply attach to any chart with default settings. Sell when all 3 red lines cross above white line. Buy when all 3 blue lines cross below white line. Best results when checking the higher time frames (3 or
Trend SR
Natasha Diedericks
This indicator takes input from Support and Resistance levels, combined with a special trend filter. Easily spot tops and bottoms, and trade with more confidence. Great for scalping or long-term trading. This indicator can be used on all time frames and pairs. Features alert function. No need to set up the indicator. How to use: Simply attach to any chart. Red histogram line color = Selling opportunities. Blue histogram line color = Buying opportunities. See pictures below. To spot highs/tops
SR Arrows
Natasha Diedericks
This indicator gives you arrows, two SR lines and a white trend line. Uses a special trend algorithm to plot the arrows, combined with support and resistance inputs. Perfect for channel trading. Features alert functions. Parameter TrendArrowPeriod. Parameter TrendLinePeriod. (Change to your preference) How to use: Simply attach to any chart with default settings. Zoom in the chart, to see the two blue SR lines and arrows more clearly. It is very important to wait for a new blue SR line to appea
This indicator gives you a modified version of three Moving Averages. Great for scalping. Does not feature any alerts, and is best used manually after confirming multi line displays. Settings: Period1  Period2 Period3 Period4 How to use: Simply attach to any chart with default settings. Buy when the 4 lines converge below the price. Sell when the 4 lines converge above the price. Take note of the slope of Period4. See example pictures below. Best results when looking at three or more time frame
ZigZag Sniper
Natasha Diedericks
This indicator gives you a modified ZigZag, combined with a special algorithm. Great for scalping. Perfect for channel trading. Parameter TrendPeriod. Features alert functions.  How to use: Simply attach to any chart with default settings. Buy when the line crosses below the price, and blue arrow. Sell when the line crosses above the price, and red arrow. It helps to keep the audible alert set to true. Best results when checking two or more timeframes before entering trades. (See comment #1 for
This indicator gives you PSar crossings in the form of blue and yellow dots on the chart, as well as a Moving Average. Parameters: MAPeriod (Change to your preference) Alerts PSarStep PSarShift PSarMaximum How to use: Simply attach to any chart with default settings. Sell on yellow dots, with white MA line above price.  Buy on blue dots, with white MA line below price. Best results when checking the higher time frames before entering trades. Best results on Major Pairs, but can also be used on o
MTF PSar Trender
Natasha Diedericks
This indicator gives you the PSars for multiple time frames: M1, M5, M15, M30, H1, H4, Daily, Weekly, Monthly. Features Alert function for current Psar. Good results on M5. How to use: Download M1 history for testing. Hover over the different colors to see different timeframes. Simply attach to any chart. Take note of higher time frames before entering trades on lower time frames. (Zoom the H1/H4/Daily chart out completely) Sell when Multiple PSars cross above the price. Example: M1-M5-M15-M30-H
Mountains
Natasha Diedericks
Visual helper for spotting peaks and troughs. Alerts. PSar settings for trend direction determination. Great for scalping. How to use: Simply attach to any chart. To spot peaks and troughs, zoom chart out completely. Sell on red dots. Best results when red dot appears on 3 or more time frames. Buy on blue dots. Best results when blue dot appears on 3 or more time frames. If used on lower timeframes (M1, M5, M15, M30), please make sure to check higher timeframes. Or backtest and use as you see fi
M1 Scalper Mt4
Natasha Diedericks
This indicator is excellent for scalping on the M1 or M5 chart. Uses a special algorithm for the lines. No need to set up the indicator. Does not feature any alerts and is best used manually after visually confirming the line displays. NB: Make sure to download M1 history before testing and use. How to use: Simply attach to M1 or M5 chart. Zoom chart out completely. Sell when all lines above the white line (PriceLine). Sniper line crosses above white line. Buy when all lines below the white li
Easily track how the price moves in a separate indicator window with this trend indicator. Great for scalping or long-term trading. Helps you find best entry points for your trades after reaching a certain level, and easily identify where you can exit your trades. This indicator can be used on all time frames and pairs. Features alert function. No need to set up the indicator. How to use: Simply attach to any chart. NB : Look to the extreme zones (oversold/overbought) when looking for new tra
Multi RSI Pro mt4
Natasha Diedericks
5 (1)
This indicator takes input from the RSI from multiple time frames (M/W/D/H4/H1), and presents the output on the main chart. Great for scalping. Features alerts for the current chart's TrendLine above or below price. TrendLine period setting. Multi RSI period settings. How to use: Simply attach to M5 (Scalping - zoom chart out completely on M5) or use on higher time frames' charts. Zoom chart out completely to get a better view of the chart. Hover over the lines to see the time frame applicable.
This indicator takes input from the RSI, combined with a trend filter. Great for scalping. Does not feature any alerts and is best used manually. Settings: TrendFilterPeriod RSIPeriod Set these parameters to your preference. How to use: Attach to any chart with default settings. Can be used on any time frame. If used on lower time frames, check higher time frames too. Buy : - Wait for blue histo color to cross above level 50, then open buys. **Best results when checking the higher time frames to
Trend Histo mt4
Natasha Diedericks
This indicator uses 2 trend filters. Great for scalping. Features alerts Settings: TrendFilterPeriod1 TrendFilterPeriod2 How to use: Attach to any chart with default settings, or set to your preference. Can be used on any time frame. If used on lower time frames, check higher time frames too. Buy : - Blue histo color. Sell : - Red histo color. Or backtest and use as you see fit for your strategy. Best results on Major Pairs, but can also be used on other pairs (Metals, Minors). Important to no
Trend Chart mt4
Natasha Diedericks
Displays multiple trend indicators on the main chart. Great for scalping. Settings: LWMA SMA SSMA EMA ADX (red and blue dots), and PSar Alerts for ADX crosses. How to use: Can be used on any time frame.  Buy : - Blue dot first. - Then PSar and 3 MAs cross below price. **Best results when confirming the higher time frames too. Sell : - Red dot first. - Then PSar and 3 MAs cross above price. **Best results when confirming the higher time frames too. Or backtest and use as you see fit for your str
This indicator takes input from the RSI from multiple time frames (M/W/D/H4/H1/M30), and presents the output as lines above or below the price, on the main chart. Great for scalping. Features alerts for the current time frame's RSI (the Arrows). Settings: RSI period settings for M/W/D/H4/H1/M30/Current. (Set to your preference) PSar settings for trend determination; for current chart's time frame. How to use: Simply attach to M5 (Scalping - zoom chart out completely on M5) or use on higher time
Uses a trend filter to plot the lines and arrows. Great for scalping. Settings: TrendPeriod: change to your preference. Alerts. How to use: Can be used on any time frame. Attached to chart, and wait for arrow to appear on multiple timeframes. Buy : -  Blue arrow and blue line cross below price on multiple time frames; e.g., on D,W,M or H1,H4,Daily or M30,H1,H4 Sell : -  Yellow arrow and red line cross above price on multiple time frames; e.g., on D,W,M   or H1, H4, Daily or  M30,H1,H4 **Best r
Pro Trader mt4
Natasha Diedericks
This indicator takes input from the RSI and a trend filter, and presents the output in a separate indicator window as a histogram. Great for scalping. Settings: No need to set up the indicator. Features Alerts. How to use: Simply attach to any chart Zoom chart in to get a better view of the histo color. Buy:  Blue histo color on multiple timeframes. (e.g,. M30-H1-H4) Sell: Red histo color  across on multiple timeframes. Or backtest and use as you see fit for your strategy. Best results on Majo
PTT mt4
Natasha Diedericks
This indicator takes input from the RSI and a trend filter, and presents the output in a separate indicator window as a histogram. Great for scalping. Settings: TrendPeriod RSIPeriod Features Alerts. How to use: Simply attach to any chart Zoom chart in to get a better view of the histo color. Buy:  Blue histo color on multiple timeframes. (e.g,. M30-H1-H4) Sell: Red histo color  across on multiple timeframes. Or backtest and use as you see fit for your strategy. Best results on Major Pairs, bu
SLT mt4
Natasha Diedericks
This indicator takes input from a trend filter and 2 oscillators, and presents the output in a separate indicator window as 2 lines and arrows. Great for scalping. Settings: No need to set up the indicator. Features Alerts. How to use: Simply attach to any chart Zoom chart in to get a better view of the lines. Buy:  Blue arrow. Best results when entering buys above the 0.00 level, and confirming on higher timeframes too. Sell: Red arrow. Best results when entering sells below the 0.00 level,   a
ADT mt4
Natasha Diedericks
This indicator takes input from Accumulation/Distribution and a trend filter, and presents the output in a separate indicator window as a histogram. Great for scalping. Settings: TrendPeriod Features Alerts. How to use: Simply attach to any chart with default setting, or set the TrendPeriod to your preference. Zoom chart in to get a better view of the histo color. Buy:  Blue histo color on multiple timeframes. (e.g., M30-H1-H4-D) Sell: Red histo color  on multiple timeframes. Or backtest and u
ADX Trend mt4
Natasha Diedericks
This indicator takes input from the ADX, and presents the output in a separate indicator window as a histogram. Great for scalping. Settings: ADXPeriod Features Alerts. How to use: Simply attach to any chart with default setting, or set the ADXPeriod to your preference. Zoom chart in to get a better view of the histo color. Buy:  Blue histo color on multiple timeframes. (e.g., M30-H1-H4-D) Sell: Red histo color  on multiple timeframes. Or backtest and use as you see fit for your strategy. Best
OBV Trend mt4
Natasha Diedericks
This indicator takes input from the OBV and a trend filter, and presents the output in a separate indicator window as a histogram. Great for scalping. Settings: TrendPeriod Features Alerts. How to use: Simply attach to any chart with default setting, or set the TrendPeriod to your preference. Zoom chart in to get a better view of the histo color. Buy:  Blue histo color on multiple timeframes. (e.g., M15-M30-H1-H4) Sell: Red histo color  on multiple timeframes. Or backtest and use as you see fi
Use this indicator to help determine when to open buys or sells based on the slope and direction of the channel. Excellent for scalping. Settings: TrendPeriod. Deviation. ChannelPeriod. Features Alerts. How to use: Simply attach to any chart. To use on lower timeframes (M1,M5,M30), you'll need to start setting the Deviation from 0.01 and increase it if needed. If used on lower timeframes  ( M1,M5,M30,H1), confirm on higher timeframes (H4,D,W) before entering trades. H1: Set Deviation to 0.5. H4:
Only Line mt4
Natasha Diedericks
Use this indicator to help determine when to open buys or sells based on the color of the line. Excellent for scalping. Settings: Deviation. TrendPeriod. Features Alerts. How to use: Simply attach to any chart with default settings. When used on lower timeframes (M1,M5,M30,H1), confirm on higher timeframes.  Buy:  Blue line below price. Best results when line is blue on multiple timeframes. Sell: Red line above price. Best results when line is red on multiple timeframes. Or change settin
Trend Sniper mt4
Natasha Diedericks
This indicator takes input from a trend filter to determine best entries for trades, on the crossings of the two lines. Excellent for scalping. A simple indicator that doesn't need setting up. Does not feature any alerts. How to use: Simply attach to any chart. When used on lower timeframes, also confirm on higher timeframes.  Buy:  Blue line moves to Level-0 yellow dotted line. Best results when confirming this on multiple timeframes, e.g., Daily-Weekly-Monthly. Sell: Red line moves to Level-0
Filtro:
No hay comentarios
Respuesta al comentario
Versión 1.7 2022.06.21
Alert only on current chart line.
Color update.
Performance update.
Input signal update.
Versión 1.6 2022.06.19
Buffer update.
Line color update.
Issue with line display fixed.
Issue with journal entry fixed.
Input signal updated.
Versión 1.5 2022.05.30
Input signal update.
Alert signal update.
Indicator performance update.
Versión 1.4 2021.03.22
Input Signal Update.
Versión 1.3 2021.01.15
Indicator updated.
Versión 1.2 2021.01.12
M30 added as higher TF.
Line enhancements.
Indicator performance update.
Versión 1.1 2021.01.12
Audible Alert added for the current chart's trend line.